

Abstract
We identify Rpa12p of RNA polymerase I (Pol I) as a termination factor. Combined analyses using transcription run-on, electron microscopy-visualized chromatin spreading and RT-PCR have been applied to the rRNA-encoding genes of Saccharomyces cerevisiae. These confirm that Pol I termination occurs close to the Reb1p-dependent terminator in wild-type strains. However, deletion mutants for the 3′ end-processing enzyme Rnt1p or the Rpa12p subunit of Pol I both show Pol I transcription in the spacer. For Δrpa12, these spacer polymerases are devoid of nascent transcripts, suggesting they are immediately degraded. The homology of Rpa12p to the small subunit Rpb9p of Pol II and Rpc11p of Pol III, both implicated in transcriptional termination, points to a common termination mechanism for all three classes of RNA polymerase.
The molecular mechanism of transcriptional initiation by all three classes of eukaryotic RNA polymerase is becoming well defined [see refs. 1–4 for reviews of RNA polymerase (Pol I–III)]. Even the complexity of Pol II transcription initiation and how this process switches to the elongation mode are now beginning to be unraveled (5, 6). However, Pol II termination remains enigmatic. The close coupling of mRNA 3′ end processing/polyadenylation to termination involves regulated interaction between at least some 3′ end processing activities and the phosphorylated form of the Rpb1p C-terminal domain (CTD) (7). Exactly how this complex set of proteins connects with elongating Pol II and which components of the Pol II elongation complex respond to the molecular cues that elicit termination remain to be established. However, a number of recently defined factors are now known to be involved (8, 9). For Pol III termination in yeast, a critical subunit of the enzyme, Rpc11p, is required for what may be a largely factor-independent process (3, 10). In contrast, Pol I termination in yeast has been shown to use a DNA-binding factor, Reb1p, which identifies a well defined sequence element at the 3′ ends of the primary Pol I transcription unit. Reb1p then promotes termination just upstream, over a T rich sequence that appears to operate as a polymerase release element (11, 12). In higher eukaryotes, a specific release factor has been identified (13), whereas in yeast, a similar release process may occur, although no release factor has so far been identified (14). These in vitro studies were subsequently confirmed in vivo by using S1 nuclease protection and RT-PCR analysis (15). Here 90% of transcripts terminated at the Reb1p terminator at +93 (nucleotides past the 3′ end of the 25S rRNA) and 10% read further 3′ to a so-called “failsafe” terminator site (+250). However, these steady-state analyses could not rule out the presence of unstable nascent transcription reading even further into the spacer sequence.
A valid experimental approach to investigate transcriptional termination is by use of the transcription run-on (TRO) technique. TRO provides a profile of elongation-competent polymerase across a gene that effectively delineates its primary transcription unit. This procedure has been extensively used in yeast Pol II systems (16, 17). Also two early studies on yeast Pol I (18, 19) showed by TRO analysis that termination occurs a few hundred nucleotides past the 3′ end of 25S rRNA. Our TRO results confirm and extend these data by showing that the major site of Pol I termination is close to the Reb1p-binding site as well as by demonstrating the accumulation or pausing of Pol I near this site. We then go on to investigate the possible role of two different factors, both implicated in controlling the extent of Pol I transcription. First, Rnt1p, an exonuclease III-like activity, is reported to initiate RNA processing of the pre-rRNA transcript by cleavage near the 3′ end of 25S RNA (20–22). We show here that the absence of this protein causes a significant alteration in the position of Pol I termination, suggesting that this RNA processing reaction occurs cotranscriptionally. Second, we have investigated the possible termination role of the Rpa12p subunit of Pol I. Disruption of this nonessential gene causes a growth defect at higher temperatures, possibly due to the instability of Pol I lacking Rpa12p (23, 24). Rpa12p shares sequence homology with Rpb9p (also known as B12.6) of Pol II and Rpc11p of Pol III in two regions that contain zinc ribbon domains (25). Furthermore, all three subunits are homologous to TFIIS, a well characterized Pol II elongation factor, further pointing to a common postelongation function (23, 26). Because Rpc11p has been directly implicated in Pol III termination (10) and Rpb9p is required for Pol II to respond to pause and arrest sites during elongation (27), we wished to determine whether Rpa12p plays a similar role for Pol I. TRO analysis of the Δrpa12 deletion strain shows a dramatic loss of Pol I termination, resulting in high levels of Pol I escaping the Reb1p terminator and reading into the spacer sequence. Electron microscopy (EM) visualization of these spacer Pol I complexes (28) seen with the Δrpa12 deletion strain surprisingly reveals they are for the most part devoid of attached nascent RNA. This suggests that these transcripts are directly degraded at their site of synthesis. Overall, we define a role for the Rpa12p subunit of Pol I in transcriptional termination as well as in providing insight into the mechanism of this process.
Materials and Methods
Yeast Strains. BY4733 (MATα; his3Δ200; met15Δ0; trp1Δ63; ura3Δ0; GAL10–7::URA3) was used as template for the synthesis of the TRO probes. The following strains were used in the TRO, RT-PCR, and EM experiments: MWK028 (MATa; trp1–1; ura2–52; can1–100; leu-3,112; his3-11,15; ade2–1; met2-Δ1; lys2-Δ2; LEU2::snr6), YCp50 (URA3, CEN4, ARS1, SNR6), RLY10 (MWK028 with RPA12::HIS3), RNT1 (MATa; ura3–1; trp1; ade2–1; leu2–3, 112; his3–11, 15), and Δrnt1 (RNT1 strain above with RNT1:: TRP1).
Transcription Analysis. TRO analysis was used to determine the density of actively transcribing Pol I across the rRNA genes in the various Saccharomyces cerevisiae strains. In outline, logarithmic yeast cultures are treated with sarkosyl, which arrests the actively elongating Pol I complexes as well as permeabilizing the cell membrane. Subsequent incubation of these permeabilized cells in an in vitro transcription buffer containing 32P UTP causes the arrested Pol I to extend the nascent transcript by up to several hundred nucleotides, consequently 32P labeling the transcripts. These run-on transcripts are detected by using single-stranded DNA probes (Table 1) made by isolating PCR generated fragments (by using Pfu DNA polymerase; Stratagene) from chromosomal DNA of S. cerevisiae strain BY4733. p is a negative control with a ura4 insert from Schizosaccharomyces pombe as listed. a is a positive control containing 567-bp fragment corresponding to the 5′ end of the ACT1 ORF. All inserts were ligated into the HincII site of M13mp18. TRO analysis was performed as described (16), except that the transcription conditions were 5 min at 30°C.
Table 1. MI3 probes used in TRO analysis.
| Probes | Location, bp | U content |
|---|---|---|
| S. cerevisiae | ||
| Pro | rDNA: —85/—310 (225) | 61 |
| 18S | rDNA: 2070/2284 (214) | 54 |
| 25S | rDNA: 5953/6152 (199) | 62 |
| r2 | rDNA: 6592/6730 (138) | 29 |
| r3 | rDNA: 6701/6847 (146) | 47 |
| r4 | rDNA: 6804/6972 (168) | 40 |
| r5 | rDNA: 6902/7075 (173) | 49 |
| r6 | rDNA: 6948/7128 (180) | 57 |
| r7 | rDNA: 6999/7198 (199) | 66 |
| S. pombe | ||
| neg (p) | ura4: 1227/1612 (385) | 114 |
For the RT-PCR analysis, standard conditions were used. In outline, total RNA was isolated from the various yeast strains at logarithmic growth phase, annealed with RT primers (C1-C12), and subjected to cDNA synthesis by reverse transcriptase plus RNasin. The cDNA was extracted and PCR-amplified by Taq polymerase at nonsaturating DNA concentrations and various cycle numbers with oligonucleotides P1-P3. For the Fig. 3 data, 30 cycles were used.
Fig. 3.

RT-PCR analysis of steady-state rRNA generated in wild-type, Δrnt1, and Δrpa12 strains. (A) RT-PCR across the Pol I transcription start site reveals no detectable steady-state transcription reading into the Pol I promoter region in any strain tested. RT and PCR primers used are indicated, as are their positions relative to the rDNA repeat (Fig. 1 A). PCR products are resolved by agarose gel electrophoresis. (B and C) RT-PCR analysis beyond the normal Reb1p terminator is shown for isogenic wild-type and Δrpa12 strains. Faint signals are detected up to cDNA primer C5, which maps to rDNA nucleotides 7598–7618, but the same profile is found with both strains. cDNAs were generated with primers C1–C11 and amplified by using primer P1.
Oligonucleotides. The following oligonucleotides were used as primers for the RT-PCR experiments: C1 (GGTACACTC TTACACACTA T), C2 (GCTTTTCTCA ATTCTCTAAA CT), C3 (CCATCATCAT TCCCTAGAAA CT), C4 (GCATTACACT ATATGATCGT AGT), C5 (GGTTGCTAC TACTTGAT ATGT), C6 (CACCTTATTC TCCACATCAC AAT), C7 (CCATCTATGT CTTCCACACC AT), C8 (CCTATCGGAA TACATTTTCT ACA), C9 (CAGGAAAGTA ACATCCCAAT G), C10 (GCTACTTGCA AAATATCATA CC), C11 (CCAAACTCTT TTCGAACTT), C12 (CATGGCTTAA TCTTTGAGAC), P1 (TCTTTCTAAG TGGGTACTGG), P2 (CGAGAAATAC GTAGTTAAGGC), and P3 (ATGCGAAAGC AGTTG).
EM Analysis. Miller chromatin spreads were made as described (28) with the following modifications: yeasts were grown at 21°C, and Miller chromatin spreads were made as described, except that zymolase treatment was at 21°C (28).
Results
The DNA repeat unit of ribosomal genes in S. cerevisiae is a well defined sequence comprising the three structural rRNA coding sequences 18S, 5.8S, and 25S. These are produced as a pre-rRNA transcript of 35S generated by transcription initiation on the Pol I-specific promoter and termination, upstream of a terminator sequence to which the Reb1 protein binds. Subsequently, this pre-rRNA is subjected to a complex series of RNA processing reactions (both exo- and endonucleolytic) that generate the three mature rRNA species (20). Dividing one rRNA-encoding DNA (rDNA) sequence from the next is a spacer region about half the size of the 35S gene that contains both the small Pol III-transcribed 5S gene (in opposite polarity) as well as a replication origin. The details of this repetitive sequence element are represented in Fig. 1A. As indicated, the rRNA transcript is divided into external and internal transcribed spacers. The positions of Reb1p-binding sites are shown, being present at both terminator and upstream promoter locations. Also the position of the 3′ end processing site for Rnt1p, which initiates pre-rRNA processing, is indicated.
Fig. 1.

TRO analysis of wild-type, Δrnt1, and Δrpa12 strains of S. cerevisiae across the rDNA repeat unit. (A) Diagram indicating the arrangement and location of rRNA sequences within the rDNA repeat unit. ETS and ITS denote external and internal transcribed spacers. The extent of the Pol I pre-rRNA transcript is indicated (dashed line). The positions of terminator and promoter-bound pReb1p are indicated as well as the Rnt1p cleavage site at the end of 35S pre-rRNA. The position of the failsafe terminator in the spacer is indicated by a vertical arrow and the autonomous replication sequence (ARS) by a black oval. The positions of M13 probes are denoted by horizontal bars below the gene map, whereas RT-PCR primers are indicated by horizontal arrows above the gene map (see Materials and Methods for details). (B) TRO data (hybridization signals to slot blots of single-strand DNA M13 phage probes) and their quantitative analysis for the Δrnt1 and Δrpa12 as compared to their isogenic wild-type strains. M13 probe a detects actin gene transcription by Pol II. Quantitation is fixed with all signals relative to probe r2, set as 1. All quantitations are based on multiple repeats of TROs and are corrected for background hybridization (probe p) and U content. The patterns obtained were found to be reproducible within a 10% range. The examples shown are representative images from the whole data set.
TRO Analysis on the S. cerevisiae rDNA Repeat Unit in Wild-Type and Δrnt1 and Δrpa12 Strains. To carry out TRO analysis on the wild-type and mutant S. cerevisiae strains used in this study, we generated a series of single-stranded M13 phage constructs as shown in Fig. 1 A and Table 1. These gene probes contain antisense sequences corresponding to the Pol I promoter, 18S and 25S sequences followed by a contiguous series of probes, r2-r7 reading over and well beyond the normal site of Pol I termination. Probe p detects nonspecific transcription signals, whereas probe a detects transcription from the actin gene. Two wild-type S. cerevisiae strains, isogenic with the Δrnt1 and Δrpa12 deletion strains described below, were analyzed and gave a run-on profile with very low signal over the promoter region followed by high signals over the structural genes (18S and 25S) continuing into the two immediate 3′ probes, r2 and r3 (for representative example see Fig. 1B Top). These data were subjected to quantitative analysis (shown against the isogenic mutant strains) by correcting the TRO signals for background hybridization (probe p) and U content (α32P UTP label was used in the reaction). The TRO analyses were repeated multiple times for each wild-type strain and, although absolute levels of transcription varied significantly depending on the exact growth conditions used, the profile of signals obtained was consistent. As shown in this analysis, both wild-type strains gave a 2-fold higher signal over r2 (as compared to 18S and 25S), indicative of transcriptional pausing before the Reb1p terminator. Then ≈90% of transcripts terminate before probe r4 with little signal detectable above background levels beyond probe r5. These TRO signals closely match the in vitro and steady-state in vivo data previously obtained for Pol I termination (11, 15). It should be noted that during the TRO reaction, it is likely that Pol I will extend the transcript position by several hundred nucleotides (29). We therefore predict that signals in r3 and r5 will reflect polymerase loading immediately upstream of the Reb1p and failsafe terminator regions.
TRO analysis was then carried out on the deletion mutant Δrnt1 strain. As shown in Fig. 1B Middle, there is a detectable shift in Pol I transcription as compared to the isogenic wild-type strain. This results in a 2-fold increase in the r3 signal and also a consistent increase overall of the downstream probes, including a slight increase in signal over the Pol I promoter. This experiment has been reproduced in four independent analyses and indicates that Rnt1p plays a role in determining the location and efficiency of Pol I termination. This may suggest that Rnt1p is associated with the elongating Pol I complex and processes the 35S pre-rRNA cotranscriptionally. The same mechanism is thought to occur for Pol II transcription, where CF1A and CPF cleavage/polyadenylation complexes are associated with the phosphorylated CTD of Rpb1p, thus mediating more efficient 3′ end processing as well as dictating the termination process (8).
The second mutant strain to be tested in these studies produced a more dramatic effect on Pol I termination. Deletion of RPA12, although displaying only a minor defect in cell growth, shows a substantial Pol I read-through pattern in TRO analysis (Fig. 1B Bottom). Again the data obtained were compared to the isogenic wild-type strain and were reproduced in multiple experiments. The clear involvement of this small Pol I subunit in termination may functionally explain its homology to the Rpb9p and Rpc11p subunits of Pol II and III, which are both known to have termination roles (Fig. 4A). Interestingly, the TRO pattern obtained reveals high levels of promoter signal, indicating that a significant amount of nascent transcription reads into the downstream promoter region of the next Pol I repeat unit. In view of this striking effect on Pol I distribution, it is perhaps surprising that this mutant strain has a relatively mild growth defect. This may be explicable by the fact that rRNAs are matured by endo- and exonuclease digestion of the primary transcript. Possibly any nuclear RNA with appropriate rRNA processing signals can be matured into 18S, 5.8S, and 25S rRNA. Indeed, it has been shown that rRNA transcribed from a GAL1 Pol II promoter construct is still able to produce functional rRNA (30).
Fig. 4.

Homologous mechanisms of transcriptional termination for Pol I and II. (A) Homologous small subunits (white shading) in all three polymerase classes. (B) Model showing marked similarity in the mechanisms of Pol I and II termination. Polymerases before the terminal cleavage site are colored purple and after, red, to indicate possible conformational change. The Pol II CTD tail with associated 3′ end processing factors is indicated. Both Pol I and II nascent transcripts are predicted to fold around and interact with paused polymerase. The associated 3′ processing factors will then mediate 3′ end cleavage (orange scissors). This process is facilitated by polymerase pausing, which in turn will induce transcriptional termination. For Pol I, this depends on Reb1p and may require interactions with the Pol I subunit, Rpa12p.
EM Analysis of Pol I Termination in Wild-Type and Δrpa12 Strains. The clear termination defect evident for the Δrpa12 strain based on TRO analysis led us to analyze this mutant strain by a more direct approach. This used EM (31) to analyze Miller spreads of actively transcribing yeast Pol I genes (28). This highly visual technique was used with the Δrpa12 mutant as compared to its isogenic wild-type strain. Fig. 2 shows representative examples of EM images of actively transcribing Pol I genes. At lower resolution (Fig. 2 A), both strains gave similar patterns with no evidence of nascent transcripts in the spacer sequence between two adjacent Pol I genes. However, higher-resolution pictures of the spacers (Fig. 2 C and D) reveal a striking difference between these two strains. In the wild-type strain, the spacers were typically free of polymerases except for a cluster of one to three Pol III molecules at the position of the 5S gene (28), as shown in three of the four examples (Fig. 2C, larger gray arrows). In addition, in this and other control strains (not shown), there was evidence for occasional cotranscriptional Rnt1p cleavage, as shown by one to two transcript-free polymerases at the 3′ end of the 35S gene (downward black arrows). Otherwise the spacers were devoid of polymerase-sized particles but did show some smaller particles, possibly reflecting nucleosomal structure. These patterns are aligned with the Pol I repeat unit map (Fig. 2B). In contrast, for the EM data obtained with the Δrpa12 strain, we observed significant numbers of polymerase-sized particles (upward black arrows) in the spacer sequence on either side of the Pol III transcribed 5S gene (Fig. 2D). Significantly, these spacer polymerases usually do not possess any detectable attached RNA tails. To obtain a statistical measure of this key difference between the Δrpa12 and wild-type strains, >100 Pol I gene repeat images were studied. For the wild-type strain, only 13/103 genes showed any possible presence of Pol I in the spacer sequence. In contrast, for Δrpa12,74/105 genes showed multiple polymerases apparently transcribing in the spacer sequence. It should be noted that in the TRO analysis of the Δrpa12 strain (Fig. 1B), spacer sequences gave as high as 50% signals as compared to the Pol I gene. The EM data suggest a somewhat lower (although significant) level of spacer polymerases. This difference may reflect the greater instability of this transcriptless spacer polymerase during the Miller spreading procedure. It is therefore possible that the EM analysis underrepresents the number of polymerases in the spacer region.
Fig. 2.
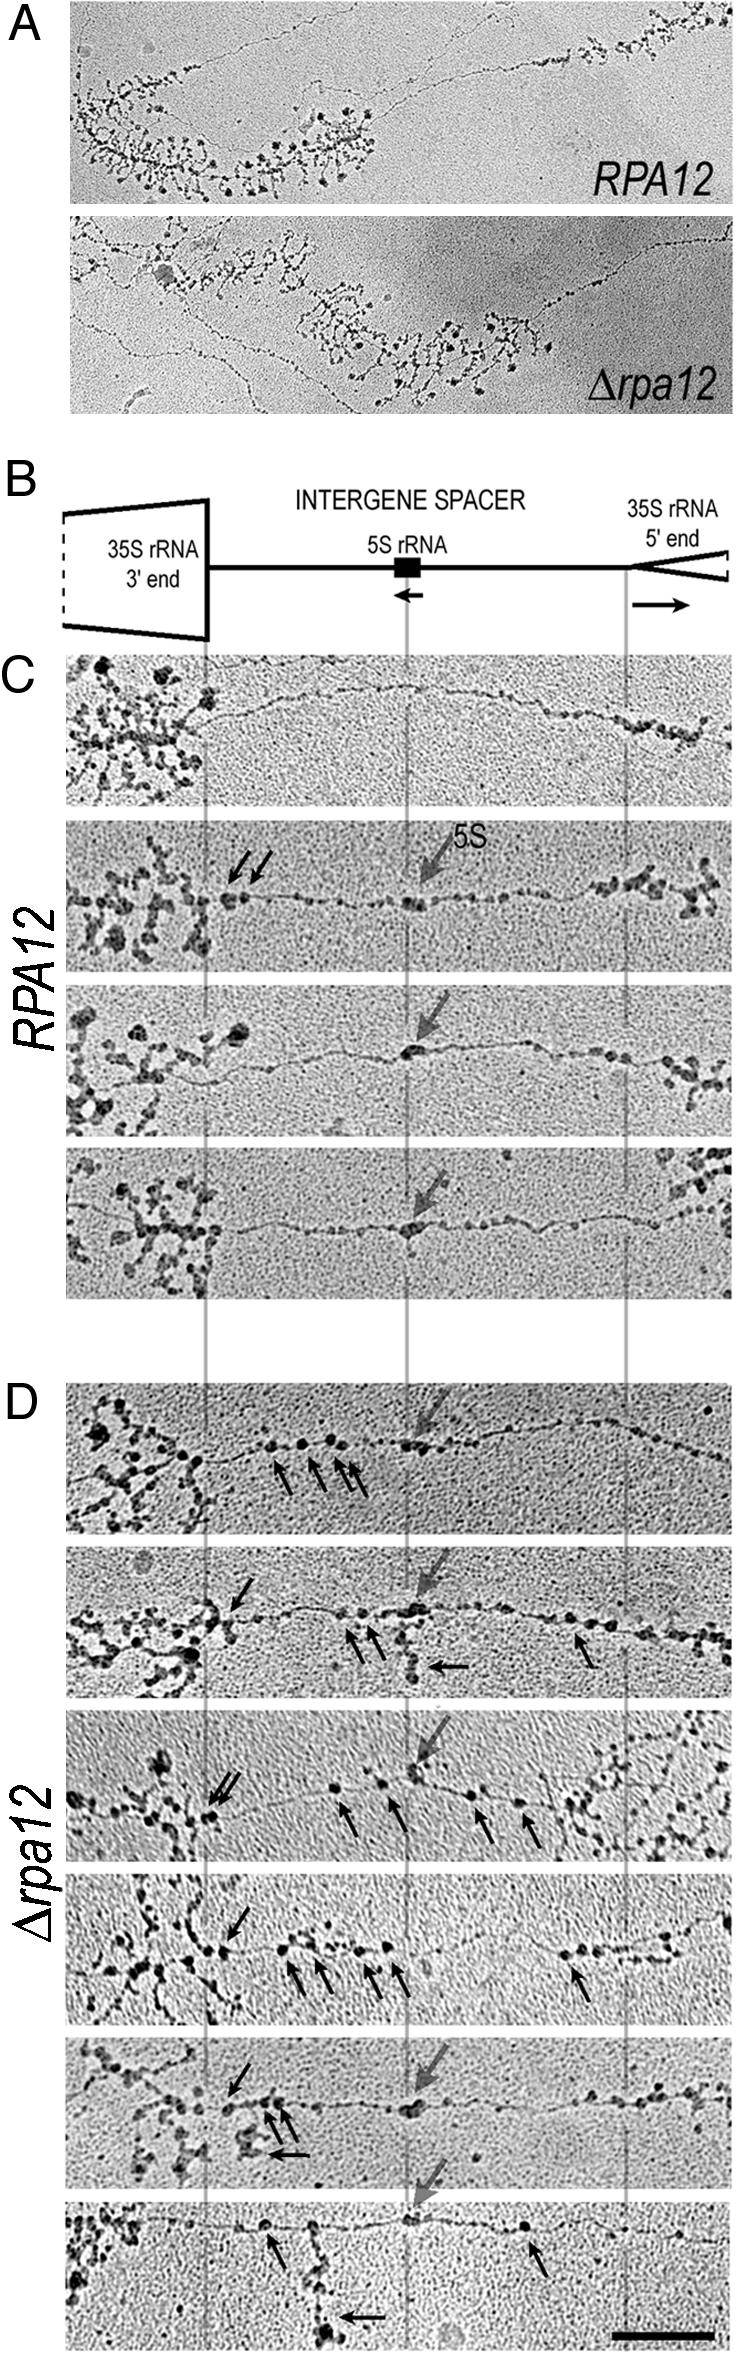
EM visualization reveals polymerases in the intergenic spacers between rRNA genes of Δrpa12 but not in the spacers in the wild-type strain. (A) Representative 35S rRNA gene/spacer units from the control RPA12 and Δrpa12 strains. The intergenic spacers from these examples are shown at a higher magnification in C Top below (for wild type) and D Top below (for Δrpa12). Clusters of rRNA genes are readily identifiable in yeast chromatin spreads by virtue of their length, tandem repetition, and characteristic terminal knobs on the transcripts. (B) Schematic diagram of the yeast intergenic spacer, drawn to scale. (C) Four examples of intergenic spacers from the control RPA12 strain, aligned with the schematic in B. These spacers are typically free of polymerases, with two general exceptions. First, polymerases with no or very short transcripts are occasionally seen very near the 3′ end of the 35S rRNA gene (black downward-pointing arrows), presumably representing Rnt1 cleavage of nascent 35S rRNA. Second, a characteristic peanutshaped structure (larger gray downward arrow) is often seen at the position of the 5S rRNA gene, presumably representing a few Pol III molecules and associated transcription factors. Nucleosomes are also sometimes seen in the spacers, such as C Bottom. Nucleosomes are smaller and less electron-dense than polymerases. (D) Six examples of intergenic spacers from the mutant Δrpa12 strain, aligned with the schematic in B. Seventy percent of the genes in this strain exhibited spacer polymerases in addition to the two expected types, as explained in C (again shown with downward arrows). Most of the spacer polymerases in the mutant strain have either no or very short transcripts (black upward-pointing arrows), although some have a long transcript that originated in the 35S gene (horizontal arrows). (Bar = 0.2 μm.)
RT-PCR Analysis of Pol I Termination. The TRO and EM analyses described above for the Δrpa12 strain demonstrate a clear termination defect. However, the spacer polymerases visible by EM analysis appear to be detached from their nascent transcripts, suggesting that these RNAs may be degraded as they are synthesized. To investigate this phenomenon further, we carried out steady-state RNA analysis of Pol I spacer transcription with the Δrnt1 and particularly Δrpa12 mutant strains. RT-PCR analysis was performed on these different strains, both over the Pol I promoter to look for read-through transcripts and extending beyond the normal Reb1p terminator region to look for transcripts that fail to terminate normally. The positions of the RT (C1–12) and PCR (P1–3) primers used are indicated in Fig. 1 A. No transcripts reading into the Pol I promoter were detected, as judged by the absence of any DNA product with the C12/P2 primer pair as compared to the C12/P3, which detect transcription within the Pol I transcription unit (Fig. 3A). Although strong TRO signals were detected in the Pol I promoter region with Δrpa12 mutant strain and weaker signals for the Δrnt1 mutant strain, apparently these transcripts do not read into the downstream Pol I transcription unit. Similarly, comparing RT-PCR signals extending beyond the Reb1p terminator region, equivalent levels of signal were obtained for both the wild-type (Fig. 3B) and Δrpa12 deletion strain (Fig. 3C). Although these transcripts extend well beyond the failsafe terminator region, the pattern of signal and its disappearance after C6 (located just upstream of the 5S gene) suggest that the Δrpa12 deletion does not alter the pattern of steady-state spacer transcripts. Because some of these signals extend beyond the fail-safe terminator, it is evident that a tiny amount of transcription (detectable only by high PCR amplification) extends further into the spacer sequence up to the 5S gene. As with the promoter analysis, no increase in steady-state spacer transcription is evident for the Δrpa12 strain. Although these results at first appeared inconsistent with the TRO analysis (Fig. 1), they can be reconciled with the EM analysis (Fig. 2), which indicates that the spacer Pol I observed in the Δrpa12 strain is devoid of any attached transcript, presumably because this is highly unstable.
Discussion
Similarities between the mechanisms of transcriptional termination for all three classes of eukaryotic RNA polymerase are striking. Pol I–III each possess a small subunit (Fig. 4A) that displays significant sequence homology, in particular by possessing a characteristic zinc ribbon domain. Furthermore, each is homologous to the Pol II elongation factor Dst1p (TFIIS in mammals), which promotes nascent cleavage of misincorporated or arrested transcripts and so releases arrested elongation complexes (23, 26). Significantly, Rpc11p (C11) is required for Pol III to mediate a very similar intrinsic cleavage activity (10). This may suggest that Pol III, which transcribes very short genes (5S and tRNA), modifies this mechanism of release from elongation arrest as a way to promote full transcriptional termination. Similarly for Pol II transcription, recognition of the poly(A) signal by cleavage/polyadenylation factors is closely associated with the actual termination mechanism (8). Furthermore, cotranscriptional cleavage at the actual site of termination further into the gene 3′ flanking region is also a prerequisite for Pol II termination, at least for the human β-globin gene (32). The small but reproducible effect of Rnt1p inactivation on nascent transcription as judged by TRO analysis (Fig. 1B) indicates that 3′ end cleavage of the pre-RNA may signal both the position and efficiency of Pol I termination. As shown schematically in Fig. 4B, both Pol I and II termination mechanisms start with passage of the elongation complex through sequence that generates an RNA processing site in the nascent transcript (Rnt1p cleavage for Pol I and cleavage/polyadenylation for Pol II). For both polymerases, cotranscriptional cleavage sometimes occurs but is not required for termination (ref. 33 and this study). Beyond this position, both polymerases are shown to pause transcription. For Pol I, we show in these studies a clear accumulation of polymerase upstream of the Reb1p-dependent terminator. A similar pausing has also been observed for Pol II transcription termination in S. pombe (16). In the case of Pol II termination, the role of the Rpb1p CTD in carrying the cleavage/polyadenylation factors is now well established (8). It is appealing to suggest that Pol I, which lacks a CTD, uses the Rpa12p subunit in a related manner to interface between the DNA-bound Reb1p terminator protein and the 3′ cleavage activity associated with Rnt1p. It is clear that much detailed biochemical analysis is required to reveal the exact nature of these molecular interactions. However, the similarity of Pol I and II termination indicates that many other mechanistic aspects will be closely conserved.
Acknowledgments
We are grateful to David Tollervey (University of Edinburgh, Edinburgh, Scotland) for advice and provision of yeast strains. Simon Brackenridge (University of Oxford, Oxford) devised the polymerase cartoon (Fig. 4B). E.M.P. was supported by the Howard Leo Prescott Educational Trust. This work was supported by a program grant (062329) from the Wellcome Trust (to N.J.P.) and by Public Health Service Grant GM63952 (to A.L.B.).
Abbreviations: Pol, RNA polymerase; TRO, transcription run-on; EM, electron microscopy; rDNA, rRNA-encoding DNA; CTD, C-terminal domain.
References
- 1.Reeder, R. H. (1990) Trends Genet. 6, 390-395. [DOI] [PubMed] [Google Scholar]
- 2.Orphanides, G., Lagrange, T. & Reinberg, D. (1996) Genes Dev. 10, 2657-2683. [DOI] [PubMed] [Google Scholar]
- 3.Geiduschek, E. P. & Kassavetis, G. A. (2001) J. Mol. Biol. 310, 1-26. [DOI] [PubMed] [Google Scholar]
- 4.White, R. J. (2001) Gene Transcription: Mechanisms and Control (Blackwell, Oxford).
- 5.McKnight, S. L. (1996) Genes Dev. 10, 367-381. [DOI] [PubMed] [Google Scholar]
- 6.Hampsey, M. & Reinberg, D. (2003) Cell 113, 429-432. [DOI] [PubMed] [Google Scholar]
- 7.Proudfoot, N. J., Furger, A. & Dye, M. J. (2002) Cell 108, 501-512. [DOI] [PubMed] [Google Scholar]
- 8.Proudfoot, N. J. & O'Sullivan, J. (2002) Curr. Biol. 12, R855-R857. [DOI] [PubMed] [Google Scholar]
- 9.Calvo, O. & Manley, J. L. (2003) Genes Dev. 17, 1321-1327. [DOI] [PubMed] [Google Scholar]
- 10.Chedin, S., Riva, M., Schultz, P., Sentenac, A. & Carles, C. (1998) Genes Dev. 12, 3857-3871. [DOI] [PMC free article] [PubMed] [Google Scholar]
- 11.Lang, W., Morrow, B. E., Ju, Q., Warner, J. R. & Reeder, R. H. (1994) Cell 79, 527-534. [DOI] [PubMed] [Google Scholar]
- 12.Lang, W. & Reeder, R. H. (1993) Mol. Cell. Biol. 13, 649-658. [DOI] [PMC free article] [PubMed] [Google Scholar]
- 13.Jansa, P., Mason, S. W., Hoffmann-Rohrer, U. & Grummt, I. (1998) EMBO J. 17, 2855-2864. [DOI] [PMC free article] [PubMed] [Google Scholar]
- 14.Mason, S. W., Wallisch, M. & Grummt, I. (1997) J. Mol. Biol. 268, 229-234. [DOI] [PubMed] [Google Scholar]
- 15.Reeder, R. H., Guevara, P. & Roan, J. G. (1999) Mol. Cell. Biol. 19, 7369-7376. [DOI] [PMC free article] [PubMed] [Google Scholar]
- 16.Birse, C. E., Lee, B. L., Hansen, K. & Proudfoot, N. J. (1997) EMBO J. 16, 3633-3643. [DOI] [PMC free article] [PubMed] [Google Scholar]
- 17.Birse, C. E., Minvielle-Sebastia, L., Lee, B. A., Keller, W. & Proudfoot, N. J. (1998) Science 280, 298-301. [DOI] [PubMed] [Google Scholar]
- 18.van der Sande, C. A. F. M., Kulkens, T., Kramer, A. B., de Wijs, I. J., van Heerikhuizen, H. & Planta, R. J. (1989) Nucleic Acids Res. 17, 9127-9146. [DOI] [PMC free article] [PubMed] [Google Scholar]
- 19.Johnson, S. P. & Warner, J. R. (1991) Mol. Cell. Biochem. 104, 163-168. [DOI] [PubMed] [Google Scholar]
- 20.Venema, J. & Tollervey, D. (1999) Annu. Rev. Genet. 33, 261-311. [DOI] [PubMed] [Google Scholar]
- 21.Kufel, J., Dichtl, B. & Tollervey D. (1999) RNA 5, 909-917. [DOI] [PMC free article] [PubMed] [Google Scholar]
- 22.Chanfreau, G., Buckle, M. & Jacquier, A. (2000) Proc. Natl. Acad. Sci. USA 97, 3142-3147. [DOI] [PMC free article] [PubMed] [Google Scholar]
- 23.Nogi, Y., Yano, R., Dodd, J., Carles, C. & Nomura, M. (1993) Mol. Cell. Biol. 13, 114-122. [DOI] [PMC free article] [PubMed] [Google Scholar]
- 24.Cioci, F., Vu, L., Eliason, K., Oakes, M., Siddiqi, I. N. & Nomura, M. (2003) Mol. Cell 12, 135-145. [DOI] [PubMed] [Google Scholar]
- 25.van Mullem, V., Landrieux, E., Vandenhaute, J. & Thuriaux, P. (2002) Mol. Microbiol. 43, 1105-1113. [DOI] [PubMed] [Google Scholar]
- 26.Labhart, P. (1997) J. Biol. Chem. 272, 9055-9061. [DOI] [PubMed] [Google Scholar]
- 27.Awrey, D. E., Weilbaecher, R. G., Hemming, S. A., Orlicky, S. M., Kane, C. M. & Edwards, A. M. (1997) J. Biol. Chem. 272, 14747-14754. [DOI] [PubMed] [Google Scholar]
- 28.French, S. L., Osheim, Y. N., Cioci, F., Nomura, M. & Beyer, A. L. (2003) Mol. Cell. Biol. 23, 1558-1568. [DOI] [PMC free article] [PubMed] [Google Scholar]
- 29.Dye, M. J. & Proudfoot, N. J. (1999) Mol. Cell 3, 371-378. [DOI] [PubMed] [Google Scholar]
- 30.Nogi, Y., Yano, R. & Nomura, M. (1991) Proc. Natl. Acad. Sci. USA 88, 3962-3966. [DOI] [PMC free article] [PubMed] [Google Scholar]
- 31.Miller, O. L., Jr. (1981) J. Cell Biol. 91, 15s-27s. [DOI] [PMC free article] [PubMed] [Google Scholar]
- 32.Dye, M. J. & Proudfoot, N. J. (2001) Cell. 105, 669-681. [DOI] [PubMed] [Google Scholar]
- 33.Osheim, Y. N., Proudfoot, N. J. & Beyer, A. L. (1999) Mol. Cell 13, 379-387. [DOI] [PubMed] [Google Scholar]