Abstract
Background
Wernicke's encephalopathy-Korsakoff syndrome (WE-KS) is common in alcoholics, caused by thiamine deficiency (TD; vitamin B1) and associated with lesions to the thalamus (THAL). Although TD alone can cause WE, the high incidence in alcoholism suggests that TD and ethanol (EtOH) interact.
Methods
Mice in control, TD, or EtOH groups alone or combined were studied after 5 or 10 days of treatment. THAL and entorhinal cortex (ENT) histochemistry and mRNA were assessed.
Results
Combined EtOH-TD treatment for 5 days (EtOH-TD5) showed activated microglia, proinflammatory gene induction and THAL neurodegeneration that was greater than that found with TD alone (TD5), whereas 10 days resulted in marked THAL degeneration and microglial-neuroimmune activation in both groups. In contrast, 10 days of TD did not cause ENT degeneration. Interestingly, in ENT, TD10 activated microglia and astrocytes more than EtOH-TD10. In THAL, multiple astrocytic markers were lost consistent with glial cell loss. TD blocks glucose metabolism more than acetate. Acetate derived from hepatic EtOH metabolism is transported by monocarboxylic acid transporters (MCT) into both neurons and astrocytes that use acetyl-CoA synthetase (AcCoAS) to generate cellular energy from acetate. MCT and AcCoAS expression in THAL is lower than ENT prompting the hypothesis that focal THAL degeneration is related to insufficient MCT and AcCoAS in THAL. To test this hypothesis, we administered glycerin triacetate (GTA) to increase blood acetate and found it protected the THAL from TD-induced degeneration.
Conclusions
Our findings suggest that EtOH potentiates TD-induced THAL degeneration through neuroimmune gene induction. The findings support the hypothesis that TD deficiency inhibits global glucose metabolism and that a reduced ability to process acetate for cellular energy results in THAL focal degeneration in alcoholics contributing to the high incidence of Wernicke-Korsakoff syndrome in alcoholism.
Keywords: Acetate, Acetyl-CoA Synthetase, Cytokines, Glial Activation, Wernicke's Encephalopathy
Thiamine deficiency (TD; vitamin B1) is associated with 2 nervous system ailments, beriberi and Wernicke's encephalopathy (WE). WE is more common in alcoholics as it occurs in approximately 1.5% of the general population with various studies estimating the incidence in chronic alcoholism ranging from 35% (Cook et al., 1998) to 80% (Morgan, 1999; Thomson et al., 1987). Although parenteral thiamine during the early stages can reverse WE (Caine et al., 1997), many patients with WE will die and survivors commonly develop Korsakoff syndrome (KS), a long-lasting amnestic syndrome often requiring institutionalization (Kopelman et al., 2009). Alcoholics are at special risk for TD due to poor diet associated with their lifestyle and chronic alcoholism compromises dietary thiamine absorption and activation (He et al., 2006; Martin et al., 2003). WE-KS amnesia is associated with unique focal lesions within the thalamus (THAL) and mammillary bodies, components of an emotional circuit of Papez that includes nodes in hippocampus, coursing to the mammillary bodies, the THAL, cingulum, entorhinal cortex (ENT), and returning to the hippocampus (Sullivan and Pfefferbaum, 2009). Interestingly, a large Australian postmortem neuropathological study of TD focal lesions found 1.7% of the general population had focal lesions consistent with TD, alcoholics represented 88% of those with TD-like lesions, but only 20% were diagnosed with WE, which is consistent with unique factors in alcoholism contributing to WE-KS. The reasons for the high frequency of TD neuropathology in alcoholism and the mechanisms of TD-induced brain focal neurodegeneration leading to WE-KS are not fully understood.
Dietary thiamine is converted to the co-enzyme thiamine pyrophosphate, which is essential for energy production via glucose metabolism through complexes involving pyruvate kinase, transketolase, and alpha-ketoglutarate dehydrogenase. Loss of enzyme activity due to TD results in degradation of proteins and TD reduces transketolase enzymatic activity and protein levels in both the liver and the brain (Jung et al., 1991), further confounding the mechanisms of TD-induced focal brain degeneration. Gene expression studies of human alcoholic brain find reduced levels of transketolase gene expression (Liu et al., 2006) and decreased transketolase protein in alcoholic brain (Alexander-Kaufman et al., 2006). Brains of alcoholics with WE-KS have reduced alpha-ketoglutarate dehydrogenase (Hazell and Butterworth, 2009) consistent with alcoholism and TD leading to reductions in brain levels of these enzymes. Multiple animal studies have used a TD model that includes a thiamine-deficient diet combined with pyrithiamine, which blocks thiamine activation. Treatment with this TD model for about 14 days results in focal brain lesions to the THAL and other brain regions modeling human WE-KS neuropathology and further establishing TD as the principle cause of the focal pathology (Hazell and Butterworth, 2009; Hazell et al., 2010). Recent studies found that TD-induced MCP-1, a proinflammatory cytokine, and that MCP-1 inhibition or transgenic knockouts of MCP-1 reduce TD-induced THAL degeneration (Yang et al., 2011). We found that postmortem human alcoholic brain has elevated levels of MCP-1 (He and Crews, 2008) and that chronic ethanol (EtOH) treatment of mice (Qin et al., 2008) and rat brain slices (Zou and Crews, 2010) increases expression of MCP-1. To test the hypothesis that EtOH induction of MCP-1 and other proinflammatory signals would potentiate TD toxicity, we treated mice with EtOH in combination with the TD-WE model and investigated a prepathology time point providing insight into the progression of THAL lesions. Further, we compared THAL with ENT, 2 nodes of the emotional circuit thought to underlie WE-KS that differ in response to TD.
TD disrupts cellular energy formation and glucose metabolism while alcohol provides a source of energy independent of glucose, for example, acetate. Alcohol (EtOH) is metabolized by the liver to acetate, which provides the liver with energy. Acetate is released into the blood reaching concentrations in the low millimolar range (Sarkola et al., 2002) that can provide energy to tissues. However, cells require monocarboxylic acid transporters (MCT) to transport acetate into the cell where acetate can be oxidized for energy (Halestrap and Wilson, 2012). Alcoholics and heavy drinkers have much higher plasma acetate levels than controls (Korri et al., 1985), and heavy drinkers appear to have an increased capacity for brain acetate metabolism (Jiang et al., 2013). Recent studies of brain acetate transport and metabolism find acetate distribute in brain volume consistent with distribution to glia and extracellular space (Patel et al., 2010). Further, imaging of brain glucose utilization finds that alcoholics have lower brain glucose metabolism than can be explained by decreased neuronal activity, suggesting alcoholic brain metabolizes more acetate and less glucose than controls (Volkow et al., 2006). EtOH treatment of rats decreases brain glucose metabolism (Learn et al., 2003) and increases cortical acetyl-CoA synthetase (AcCoAS) activity (Kiselevski et al., 2003), the key enzyme initiating acetate oxidation, supporting the hypothesis that alcoholism leads to an increase in brain acetate metabolism reducing brain glucose requirements. Hepatic oxidation of EtOH to acetate does not require thiamine-dependent enzymes. Thus, acetate formed from alcohol can be transported into brain and astrocytes by MCT, providing an important brain energy source for alcoholics and heavy drinkers. We report here that MCT required for acetate metabolism in brain are expressed at much lower levels in THAL, which degenerates during TD, than in ENT, which does not show marked degeneration with TD. Further, we find that acetate supplementation can blunt TD-induced THAL degeneration.
Materials and Methods
Animals
Eight-week-old male (20–22 g) C57BL/6 mice were purchased from Jackson Laboratories (Bar Harbor, ME). The reagents and antibodies used in this study are listed in Table 1. All protocols in this study were approved by the Institutional Animal Care and Use Committee and were in accordance with the National Institute of Health regulations for the care and use of animals in research.
Table 1.
Summary of Antibodies Used in This Study
| Antibody | Manufacturer | Host | Species detected | Dilution | Application |
|---|---|---|---|---|---|
| NeuN | Chemicon International | Mouse | Mouse | 1:500 | IHC |
| Iba1 | Wako Pure Chemical Industries, Ltd (1–2Doshomachi 3-Chome Chuo-ku Osaka 540–8605, Japan) | Rabbit | Mouse | 1:1,000 | IHC |
| Glial fibrillary acidic protein | DakoCytomation (Glostrup, Denmark) | Rabbit | Mouse | 1:500 | IHC |
| Gl Syn (GS, FL-373) | Santa Cruz Biotechnology (Santa Cruz, CA) | Rabbit | Mouse | 1:200 | IHC |
| EAAT1 (N-19) | Santa Cruz Biotechnology | Goat | Mouse | 1:200 | IHC |
| ACSS1 (V-16) | Santa Cruz Biotechnology | Rabbit | Mouse | 1:50 | IHC |
| MCT1 (T-19) | Santa Cruz Biotechnology | Goat | Mouse | 1:100 | IHC, WB |
| MCT1 (T-19) P | Santa Cruz Biotechnology | Blocking peptide | Mouse | 0.2 μg/ ml | WB |
| MCT2 (M-17) | Santa Cruz Biotechnology | Goat | Mouse | 1:100 | IHC, WB |
| MCT2 (M-17) P | Santa Cruz Biotechnology | Blocking peptide | Mouse | 0.2 μg/ ml | WB |
| β-Actin | Cell Signaling Technology (Danvers, MA) | Rabbit | Mouse | 1:500 | WB |
IHC, immunohistochemistry; WB, Western blotting; EAAT1, excitatory amino acid transporter; GS, glutamine synthetase; MCT, monocarboxylic acid transporters.
Reagents
Fluoro-Jade B was from Chemicon International (Temecula, CA). Pierce Bicinchoninic Acid (BCA) protein assay kit was from Thermo Scientific (Rockford, IL). The SYBR green PCR kit was purchased from Applied Biosystems (Foster City, CA). Mouse TNFα, IL-1β, IL-6, and mouse JE/MCP-1 commercial enzyme-linked immunosorbent assay (ELISA) kits were purchased from R&D Systems (Minneapolis, MN). All other reagents were purchased from Sigma-Aldrich Corporation (St. Louis, MO). Antibodies used in this study are shown in Table 1.
Animal Treatments
Male C57BL/6 mice were allowed to acclimate for 5 days and then randomly divided into normal chow control (control), EtOH + normal chow (5 g/kg, i.g., EtOH, daily for 10 days), thiamine-deficient diet (TD control), thiamine-deficient diet + pyrithiamine (0.5 mg/kg, i.p., TD), and EtOH + thiamine-deficient diet + pyrithiamine (EtOH-TD). Mice in TD and EtOH-TD groups received a thiamine-deficient diet (MP Biomedicals, Solon, OH) ad libitum, and daily intraperitoneal injection of the thiamine pyrophosphokinase inhibitor, pyrithiamine hydrobromide, at a dose of 0.5 mg/kg body weight in normal saline for 5 days (days 6 to 10, TD5) or 10 days (TD10). For EtOH and EtOH-TD groups, mice were treated intragastrically with EtOH (5 g/kg, i.g., 25% EtOH w/v) daily 30 minutes before saline or pyrithiamine hydrobromide treatment. Average level of blood alcohol at 1 hour after the first and last EtOH treatments was 290 ± 11 mg/dl (w/v, n = 10) and 296 ± 15 mg/dl (w/v, n = 10), respectively. The blood EtOH level is high and considered to model binge drinking. Mice were sacrificed 24 hours following the last dose of EtOH, and their brains and sera were used for either morphological or biochemical (mRNA and protein) analyses.
In the study of acetate (glycerin triacetate [GTA]) supplementation, 28 mice were randomly divided into 4 groups (n = 7 per group): control group, GTA group, TD10 group, and GTA-TD10 group. Controls and TD groups were treated as described above. On day 1, GTA animals received a single dose of 4 g/kg GTA i.g., and 3 animals died prompting a change to 2 daily doses of 2 g/kg GTA i.g. to maintain the 4 g/kg/d dose for the remaining 9 days. Mice in GTA-TD group received 2 doses of GTA (2 g/kg/dose, i.e., 4 g/kg/d, i.g.) at 8:00 am and 4:00 pm and received pyrithiamine hydrobromide (0.5 mg/kg, i.p.) 30 minutes after the second dose of GTA for 10 days and sacrificed 24 hours after the last dose of TD treatment. Body weights are shown in Table 2.
Table 2.
Body Weight
| Before treatment | After treatment | |
|---|---|---|
| (A) EtOH-TD experiment | ||
| Control | 23.61 ± 0.41 | 23.99 ± 0.37 |
| TD5 | 23.08 ± 0.47 | 23.10 ± 0.47 |
| EtOH | 23.99 ± 0.38 | 21.38 ± 0.66** |
| EtOH-TD5 | 23.64 ± 0.38 | 20.96 ± 0.41** |
| TD10 | 23.43 ± 0.31 | 21.14 ± 0.56** |
| EtOH-TD10 | 23.60 ± 0.32 | 19.80 ± 0.27** |
| (B) GTA-TD10 experiment | ||
| Control | 23.74 ± 0.39 | 23.24 ± 0.39 |
| GTA | 23.40 ± 0.57 | 22.91 ± 0.47 |
| TD10 | 23.37 ± 0.39 | 19.95 ± 0.41** |
| GTA-TD10 | 23.61 ± 0.38 | 21.11 ± 0.50** |
EtOH, ethanol; GTA, glycerin triacetate; TD, thiamine deficiency.
p < 0.01 compared with vehicle control group.
Values are the mean ± SEM of grams of body weight.
Real-Time PCR Analysis
Total RNA was extracted from the mouse whole brain samples 24 hours after the last dose of EtOH treatment and used for reverse transcription PCR analysis as described previously (Qin and Crews, 2012). The primer sequences used in this study are shown in Table 3.
Table 3.
Real-Time PCR Primers
| Mouse primer pairs | |
|---|---|
| TNFα | 5′-GAC CCT CAC ACT CAG ATC ATC TTC T-3′ |
| 5′-CCT CCA CTT GGT GGT TTG CT-3′ | |
| IL-1β | 5′-CTG GTG TGT GAC GTT CCC ATT A-3′ |
| 5′-CCG ACA GCA CGA GGC TTT-3′ | |
| IL-6 | 5′-GGC CTT CCC TAC TTC ACA AG-3′ |
| 5′-ATT TCC ACG ATT TCC CAG AG-3′ | |
| MCP-1 | 5′-ACT GAA GCC AGC TCT CTC TTC CTC-3′ |
| 5′-TTC CTT CTT GGG GTC AGC ACA GAC-3′ | |
| β-Actin | 5′-GTA TGA CTC CAC TCA CGG CAA A-3′ |
| 5′-GGT CTC GCT CCT GGA AGA TG-3′ |
Immunohistochemistry
Brains were fixed in 4% paraformaldehyde and processed for immunostaining as described previously using the antibodies listed in Table 1. Images were captured on an Olympus BX51 microscope (Olympus Corporation of the Americas, Center Valley, PA) and Sony DXC-390 video camera (Sony Electronics Inc., Broadcast and Professional Company, Park Ridge, NJ). For NeuN+IR cell counting, a stereological method was used to quantify cells within the THAL and ENT following NeuN immunostaining of brain sections using the Computer Assisted Stereological Toolbox stereological system as described previously (Crews et al., 2013). Cell counts for the GTA experiment used a modified stereology profile count as described previously (Crews et al., 2004). Quantification of activated Iba1 + IR and GFAP + IR cells was performed and expressed as percent activated [(activated cells/mm2)/(total + IR cells/mm2) × 100%] as described previously (Qin and Crews, 2012).
Western Blots, Fluoro-Jade B Staining, and ELISA
For Western blots, brains were cut into 300 μM of slices on a vibrating microtome, THAL and ENT were dissected and homogenized in lysis buffer (RIPA buffer; Sigma) containing 0.1 ml of protease inhibitor cocktail (Sigma) per 10 ml of lysis buffer, centrifuged and prepared for Western blotting as described previously (Crews et al., 2013). To verify MCT1 and MCT2+ immunoreactive (+IR) bands, MCT1 and MCT2 antibodies were pre-absorbed with the corresponding MCT1 and MCT2 peptides (0.2 μg/ml). Fluoro-Jade B used mouse brain sections in distilled water mounted on superfrost plus microscope slides processed as described previously (Qin and Crews, 2012). ELISA for TNFα, IL-1β, IL-6, and MCP-1 used frozen brains and mouse JE/MCP-1 commercial ELISA kits from R&D Systems, as described previously (Crews et al., 2013).
Statistical Analysis
Statistical analysis was performed using StatView (SAS Institute, Cary, NC). For all, analysis of variance (ANOVA) was conducted, followed by Bonferroni correction for multiple comparisons. For each analysis, the Bonferroni-corrected p-value was based on the following formula: α = 0.05/# of comparisons. For instance, for the 4 groups of GTA experiment, the corrected p-value was 0.01 (α = 0.05/5). A value of p < 0.01 was considered statistically significant. All values are reported as mean ± SEM.
Results
To determine whether EtOH contributed to TD-induced neuroimmune activation and neurotoxicity, we assessed microglial activation (Fig. 1), mRNA (Fig. 2), and protein (Fig. 3) levels of proinflammatory cytokines TNFα, IL-1β, IL-6, and MCP-1 and cell death (Fig. 4). Our initial studies involved multiple groups of animals, including normal chow control (control), EtOH + normal chow (5 g/kg, i.g., EtOH, daily for 10 days), thiamine-deficient diet alone, and with EtOH, thiamine-deficient diet + pyrithiamine (0.5 mg/kg, i.p., TD), and EtOH + thiamine-deficient diet + pyrithiamine (EtOH-TD). We found no effect of thiamine-deficient diets after 5 or 10 days of treatment (not shown) and focused our studies on the widely used WS model using thiamine-deficient diet + pyrithiamine (TD) (Sullivan and Pfefferbaum, 2009). In Figs 4 and 5, we show images of groups showing changes compared with control representing other groups showing no change. Microglial activation was assessed morphologically. We found that the THAL of control (Fig. 1A,B) showed ramified “resting” healthy brain microglial morphology. EtOH alone and TD5 alone treatment showed enlarged microglia and TD10 alone treatment showed many bushy “activated” morphology microglia (Fig. 1). EtOH-TD5 (5 days combination treatment) and EtOH-TD10 groups showed many phagocytic macrophage-like microglia, a maximal stage of activation. Proinflammatory cytokine levels showed graded increases consistent with microglial activation findings. EtOH alone treatment increased TNFα, MCP-1, and IL-6 mRNA whereas TD5 alone only increased IL-6 mRNA (Fig. 2). Combined EtOH-TD5 treatment increased IL-1β as well as TNFα, MCP-1, and IL-6 mRNA with most being greater than EtOH or TD alone treatment (Fig. 2). All treatments for 10 days (e.g., EtOH, TD10, and EtOH-TD10) increased proinflammatory cytokine mRNA (Fig. 2) and protein (Fig. 3) expression. Thus, EtOH, TD, and EtOH-TD caused microglial activation and induction of proinflammatory cytokines that progressively increase during TD treatment from 5 to 10 days. Microglial activation and proinflammatory cytokine induction is greater in the combined EtOH-TD treatment at 5 days consistent with EtOH accelerating and/or potentiating TD-induced neuroimmune activation.
Fig. 1.
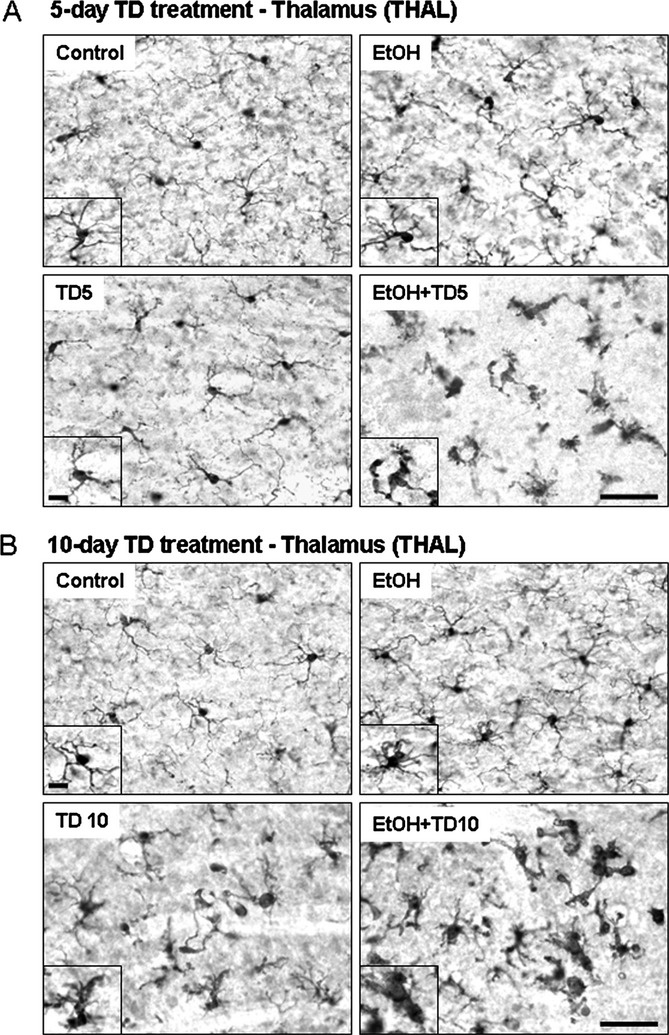
Chronic ethanol (EtOH) increases thiamine deficiency (TD)-induced microglial activation. C57BL/6 mice were treated with vehicle, EtOH, TD (thiamine deficiency) for 5 days (TD5), TD for 10 days (TD10), EtOH+TD5, and EtOH+TD10 as described in Materials and Methods. Animals were sacrificed 24 hours following the last dose of EtOH treatment (5 g/kg, i.g. daily for 10 days). Brain sections were immunostained with Iba1 microglial antibody. (A) Microglia in control and TD5 groups were showed resting morphology. Some of microglia in EtOH alone group were slightly activated. All the microglia in combined EtOH and TD5 treatment were significantly activated. (B) Microglia in control group were in resting state. Microglia in TD10 treatment showed many busy “activated” morphology. EtOH+TD10 group, microglia were dramatically activated, a maximal stage of activation. The images presented are representative of 3 independent experiments. Scale bar = 50 μM. Inset scale bar = 10 μM.
Fig. 2.
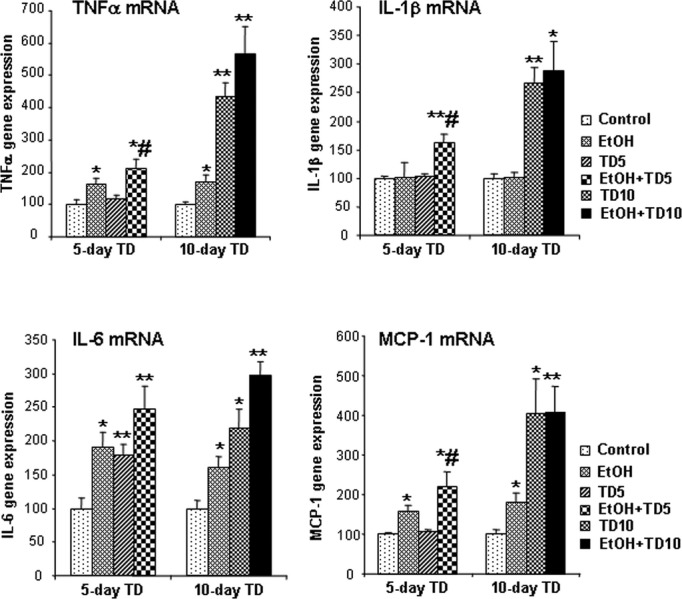
Chronic ethanol (EtOH) increases thiamine deficiency (TD)-induced gene expression of TNFα, IL-1β, IL-6, and MCP-1. C57BL/6 mice were treated with vehicle, EtOH, TD5, TD10, EtOH+TD5, and EtOH+TD10 as described in Materials and Methods. Animals were sacrificed 24 hours following the last dose of EtOH treatment (5 g/kg, i.g. daily for 10 days). Brain TNFα, IL-1β, IL-6, and MCP-1 mRNA were measured by real-time PCR. EtOH alone significantly increased gene expression of TNFα, IL-6, and MCP-1. TD5 did not show any increases in TNFα, IL-1β, and MCP-1 mRNA, but did show significant increase in IL-6 mRNA. Ten days of TD treatment significantly enhanced gene expression of TNFα, IL-1β, IL-6, and MCP-1. In both EtOH+TD5 and EtOH+TD10 groups, TNFα, IL-1β, IL-6, and MCP-1 mRNA was significantly increased, compared with vehicle control group. *p < 0.05, **p < 0.01, compared with the vehicle controls. #p < 0.05, compared with 5 days of TD (TD5) treatment.
Fig. 3.
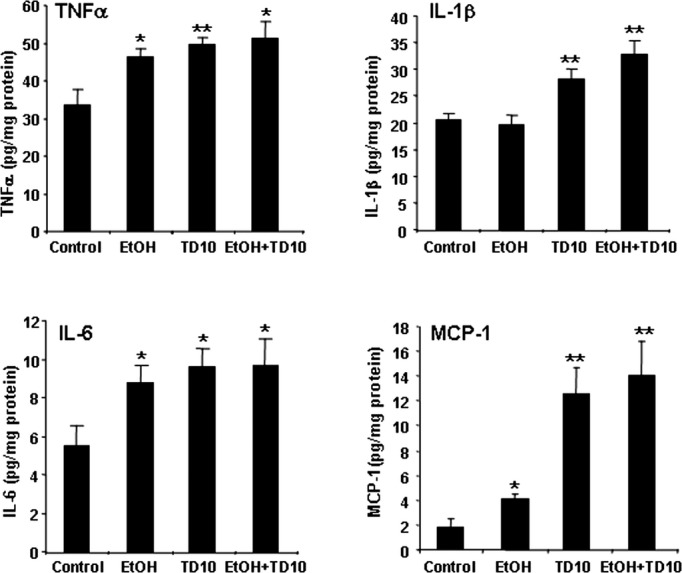
TD10 and EtOH-TD10 increase production of TNFα, IL-1β, IL-6, and MCP-1 protein. C57BL/6 mice were treated with vehicle, EtOH, TD10, and EtOH+TD10 as described in Materials and Methods. Animals were sacrificed 24 hours following the last dose of EtOH treatment (5 g/kg, i.g. daily for 10 days). Brain TNFα, IL-1β, IL-6, and MCP-1 protein was measured by enzyme-linked immunosorbent assay. EtOH increased TNFα, IL-6, and MCP-1 production. TD10 and EtOH+TD10 significantly increase production of TNFα, IL-1β, IL-6, and MCP-1 protein.*p < 0.05, **p < 0.01, compared with the vehicle control group. TD, thiamine deficiency.
Fig. 4.
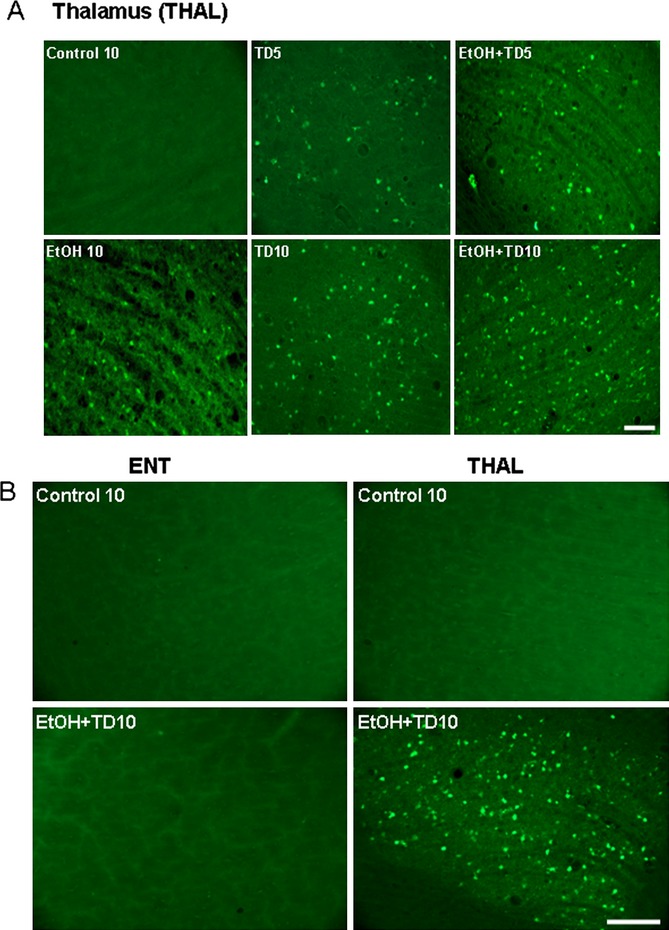
Chronic ethanol (EtOH) increases thiamine deficiency (TD)-induced Fluoro-Jade B positive staining in the thalamus (THAL) of C57BL/6 mice. Brain sections were stained with Fluoro-Jade B as described in Materials and Methods. (A) Representative images for Fluoro-Jade B labeling are from THAL of C57BL/6 mice treated with Control (vehicle, 10 days; Control 10), EtOH 10, TD5, EtOH+TD5, TD10, and EtOH+TD10. Control 10 and groups showing Fluoro-Jade B positive staining is shown. Groups with no staining are similar to control 10. EtOH potentiates TD5- and TD10-induced Fluoro-Jade B positive staining, suggesting cell death. (B) Images are from vehicle and EtOH+TD10-treated groups. EtOH+TD10 induces Fluoro-Jade B positive cell death in THAL, but not in entorhinal cortex (ENT). No Fluoro-Jade B positive staining is found in ENT for all groups as shown for Control 10 and EtOH+TD10. THAL control and EtOH+TD10 groups shown are the same groups as shown in A. Scale bar = 50 μm.
Fig. 5.
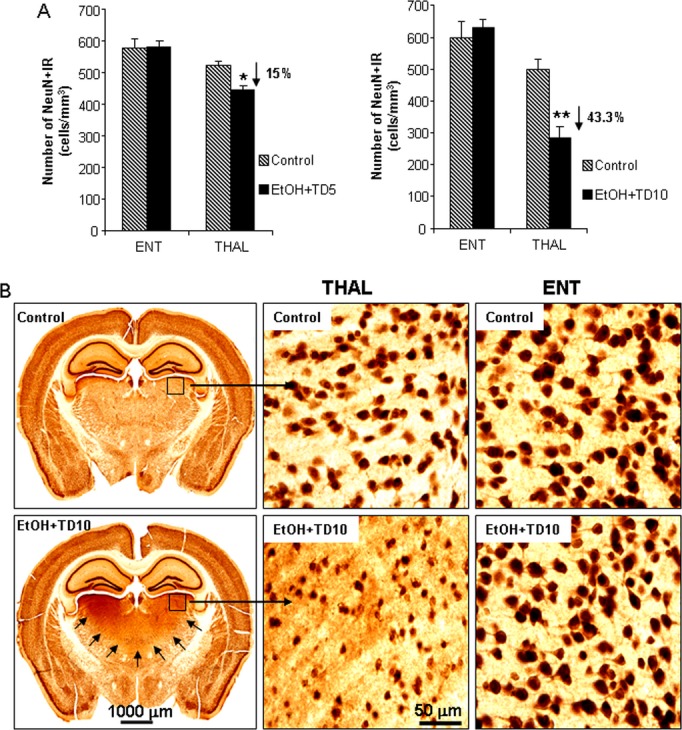
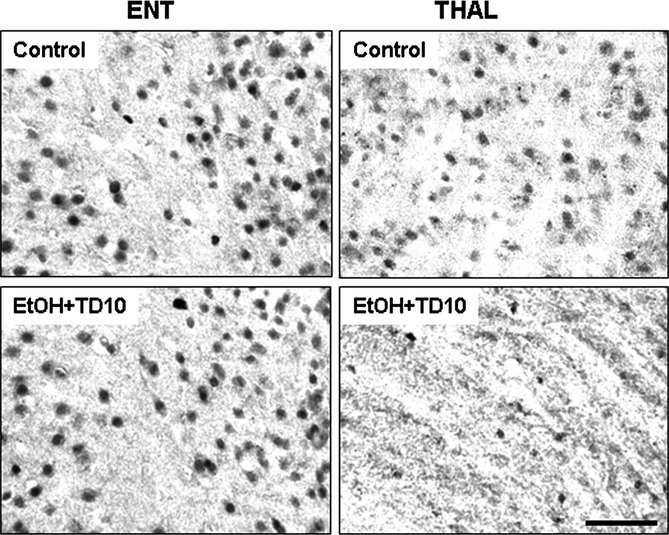
Ethanol (EtOH)-thiamine deficiency (TD) induces neuronal death in thalamus (THAL), but not in entorhinal cortex (ENT). C57BL/6 mice were treated with vehicle, EtOH+TD5 and EtOH+TD10 as described in Materials and Methods. Animals were sacrificed 24 hours following the last dose of EtOH treatment (5 g/kg, i.g. daily for 10 days). Brain sections were immunostained with NeuN neuronal antibody. (A) EtOH+TD5 and EtOH+TD10 induced 15 and 43% of loss of NeuN+IR cells in THAL, respectively, compared with vehicle controls, but both treatments did not show any difference in ENT. (B) Representative images for NeuN+IR cells from ENT and THAL of C57BL/6 mice treated with vehicle and EtOH+TD10. Black arrows in EtOH+TD10 (bottom left) outline THAL area showing neurodegeneration in the THAL. *p < 0.05, **p < 0.01, compared with the corresponding vehicle control mice. It is difficult to visualize lost nuclei; however, we show low magnification images of controls and EtOH-TD to illustrate the extent of the thalamic damage and higher magnification to allow the reader to see the dramatic loss of neuronal nuclei from the TD THAL. No groups show damage in ENT, so the 2 images shown are representative of all groups.
To investigate cell death, we used Fluoro-Jade B (FJ+), a stain used to identify degenerating and dying cells. Further, to better understand the focal degeneration of THAL by TD, we followed THAL at 5 and 10 days of TD treatment (Fig. 4A). As expected, controls showed almost no FJ+ cells. EtOH alone show few FJ+ cells. TD10 shows a number of FJ+ cells, more than TD5 (Fig. 4A). Combined EtOH-TD treatment showed many FJ+ cells in THAL after 5 days of TD that increases after 10 days of TD treatment. These findings support our model of WE-KS as causing TD-induced focal THAL degeneration that is associated with microglial activation and that EtOH increases TD-induced THAL degeneration.
To further investigate the focal nature of TD-induced THAL degeneration, we compared responses in THAL to ENT. Although large numbers of FJ+ cells were found in the THAL of EtOH-TD10-treated animals, there were few, if any, FJ+ cells in the ENT of EtOH-TD10-treated animals (Fig. 4B). A comparison of sections stained for NeuN, a nuclear neuronal marker protein, found that ENT neurons were not altered by EtOH-TD10 treatment, whereas THAL NeuN+IR neurons were decreased by 15% by EtOH-TD5 and reduced 43% in THAL of EtOH-TD10 groups, respectively (Fig. 5). Although EtOH-TD10 treatment increased THAL microglial activation more than TD10 alone (Figs 1 and 6), in ENT TD10 alone caused more microglial activation than EtOH-TD10, although ENT shows much lower overall microglial activation. ENT microglial morphological activation using Iba1 + IR cells/mm2 (Fig. 6) finds 61 ± 2% activated in TD, 16 ± 1% activated in EtOH+TD (p < 0.01 vs. TD alone; controls 4 ± 0.1; p < 0.01 vs. TD, and EtOH+TD) consistent with EtOH reducing TD-induced microglial activation in ENT, but increasing it in THAL. Regardless, THAL microglial morphology, Fluoro-Jade B and NeuN+IR findings support a proinflammatory mechanism involved in focal THAL degeneration that is not found in the ENT.
Fig. 6.
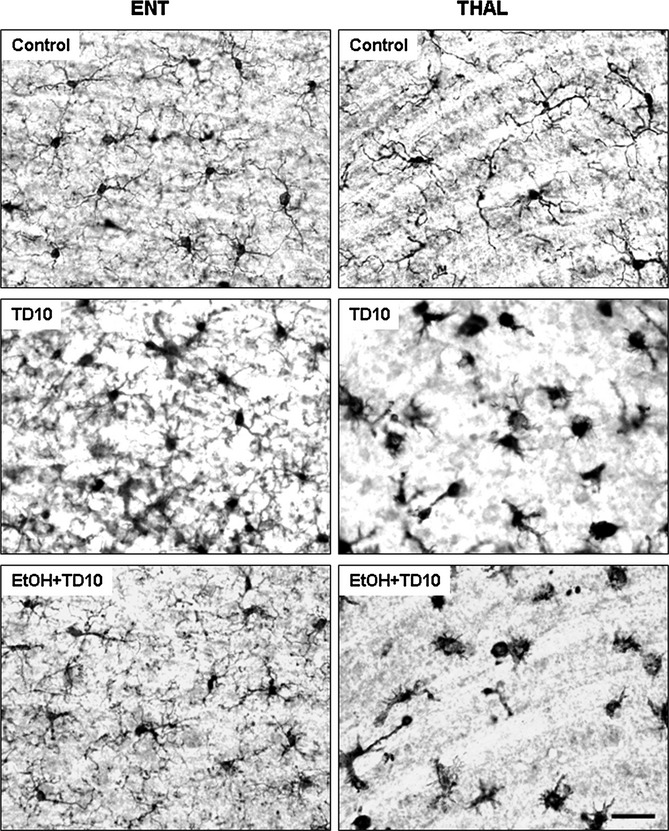
Ethanol (EtOH)-thiamine deficiency (TD) induces microglial activation in thalamus (THAL), but not in entorhinal cortex (ENT). C57BL/6 mice were treated with vehicle and EtOH+TD10 as described in Materials and Methods. Animals were sacrificed 24 hours following the last dose of EtOH treatment (5 g/kg, i.g. daily for 10 days). Brain sections were immunostained with Iba1 microglial antibody. Microglia (Iba1 + IR) were in resting morphology in ENT of mice treated with both vehicle and EtOH+TD10. However, EtOH+TD10-treated THAL had dramatic microglial activation showed by enlarged cell body and intensified Iba1 staining, compared with vehicle controls. Microglia in TD alone treatment showed activated morphology in ENT, compared with EtOH+TD10-treated ENT. Scale bar = 50 μm.
To investigate the response of astrocytes to TD, we compared THAL and ENT using astrocyte markers glial fibrillary acidic protein (GFAP) (Fig. 7), glutamine synthetase (GS) (Fig. 8), and the excitatory amino acid transporter (EAAT1) (Fig. 9). In general, ENT astrocyte marker protein expression, for example, GFAP+IR, GS+IR, and EAAT1 + IR appears more robust than that found in THAL. EtOH-TD10 induced a loss of THAL astrocytes markers, consistent with TD-induced focal THAL degeneration involving toxicity to both neurons and astrocytes. Interestingly, astrocyte GFAP shows darker staining in TD10, in both THAL and ENT, but not in EtOH-TD10. In THAL, EtOH-TD10 has a few dark stained cells but a general loss, whereas in ENT, EtOH-TD10 shows GAFP + IR cell morphology more like controls than TD10 (Fig. 7). Quantification of GFAP + IR cells/mm2 morphological activation finds 59 ± 6% activated in TD, 17 ± 2% activated in EtOH + TD (p < 0.01 vs. TD alone; controls 2 ± 0.4; p < 0.01 vs. TD and EtOH + TD) consistent with EtOH reducing the TD astrocyte insult in ENT that contrasts with EtOH increasing microglial activation in THAL.
Fig. 7.
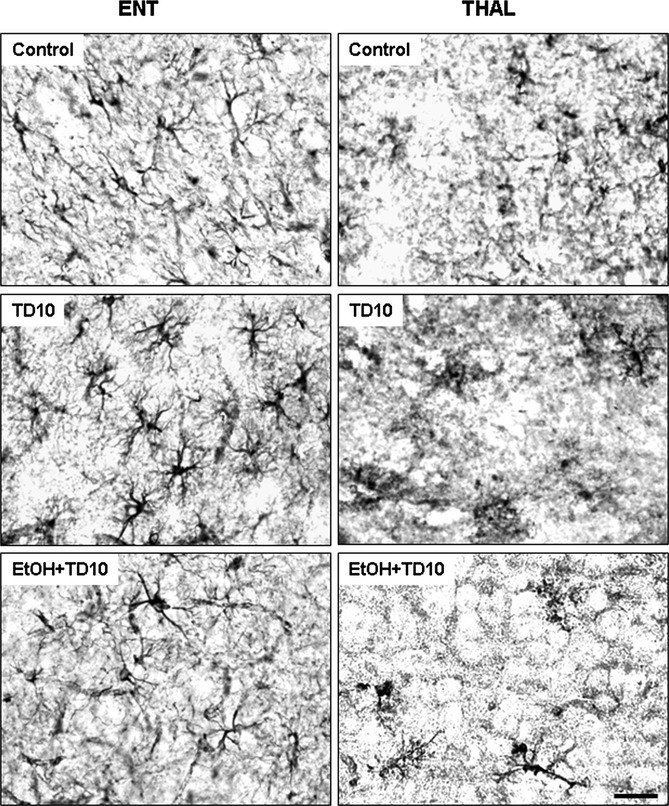
EtOH-thiamine deficiency (TD) induces astroglial activation in thalamus (THAL), but not in entorhinal cortex (ENT). C57BL/6 mice were treated with vehicle and EtOH+TD10 as described in Materials and Methods. Animals were sacrificed 24 hours following the last dose of EtOH treatment (5 g/kg, i.g. daily for 10 days). Brain sections were immunostained with glial fibrillary acidic protein (GFAP) astrocyte antibody. Astroglia (GFAP+IR) were in resting morphology in ENT of mice treated with both vehicle and EtOH+TD10. However, EtOH+TD10-treated THAL showed significant astroglial activation showed by enlarged GFAP+IR cells and intensified GFAP staining, compared with vehicle controls. Astroglia in TD alone treatment showed activated morphology in ENT, compared with EtOH+TD10-treated ENT. Scale bar = 50 μm.
Fig. 8.
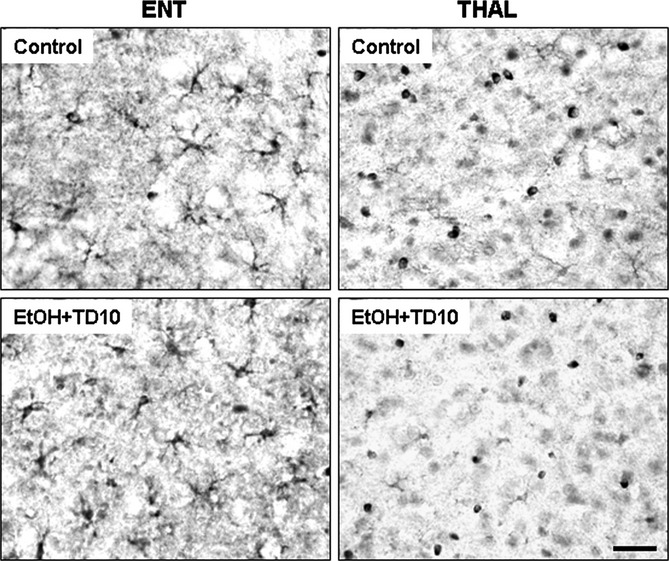
Ethanol (EtOH)-thiamine deficiency (TD) reduces glutamine synthetase (GS) immunoreactivity in thalamus (THAL), but not in entorhinal cortex (ENT). C57BL/6 mice were treated with vehicle and EtOH+TD10 as described in Materials and Methods. Animals were sacrificed 24 hours following the last dose of EtOH treatment (5 g/kg, i.g. daily for 10 days). Brain sections were immunostained with GS astrocyte antibody. EtOH+TD10 did not alter GS+IR in ENT; however, GS+IR was significantly reduced in THAL, compared with vehicle controls. Scale bar = 50 μm.
Fig. 9.
Ethanlol (EtOH)-thiamine deficiency (TD) reduces excitatory amino acid transporter (EAAT1) immunoreactivity in thalamus (THAL), but not in entorhinal cortex (ENT). C57BL/6 mice were treated with vehicle and EtOH+TD10 as described in Materials and Methods. Animals were sacrificed 24 hours following the last dose of EtOH treatment (5 g/kg, i.g. daily for 10 days). Brain sections were immunostained with astrocytic glutamate transporter EAAT1 antibody. EAAT1 immunoreactivity did not show any change in ENT between vehicle and EtOH+TD10 groups. However, EtOH+TD10 treatment significantly decreased EAAT1 + IR cells in THAL, compared with vehicle controls. Scale bar = 50 μm.
MCT transport acetate, lactate, and other monocarboxylic acids across the blood–brain barrier and into cells (Pellerin et al., 1998). There are multiple forms of MCT, for example, MCT1 and MCT2. MCT in THAL and ENT were compared in control animals to determine whether differences in the neurotoxic response to TD were related to differences in basal expression of transporters and enzymes related to using acetate for energy. Brain region dissection followed by Western blot indicated MCT1 and MCT2 proteins were expressed at about 3-fold higher levels in ENT than THAL under control conditions as compared to β-actin, a global cell protein (Fig. 10A). MCT1 + IR and MCT2 + IR were greater in ENT than THAL (Fig. 10B,C). EtOH treatment did not markedly alter MCT1 + IR and MCT2 + IR in ENT, whereas in THAL MCT1 + IR and MCT2 + IR are reduced likely due to cell loss. Further, we assessed AcCoAS, an enzyme that forms acetyl-CoA from acetate, which is critical for cellular energy from acetate. AcCoAS is not thiamine-dependent and is activated by acetate (Hallows et al., 2006). In ENT microglial (Fig. 6) and astrocyte (Fig. 7) activation morphology are greater in TD10 alone compared with EtOH-TD10. This is consistent with EtOH reducing the TD insult in ENT, but not THAL, due to ENT having greater amounts of MCT and AcCoAS needed for cellular energy from acetate (see Figs 10 and 1). The findings that ENT-TD10, that is, TD alone, shows greater microglial and astrocyte activation morphology than ENT-EtOH-TD10, EtOH combined with TD, treated animals are consistent with EtOH, perhaps acetate derived from EtOH metabolism, protecting against TD-induced ENT damage.
Fig. 10.
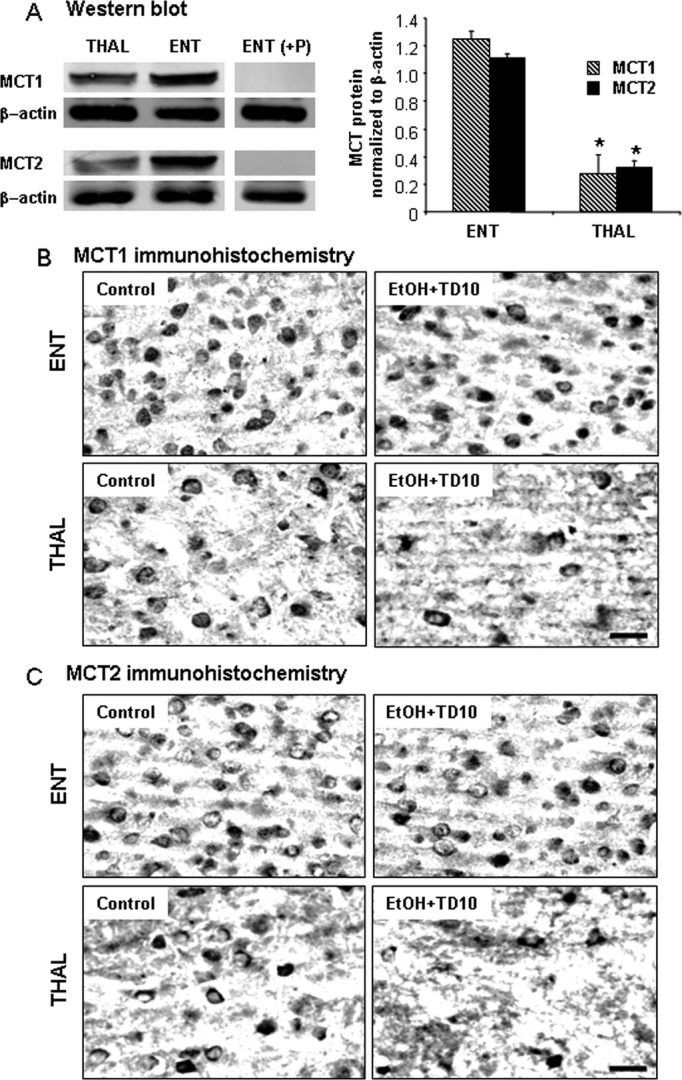
Monocarboxylic acid transporters (MCT1) and MCT2 expressions in Western blot and immunohistochemistry. (A) Thalamus (THAL) and entorhinal cortex (ENT) regions were dissected, and Western blot was performed as described in Methods. ENT shows more MCT1 and MCT2 protein expressions than THAL in untreated C57BL/6 mice. (B) C57BL/6 mice were treated with vehicle and EtOH+TD10 as described in Materials and Methods. Animals were sacrificed 24 hours following the last dose of EtOH treatment (5 g/kg, i.g. daily for 10 days). Brain sections were immunostained with MCT1 and MCT2 antibodies. EtOH+TD10-treated THAL showed decreased MCT1 + IR (B) and MCT2 + IR (C) cells, compared with the corresponding ENT. *P < 0.05, compared with ENT region. Scale bar = 50 μm.
Fig. 11.
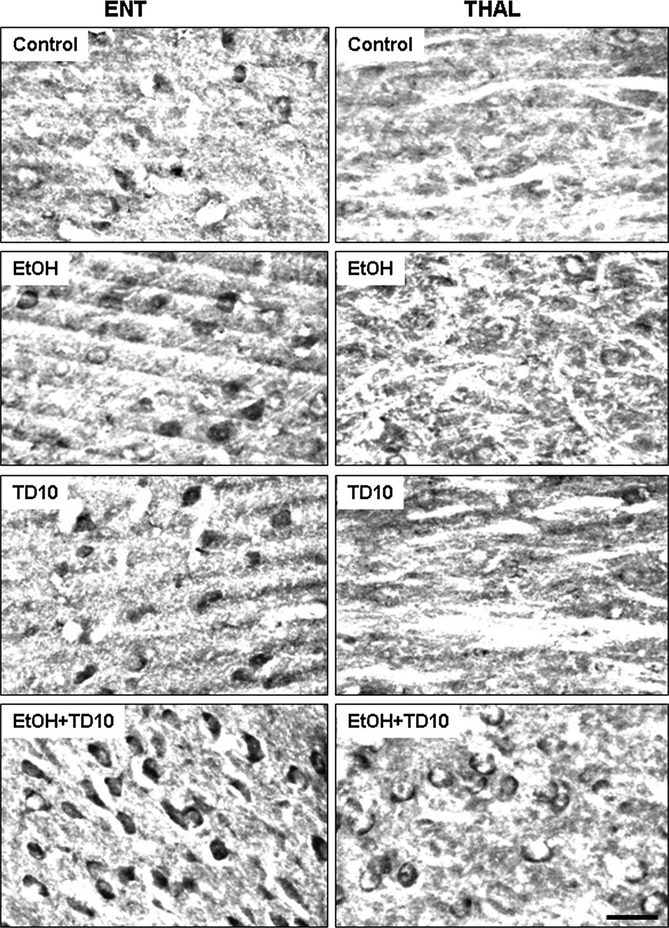
Acetyl-CoA synthetase (AcCoAS) in entorhinal cortex (ENT) and thalamus (THAL). C57BL/6 mice were treated for 10 days with vehicle, ethanol (EtOH), TD10, or EtOH combined with TD10 (EtOH+TD10) as described in the Materials and Methods. Brain sections were immunostained with anti-AcCoAS1, an antibody against AcCoAS short-chain family member 1. Note all ENT sections have dark AcCoAS1 positive immunoreactive cells (AcCoAS1 + IR), but not THAL sections. EtOH+TD10 shows the most AcCoAS1 + IR in both brain regions with ENT showing greater expression than THAL consistent with EtOH-induced induction of AcCoAS (Kiselevski et al., 2003; Learn et al., 2003). Scale bar = 30 μm. TD, thiamine deficiency.
To determine whether acetate could protect from TD10-induced THAL pathology, we administered GTA, which has been shown to increase blood acetate levels to the millimolar range (Reisenauer et al., 2011). We treated mice with GTA with or without TD10 and assessed THAL toxicity (Fig. 12). Microglial activation assessed by Iba1 + IR showed marked activation phagocytic morphology in the TD group, that was reduced to “bushy” activated microglial phenotypes in the GTA-TD group, but not to ramified “resting” morphology as seen in controls (Fig. 12A, top). Degeneration assessed by Fluoro-Jade B or NeuN+IR both indicated GTA protected the THAL from TD-induced degeneration. This group of TD animals showed marked Fluoro-Jade green areas of degeneration as well as individual dying neurons (insets middle Fig. 12A). In general, GTA protected against TD toxicity; however, there was variation within the TD and GTA-TD groups with some GTA-TD animals completely protected and others showing modest protection. The TD10-induced loss of neurons is clearly seen with NeuN+IR (Fig. 12A) where only a few nuclei remain. Quantification of both Fluoro-Jade B and NeuN+IR indicated TD-induced degeneration was reduced by GTA (Fig. 12B). These findings indicate that acetate can be used by the brain to protect against TD-induced toxicity. Together, the findings suggest the focal TD-induced THAL degeneration can be reduced by elevated acetate levels consistent with the hypothesis that focal THAL degeneration is due to the TD metabolic insult to glucose metabolism combined with a reduced ability of THAL cells to use acetate for energy.
Fig. 12.
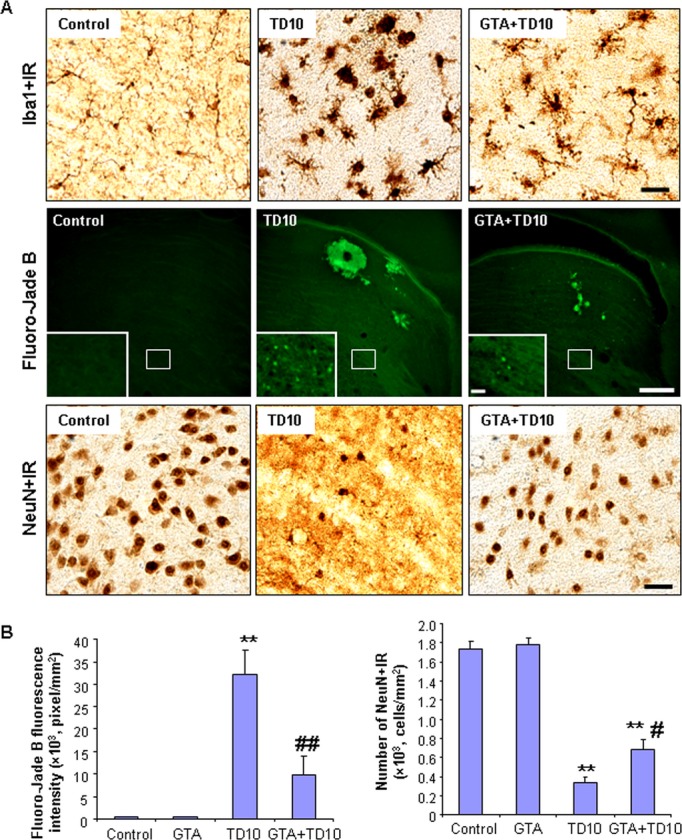
Acetate supplementation reduces thiamine deficiency (TD)-induced microglial activation and thalamic degeneration. C57BL/6 mice were treated with vehicle, glycerin triacetate (GTA), TD10, or GTA+TD10 as described in Materials and Methods. Brain sections were labeled with Iba1 antibody (a microglial marker), Fluoro-Jade B (a cell death marker), and NeuN antibody (a neuronal marker) (A) Representative images for Iba1 + IR, Fluoro-Jade-B positive, and NeuN+IR cell. Vehicle-treated microglial showed a resting morphology. TD10 induced dramatic microglial morphology changes in THAL. GTA+TD10-treated THAL showed less activated microglial morphology than TD10 alone treated THAL (the upper panel). Scale bar = 50 μm. TD10 alone had much more Fluoro-Jade B positive staining than vehicle in THAL. GTA+TD10 treatment decreased TD10-induced cell death (the middle panel). Scale bar = 200 μm. Inset scale bar = 30 μm. NeuN immunoreactivity indicated that TD10 caused significant loss of thalamic neurons, and GTA prevented TD10-induced neuronal loss (the lower panel). Scale bar = 50 μm. (B) Quantification of Fluoro-Jade B fluorescence and NeuN immunoreactivity. TD10 treatment significantly increased intensity of Fluoro-Jade B fluorescence and number of NeuN+IR cells. GTA significantly reduced TD10-induced cell death and neuronal loss. **p < 0.01, compared with vehicle controls. #p < 0.05, ##p < 0.01, compared with TD10-treated mice. THAL, thalamus.
Discussion
We report here that 5 days of TD alone treatment resulted in few markers of THAL pathology, but EtOH treatment combined with TD for 5 days shows significant increases in TD-induced THAL microglial activation and induction of brain proinflammatory cytokine, mRNA, and protein increases in neuronal death markers, and decreased neuronal density. Combined EtOH-TD-induced loss of THAL neuronal marker NeuN+IR and increases in Fluoro-Jade B+ cell death marker are consistent with EtOH accelerating neuroimmune gene induction and microglial activation that contribute to neuronal death. We have previously found that chronic EtOH primes microglial and neuroimmune responses in mice (Qin et al., 2008) and in vitro in rat brain slice cultures (Zou and Crews, 2010). Chronic EtOH treatment of mice has been found to potentiate both the systemic and brain proinflammatory cytokine responses to the Toll-like receptor 4 (TLR4) agonist lipopolysaccharide (Qin et al., 2008) and the TLR3 agonist PolyI:C (Qin and Crews, 2012). Further, we found postmortem human alcoholic brain has elevated levels of microglial markers and the cytokine MCP-1 (He and Crews, 2008). Interestingly, inhibition of MCP-1 or transgenic knockouts of MCP-1 protect mice from TD-induced THAL degeneration (Yang et al., 2011) consistent with neuroimmune gene activation contributing to TD-induced THAL degeneration. Recent studies have indicated chronic EtOH primes neuroimmune proinflammatory responses due to increased expression of neuroimmune signaling molecules including HMGB1 and its receptors, for example, TLRs, that contribute to positive loops of proinflammatory gene induction (Crews et al., 2013). These findings support the hypothesis that EtOH proinflammatory priming accelerates TD-induced THAL degeneration (Fig. 13).
Fig. 13.
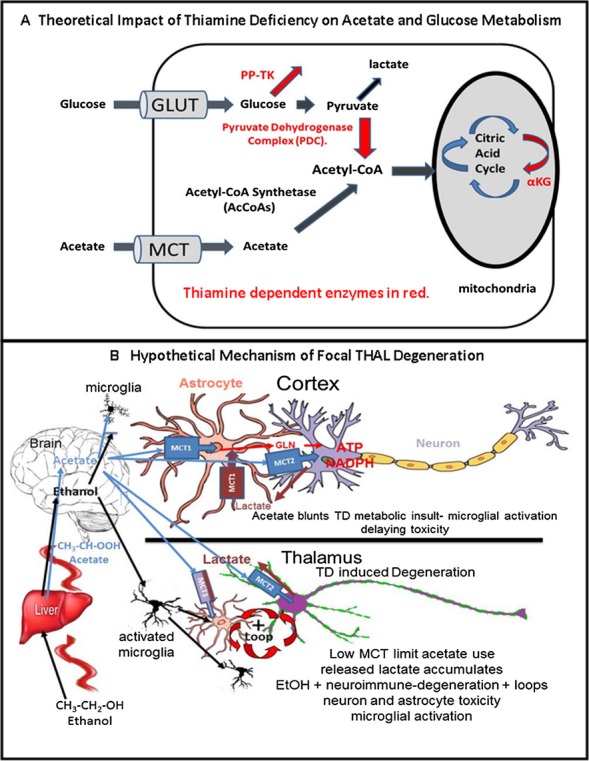
Thiamine enzymes in acetate and glucose metabolism: Hypothetical role in focal thalamus (THAL) degeneration. (A) Hypothetical impact of thiamine deficiency on acetate and glucose metabolism. Thiamine-dependent enzymes and metabolic pathways are shown in red, for example, pyruvate dehydrogenase complex (PDC), pentose phosphate transketolase (PP-TK), and α ketoglutarate dehydrogenase (αKG), a citric acid cycle enzyme. A comparison of acetate and glucose metabolism indicates both require transporters to enter cells (and the brain), for example, glucose transporters (GLUT) or monocarboxylic acid transporters (MCT) for glucose and acetate, respectively. Inside the cell, glucose is metabolized to pyruvate and lactate. Acetyl-CoA formation is critical for citric acid cycle energy production. Acetyl-CoA synthetase (AcCoAS) forms acetyl-CoA from acetate, whereas the pyruvate dehydrogenase enzyme complex (PDC), which contains thiamine-dependent components, forms acetyl-CoA from pyruvate. Note thiamine requiring enzymes PP-TK and PDC are key to glucose metabolism for energy. Wernicke-Korsakoff syndrome (WKS) patients may have a genetic predisposition related to TK. Regardless, thiamine deficiency (TD) disrupts glucose metabolism for energy more directly than acetate metabolism. (B) Hypothetical mechanism of focal thalamic degeneration due to limited acetate metabolism. Illustrated is ethanol (EtOH) absorption from the gut and metabolism to acetate in the liver. Both EtOH (black arrows) and acetate (blue arrows) flow through the blood to brain where opposite actions are proposed for THAL (bottom) compared with entorhinal cortex (cortex). EtOH can prime microglia enhancing proinflammatory gene induction (Crews et al., 2011; Fernandez-Lizarbe et al., 2009; Qin et al., 2008), whereas acetate can reduce proinflammatory responses (Reisenauer et al., 2011). THAL is illustrated in the bottom panel. Low levels of MCT and acetyl-CoA synthetase (AcCoAS) cause an initial TD metabolic insult in THAL due to a limited ability of THAL cells to use EtOH-derived acetate for energy. TD-induced THAL degeneration is accelerated by EtOH due to EtOH priming of microglia proinflammatory responses (Crews and Vetreno, 2011; Qin et al., 2008) that increase proinflammatory gene transcription accelerating TD-induced degeneration of THAL. In THAL, low levels of MCT are represented by smaller MCT boxes and reduced astrocyte markers (smaller astrocyte). Microglia become activated by EtOH, neuroimmune, and necrosis signals that create positive loops amplifying degeneration leading to THAL cell death and focal WKS lesions. Efforts to use glucose to rescue THAL pathology fail, increasing THAL degeneration likely due to glucose conversion to lactate (Hazell and Butterworth, 2009). Proinflammatory cytokines increase astrocyte glucose metabolism (Belanger et al., 2011) TD reduces PDC activity leading to extracellular lactate accumulation that is not taken up and metabolized by astrocytes due to low levels of THAL MCT. In contrast, in cortex (top diagram) the TD metabolic insult is less due to abundant astrocyte MCT1 and neuronal MCT2 and AcCoAS expression such that acetate provides energy independent of TD compromised enzymes. EtOH increases brain AcCoAS (Schwer et al., 2006) and acetate can increase acetyl-CoA levels in brain while blunting microglial activation proinflammatory responses (Reisenauer et al., 2011). Thus, in cortex, the acetate anti-inflammatory microglial response protects against the proinflammatory EtOH response. Lactate (brown) released by cells can be taken up by MCT and metabolized for energy likely protecting cortical astrocytes from the TD insult. Although THAL contains low MCT, increased acetate blunts TD-induced THAL degeneration supporting the hypothesis that THAL focal degeneration is in part due to decreased THAL ability to use acetate for energy. Acetate may be of benefit to alcoholics with TD.
Chronic EtOH is known to mildly increase expression of brain innate immune genes (Crews and Vetreno, 2011). We report here no effect of TD5 on MCP-1 mRNA, but found a significant increase in MCP-1 mRNA by EtOH alone that was further increased by EtOH-TD5 treatment. These findings suggest neuroimmune activation accelerates THAL degeneration, which is consistent with studies reporting minocycline inhibition of microglial activation delays TD alone thalamic pathology (Wang and Hazell, 2010). Our finding of THAL focal degeneration during EtOH-TD treatment is consistent with previous studies that assessed TD alone. Previous studies following THAL NeuN+cells (Ke et al., 2003) or ataxia (Vetreno et al., 2012) find 10 to 15 days of TD treatment that leads to permanent damage. We did not find THAL neuronal loss or microglial activation after 5 days of TD alone treatment, whereas EtOH-TD5 shows signs of THAL neurodegeneration including a loss of NeuN+IR cells, increased cytokine mRNA, protein, and microglial morphology changes. Our findings in mice are entirely consistent with the elegant rat studies of Hazell on TD alone THAL degeneration (Hazell and Butterworth, 2009; Hazell et al., 2010). TD alone in rats (14 days) causes THAL neuronal degeneration, loss of astrocyte markers GFAP, GS, and glutamate transporters, although it is difficult to distinguish loss of astrocyte markers from loss of astrocytes. However, activated astrocytes increase GFAP expression suggesting loss of markers represents astrocyte degeneration. Regardless, our findings and multiple TD alone studies are consistent with astrocyte dysfunction contributing to THAL focal neurodegeneration (Hazell and Butterworth, 2009; Hazell et al., 2010). Thus, TD-induced THAL neurodegeneration involves astrocyte dysfunction that contributes to the TD metabolic insult. EtOH neuroimmune activation in glia likely contributes to EtOH acceleration of THAL neuronal degeneration (Fig. 13).
TD causes a mild metabolic insult due to loss of a cofactor made from thiamine required for key enzymes in glucose metabolism, that is, pyruvate dehydrogenase, transketolase and alpha-ketoglutarate dehydrogenase, with loss of cofactor inhibiting enzyme activity and promoting degradation of the proteins (Gibson and Blass, 2007). Unique factors appear to induce focal THAL degeneration because TD alone reduces transketolase activity and protein more in the liver than in the brain (Jung et al., 1991) suggesting that the entire organism is insulted by TD inhibition of glucose metabolism. TD alone progressively insults multiple brain regions (Vetreno et al., 2012), with THAL among the most sensitive to degeneration. TD-induced acute WE can be fatal as would be expected from compromised glucose metabolism. WE-KS in humans is associated with alcoholism and unique focal lesions within components of an emotional circuit of Papez that includes THAL, mammillary bodies, cingulum, ENT, and the hippocampus (Sullivan and Pfefferbaum, 2009). We studied THAL and ENT confirming TD focal pathology in THAL, but not ENT. Although our findings support EtOH priming of neuroimmune responses as accelerating TD-induced THAL neurodegeneration these findings do not address the focal nature of TD-induced neurodegeneration.
We hypothesized that the global metabolic insult of TD was modified by EtOH, which provides significant metabolic energy independent of glucose (Fig. 13). EtOH metabolism to acetate increases liver energy. Alcohol decreases brain glucose metabolism, consistent with the brain switching from glucose to acetate derived from EtOH as a source of energy (Volkow et al., 2006). Studies in humans (Volkow et al., 2013) and rats (Pawlosky et al., 2010) indicate that EtOH and/or acetate reduce brain glucose metabolism. In humans, acute EtOH intoxication decreased whole brain glucose metabolism, but the smallest reduction was in THAL, consistent with a reduced ability of THAL to metabolize acetate (Volkow et al., 2013). Acetate has been found to reduce EtOH induction of hepatic proinflammatory cytokines and to up-regulate AcCoAS, a key enzyme in acetate energy metabolism (Kendrick et al., 2010). Acetate from EtOH metabolism is released into the blood during binge drinking providing an energy substrate for multiple tissues, including brain (Fig. 13) (Waniewski and Martin, 2004) and reducing glucose requirements (Jiang et al., 2009). Hepatic EtOH metabolism increases blood acetate to about 2 mM (Nicholas et al., 2008). MCT1 and MCT2 have acetate Km of 2.2 and 2.6 mM, respectively (Moschen et al., 2012), consistent with increases in acetate transport into brain as serum concentrations rise. Cellular acetate provides energy independent of TD compromised enzymes (Fig. 13) (Schwer et al., 2006). Further, chronic EtOH treatment increases blood and brain acetate and acetyl-CoA (Kiselevski et al., 2003). Interestingly, increases in blood acetate blunt lipopolysaccharide-induced neuroinflammation (Reisenauer et al., 2011). Thus, alcoholics consuming EtOH to levels that increase blood acetate providing metabolic energy may be protected against the TD-induced global metabolic insults, which primarily disrupt glucose metabolism (Fig. 13). Although we did not find TD-induced neurodegeneration in ENT, TD10 did induce ENT microglial and astrocyte markers, which appeared normalized by combined EtOH-TD10 treatment consistent with EtOH-derived acetate blunting ENT glial activation in EtOH-TD10-treated animals. These findings are consistent with EtOH-derived acetate blunting the TD-induced metabolic insult and toxicity-induced immune gene induction.
Acetate is transported by MCT (Newman et al., 2011; Suzuki et al., 2011). We compared expression of MCT1 and MCT2 in control THAL and ENT because THAL cell loss confounds interpretations of levels following treatment. We found basal expression of both MCT was markedly lower in THAL than ENT. Previous studies have found low levels of MCT1 and MCT2 mRNA expression in THAL as well as mammillary bodies and other brain regions sensitive to TD (Pellerin et al., 1998). Low MCT could also explain the paradoxical increase in TD-induced THAL degeneration found during efforts to rescue WE pathology with glucose (Navarro et al., 2008). In addition to low MCT, we found low levels of AcCoAS in THAL compared with ENT. Low MCT and AcCoAS could limit acetate metabolism in THAL increasing the TD THAL metabolic insult relative to ENT and other brain regions better able to use acetate for energy. We treated mice with GTA, which is known to increase blood acetate (Reisenauer et al., 2011). We found elevating acetate with GTA-reduced TD-induced THAL microglial activation, cell degeneration, and neuronal loss consistent with acetate partially rescuing THAL from the TD metabolic insult. These findings present the interesting possibility that acetate supplementation might be used to rescue WE-KS patients, although additional studies are needed to further test the role of MCT and AcCoAS in focal TD-induced degeneration.
In summary, our findings suggest 2 opposing actions of EtOH on the TD insulted brain (Fig. 13). EtOH itself primes microglia and proinflammatory TD responses in THAL accelerating degeneration, whereas acetate formed from EtOH provides a source of energy independent of TD protecting cells and alcoholics from the TD-induced loss of glucose-derived energy increasing the chances of thiamine rescue through dietary sources and survival of TD. Acetate may represent a potential treatment for acute WE. Additional studies are needed to understand TD-induced focal pathology and to determine whether acetate supplementation can rescue acute WS.
Acknowledgments
This work was supported by NIAAA (AA020023, AA020024, AA020022, AA019767, AA11605, and AA007573) and the Bowles Center for Alcohol Studies. The authors thank Tonya Hurst, Diana Lotito, and Ryan Vetreno, PhD for assisting and Dr. T. A. Rosenberger for help with the GTA treatment.
References
- Alexander-Kaufman K, James G, Sheedy D, Harper C, Matsumoto I. Differential protein expression in the prefrontal white matter of human alcoholics: a proteomics study. Mol Psychiatry. 2006;11:56–65. doi: 10.1038/sj.mp.4001741. [DOI] [PubMed] [Google Scholar]
- Belanger M, Allaman I, Magistretti PJ. Differential effects of pro- and anti-inflammatory cytokines alone or in combinations on the metabolic profile of astrocytes. J Neurochem. 2011;116:564–576. doi: 10.1111/j.1471-4159.2010.07135.x. [DOI] [PubMed] [Google Scholar]
- Caine D, Halliday GM, Kril JJ, Harper CG. Operational criteria for the classification of chronic alcoholics: identification of Wernicke's encephalopathy. J Neurol Neurosurg Psychiatry. 1997;62:51–60. doi: 10.1136/jnnp.62.1.51. [DOI] [PMC free article] [PubMed] [Google Scholar]
- Cook CC, Hallwood PM, Thomson AD. B vitamin deficiency and neuropsychiatric syndromes in alcohol misuse. Alcohol Alcohol. 1998;33:317–336. doi: 10.1093/oxfordjournals.alcalc.a008400. [DOI] [PubMed] [Google Scholar]
- Crews FT, Nixon K, Wilkie ME. Exercise reverses ethanol inhibition of neural stem cell proliferation. Alcohol. 2004;33:63–71. doi: 10.1016/j.alcohol.2004.04.005. [DOI] [PubMed] [Google Scholar]
- Crews FT, Qin L, Sheedy D, Vetreno RP, Zou J. High mobility group box 1/Toll-like receptor danger signaling increases brain neuroimmune activation in alcohol dependence. Biol Psychiatry. 2013;73:602–612. doi: 10.1016/j.biopsych.2012.09.030. [DOI] [PMC free article] [PubMed] [Google Scholar]
- Crews FT, Vetreno RP. Addiction, adolescence, and innate immune gene induction. Front Psychiatry. 2011;2:19. doi: 10.3389/fpsyt.2011.00019. [DOI] [PMC free article] [PubMed] [Google Scholar]
- Crews FT, Zou J, Qin L. Induction of innate immune genes in brain create the neurobiology of addiction. Brain Behav Immun. 2011;25(Suppl 1):S4–S12. doi: 10.1016/j.bbi.2011.03.003. [DOI] [PMC free article] [PubMed] [Google Scholar]
- Fernandez-Lizarbe S, Pascual M, Guerri C. Critical role of TLR4 response in the activation of microglia induced by ethanol. J Immunol. 2009;183:4733–4744. doi: 10.4049/jimmunol.0803590. [DOI] [PubMed] [Google Scholar]
- Gibson GE, Blass JP. Thiamine-dependent processes and treatment strategies in neurodegeneration. Antioxid Redox Signal. 2007;9:1605–1619. doi: 10.1089/ars.2007.1766. [DOI] [PubMed] [Google Scholar]
- Halestrap AP, Wilson MC. The monocarboxylate transporter family—role and regulation. IUBMB Life. 2012;64:109–119. doi: 10.1002/iub.572. [DOI] [PubMed] [Google Scholar]
- Hallows WC, Lee S, Denu JM. Sirtuins deacetylate and activate mammalian acetyl-CoA synthetases. Proc Natl Acad Sci USA. 2006;103:10230–10235. doi: 10.1073/pnas.0604392103. [DOI] [PMC free article] [PubMed] [Google Scholar]
- Hazell AS, Butterworth RF. Update of cell damage mechanisms in thiamine deficiency: focus on oxidative stress, excitotoxicity and inflammation. Alcohol Alcohol. 2009;44:141–147. doi: 10.1093/alcalc/agn120. [DOI] [PubMed] [Google Scholar]
- Hazell AS, Sheedy D, Oanea R, Aghourian M, Sun S, Jung JY, Wang D, Wang C. Loss of astrocytic glutamate transporters in Wernicke encephalopathy. Glia. 2010;58:148–156. doi: 10.1002/glia.20908. [DOI] [PMC free article] [PubMed] [Google Scholar]
- He J, Crews FT. Increased MCP-1 and microglia in various regions of the human alcoholic brain. Exp Neurol. 2008;210:349–358. doi: 10.1016/j.expneurol.2007.11.017. [DOI] [PMC free article] [PubMed] [Google Scholar]
- He X, Sullivan EV, Stankovic RK, Harper CG, Pfefferbaum A. Interaction of thiamine deficiency and voluntary alcohol consumption disrupts rat corpus callosum ultrastructure. Neuropsychopharmacology. 2007;32:2207–2216. doi: 10.1038/sj.npp.1301332. [DOI] [PubMed] [Google Scholar]
- Jiang L, Gulanski B, Weinzimer S, Pittman B, Guidone E, Koretski J, Harman S, Petrakis IL, Krystal JH, Mason GF. Increased brain uptake and oxidation of acetate in heavy drinkers. J Clin Invest. 2013;123:1605–1614. doi: 10.1172/JCI65153. [DOI] [PMC free article] [PubMed] [Google Scholar]
- Jiang L, Herzog RI, Mason GF, de Graaf RA, Rothman DL, Sherwin RS, Behar KL. Recurrent antecedent hypoglycemia alters neuronal oxidative metabolism in vivo. Diabetes. 2009;58:1266–1274. doi: 10.2337/db08-1664. [DOI] [PMC free article] [PubMed] [Google Scholar]
- Jung EH, Itokawa Y, Nishino K. Effect of chronic alcohol administration on transketolase in the brain and the liver of rats. Am J Clin Nutr. 1991;53:100–105. doi: 10.1093/ajcn/53.1.100. [DOI] [PubMed] [Google Scholar]
- Ke ZJ, DeGiorgio LA, Volpe BT, Gibson GE. Reversal of thiamine deficiency-induced neurodegeneration. J Neuropathol Exp Neurol. 2003;62:195–207. doi: 10.1093/jnen/62.2.195. [DOI] [PubMed] [Google Scholar]
- Kendrick SF, O'Boyle G, Mann J, Zeybel M, Palmer J, Jones DE, Day CP. Acetate, the key modulator of inflammatory responses in acute alcoholic hepatitis. Hepatology. 2010;51:1988–1997. doi: 10.1002/hep.23572. [DOI] [PubMed] [Google Scholar]
- Kiselevski Y, Oganesian N, Zimatkin S, Szutowicz A, Angielski S, Niezabitowski P, Uracz W, Gryglewski RJ. Acetate metabolism in brain mechanisms of adaptation to ethanol. Med Sci Monit. 2003;9:BR178–BR182. [PubMed] [Google Scholar]
- Kopelman MD, Thomson AD, Guerrini I, Marshall EJ. The Korsakoff syndrome: clinical aspects, psychology and treatment. Alcohol Alcohol. 2009;44:148–154. doi: 10.1093/alcalc/agn118. [DOI] [PubMed] [Google Scholar]
- Korri UM, Nuutinen H, Salaspuro M. Increased blood acetate: a new laboratory marker of alcoholism and heavy drinking. Alcohol Clin Exp Res. 1985;9:468–471. doi: 10.1111/j.1530-0277.1985.tb05585.x. [DOI] [PubMed] [Google Scholar]
- Learn JE, Smith DG, McBride WJ, Lumeng L, Li TK. Ethanol effects on local cerebral glucose utilization in high-alcohol-drinking and low-alcohol-drinking rats. Alcohol. 2003;29:1–9. doi: 10.1016/s0741-8329(02)00323-3. [DOI] [PubMed] [Google Scholar]
- Liu J, Lewohl JM, Harris RA, Iyer VR, Dodd PR, Randall PK, Mayfield RD. Patterns of gene expression in the frontal cortex discriminate alcoholic from nonalcoholic individuals. Neuropsychopharmacology. 2006;31:1574–1582. doi: 10.1038/sj.npp.1300947. [DOI] [PubMed] [Google Scholar]
- Martin PR, Singleton CK, Hiller-Sturmhofel S. The role of thiamine deficiency in alcoholic brain disease. Alcohol Res Health. 2003;27:134–142. [PMC free article] [PubMed] [Google Scholar]
- Morgan M. Nutritional aspects of liver and biliary disease. In: Bircher J, Benhamou JP, McIntyre N, Rizzetto M, Rodés J, editors. Oxford Textbook of Clinical Hepatology. Oxford: Oxford Medical Publication; 1999. pp. 1923–1981. [Google Scholar]
- Moschen I, Broer A, Galic S, Lang F, Broer S. Significance of short chain fatty acid transport by members of the monocarboxylate transporter family (MCT) Neurochem Res. 2012;37:2562–2568. doi: 10.1007/s11064-012-0857-3. [DOI] [PubMed] [Google Scholar]
- Navarro D, Zwingmann C, Butterworth RF. Region-selective alterations of glucose oxidation and amino acid synthesis in the thiamine-deficient rat brain: a re-evaluation using 1H/13C nuclear magnetic resonance spectroscopy. J Neurochem. 2008;106:603–612. doi: 10.1111/j.1471-4159.2008.05410.x. [DOI] [PubMed] [Google Scholar]
- Newman LA, Korol DL, Gold PE. Lactate produced by glycogenolysis in astrocytes regulates memory processing. PLoS ONE. 2011;6:e28427. doi: 10.1371/journal.pone.0028427. [DOI] [PMC free article] [PubMed] [Google Scholar]
- Nicholas PC, Kim D, Crews FT, Macdonald JM. 1H NMR-based metabolomic analysis of liver, serum, and brain following ethanol administration in rats. Chem Res Toxicol. 2008;21:408–420. doi: 10.1021/tx700324t. [DOI] [PubMed] [Google Scholar]
- Patel AB, de Graaf RA, Rothman DL, Behar KL, Mason GF. Evaluation of cerebral acetate transport and metabolic rates in the rat brain in vivo using 1H-[13C]-NMR. J Cereb Blood Flow Metab. 2010;30:1200–1213. doi: 10.1038/jcbfm.2010.2. [DOI] [PMC free article] [PubMed] [Google Scholar]
- Pawlosky RJ, Kashiwaya Y, Srivastava S, King MT, Crutchfield C, Volkow N, Kunos G, Li TK, Veech RL. Alterations in brain glucose utilization accompanying elevations in blood ethanol and acetate concentrations in the rat. Alcohol Clin Exp Res. 2010;34:375–381. doi: 10.1111/j.1530-0277.2009.01099.x. [DOI] [PMC free article] [PubMed] [Google Scholar]
- Pellerin L, Pellegri G, Martin JL, Magistretti PJ. Expression of monocarboxylate transporter mRNAs in mouse brain: support for a distinct role of lactate as an energy substrate for the neonatal vs. adult brain. Proc Natl Acad Sci USA. 1998;95:3990–3995. doi: 10.1073/pnas.95.7.3990. [DOI] [PMC free article] [PubMed] [Google Scholar]
- Qin L, Crews FT. Chronic ethanol increases systemic TLR3 agonist-induced neuroinflammation and neurodegeneration. J Neuroinflammation. 2012;9:130. doi: 10.1186/1742-2094-9-130. [DOI] [PMC free article] [PubMed] [Google Scholar]
- Qin L, He J, Hanes RN, Pluzarev O, Hong JS, Crews FT. Increased systemic and brain cytokine production and neuroinflammation by endotoxin following ethanol treatment. J Neuroinflammation. 2008;5:10. doi: 10.1186/1742-2094-5-10. [DOI] [PMC free article] [PubMed] [Google Scholar]
- Reisenauer CJ, Bhatt DP, Mitteness DJ, Slanczka ER, Gienger HM, Watt JA, Rosenberger TA. Acetate supplementation attenuates lipopolysaccharide-induced neuroinflammation. J Neurochem. 2011;117:264–274. doi: 10.1111/j.1471-4159.2011.07198.x. [DOI] [PMC free article] [PubMed] [Google Scholar]
- Sarkola T, Iles MR, Kohlenberg-Mueller K, Eriksson CJ. Ethanol, acetaldehyde, acetate, and lactate levels after alcohol intake in white men and women: effect of 4-methylpyrazole. Alcohol Clin Exp Res. 2002;26:239–245. [PubMed] [Google Scholar]
- Schwer B, Bunkenborg J, Verdin RO, Andersen JS, Verdin E. Reversible lysine acetylation controls the activity of the mitochondrial enzyme acetyl-CoA synthetase 2. Proc Natl Acad Sci USA. 2006;103:10224–10229. doi: 10.1073/pnas.0603968103. [DOI] [PMC free article] [PubMed] [Google Scholar]
- Sullivan EV, Pfefferbaum A. Neuroimaging of the Wernicke-Korsakoff syndrome. Alcohol Alcohol. 2009;44:155–165. doi: 10.1093/alcalc/agn103. [DOI] [PMC free article] [PubMed] [Google Scholar]
- Suzuki A, Stern SA, Bozdagi O, Huntley GW, Walker RH, Magistretti PJ, Alberini CM. Astrocyte-neuron lactate transport is required for long-term memory formation. Cell. 2011;144:810–823. doi: 10.1016/j.cell.2011.02.018. [DOI] [PMC free article] [PubMed] [Google Scholar]
- Thomson AD, Jeyasingham MD, Pratt OE, Shaw GK. Nutrition and alcoholic encephalopathies. Acta Med Scand Suppl. 1987;717:55–65. doi: 10.1111/j.0954-6820.1987.tb13042.x. [DOI] [PubMed] [Google Scholar]
- Vetreno RP, Ramos RL, Anzalone S, Savage LM. Brain and behavioral pathology in an animal model of Wernicke's encephalopathy and Wernicke-Korsakoff Syndrome. Brain Res. 2012;1436:178–192. doi: 10.1016/j.brainres.2011.11.038. [DOI] [PMC free article] [PubMed] [Google Scholar]
- Volkow ND, Kim SW, Wang GJ, Alexoff D, Logan J, Muench L, Shea C, Telang F, Fowler JS, Wong C, Benveniste H, Tomasi D. Acute alcohol intoxication decreases glucose metabolism but increases acetate uptake in the human brain. Neuroimage. 2013;64:277–283. doi: 10.1016/j.neuroimage.2012.08.057. [DOI] [PMC free article] [PubMed] [Google Scholar]
- Volkow ND, Wang GJ, Franceschi D, Fowler JS, Thanos PP, Maynard L, Gatley SJ, Wong C, Veech RL, Kunos G, Kai Li T. Low doses of alcohol substantially decrease glucose metabolism in the human brain. Neuroimage. 2006;29:295–301. doi: 10.1016/j.neuroimage.2005.07.004. [DOI] [PubMed] [Google Scholar]
- Wang D, Hazell AS. Microglial activation is a major contributor to neurologic dysfunction in thiamine deficiency. Biochem Biophys Res Commun. 2010;402:123–128. doi: 10.1016/j.bbrc.2010.09.128. [DOI] [PubMed] [Google Scholar]
- Waniewski RA, Martin DL. Astrocytes and synaptosomes transport and metabolize lactate and acetate differently. Neurochem Res. 2004;29:209–217. doi: 10.1023/b:nere.0000010450.21586.a6. [DOI] [PubMed] [Google Scholar]
- Yang G, Meng Y, Li W, Yong Y, Fan Z, Ding H, Wei Y, Luo J, Ke ZJ. Neuronal MCP-1 mediates microglia recruitment and neurodegeneration induced by the mild impairment of oxidative metabolism. Brain Pathol. 2011;21:279–297. doi: 10.1111/j.1750-3639.2010.00445.x. [DOI] [PMC free article] [PubMed] [Google Scholar]
- Zou J, Crews F. Induction of innate immune gene expression cascades in brain slice cultures by ethanol: key role of NF-kappaB and proinflammatory cytokines. Alcohol Clin Exp Res. 2010;34:777–789. doi: 10.1111/j.1530-0277.2010.01150.x. [DOI] [PubMed] [Google Scholar]


