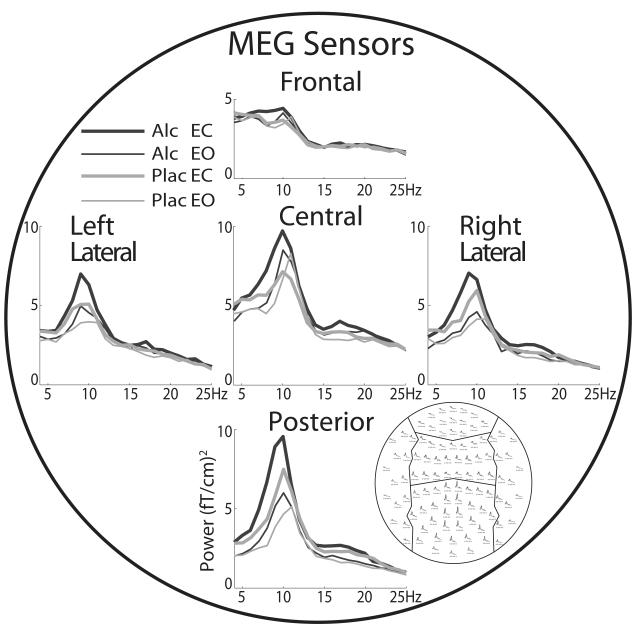
Fig. 1.
Sensor-space group average profiles of spectral power acquired with MEG gradiometers positioned over the frontal, central, posterior, and left and right lateral areas of the head. Average power spectra for the four conditions resulting from the within-subject factorial design incorporating the factors of eyes-open (EO) and eyes-closed (EC) and beverage (alcohol [Alc] and placebo [Plac]) are superimposed.

