Abstract
Knowledge of vibratory patterns in the cochlea is crucial to understanding the stimulation of mechanosensory cells. Experiments to determine the motion of the cochlear partition and surrounding fluid are extremely challenging. As a result, the motion data are incomplete and often contradictory. The bending mechanism of hair bundles, thought to be related to the shear motion and endolymphatic flow between the tectorial membrane (TM) and reticular lamina (RL), is controversial. We, therefore, extend the frequency range of our previous hybrid analytical–finite-element approach to model the basal as well as apical regions of the guinea pig cochlea. We solve the fluid-solid interaction eigenvalue problem for the axial wavenumber, fluid pressure, and vibratory relative motions of the cochlear partition as a function of frequency. A simple monophasic vibratory mode of the basilar membrane is found at both ends of the cochlea. However, this simple movement is associated with a complex frequency-dependent relative deformation between the TM and the RL. We provide evidence of a radial component of TM motion that is out of phase with the RL and that facilitates the bending of outer hair cell stereocilia at appropriate frequencies at both the cochlear base and apex.
A dynamic fluid—structure interaction occurs when the cochlea is stimulated by environmental sounds. This interaction elicits a transverse wave on the cochlear partition (CP), which travels from the base to the apex of the spiral-shaped hearing organ. Details of the vibratory mode shape of this traveling wave are directly related to the bending of hair bundles and, therefore, are very important to the understanding of the stimulation of inner hair cells (IHCs) and outer hair cells (OHCs), which lies at the very core of hearing transduction (1, 2). The tectorial membrane (TM) radial resonance is thought to be one potential bending mechanism of the stereocilia. The origin and evolution of ideas concerning the radial motion of the TM is discussed fully in Zwislocki's recent monograph (3). In short, new ideas were needed to resolve discrepancies in both amplitude and phase of the tuning of mechanical, neural, and cellular responses. TM radial motion, consequently, was incorporated in mathematical models of cochlear micromechanics by using the lumped-parameter approach (1, 3–9). Although indirect evidence inferred from frequency tuning of otoacoustic emissions (10, 11) and cochlear microphonics (12) lent support to the idea of radial TM motion, direct evidence awaited the measurements of Gummer et al. (13) and Hemmert et al. (14). These latter findings contrast those of Ulfendahl et al. (15), who reported almost no radial motion of the TM. Preliminary observations of TM motion in the hemicochlea preparation also do not yet show a significant TM radial motion (16, 17). It seems that the local excitation in that preparation has difficulty in exciting a significantly propagating mode, which could affect the TM motion.
Another controversy involves the transverse mode shape of the basilar membrane (BM), i.e., the variation in phase across the width of the BM. Both monophasic (18) and multiphasic (19) responses have been reported in the basal turn of the guinea pig cochlea. Whereas the BM is accessible at the base, the TM and organ of Corti (OC) are not. In contrast, the TM and OC are accessible at the apex, whereas the BM is difficult to probe (20). Our recently developed model (21) is, therefore, very helpful in resolving these conflicting findings. Although we did not see a significant TM radial motion in ref. 21, it was at the time premature to rule out the effect. Indeed, now that we have been able to extend the frequency range, we find evidence of TM radial motion at both the base and apex of the hearing organ in a complex continuum model.
Model Description
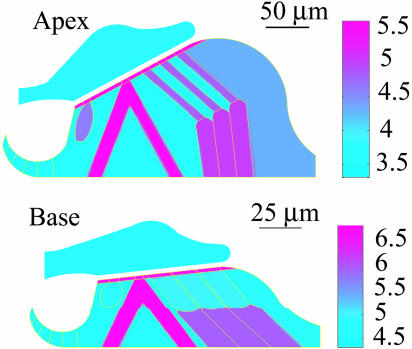
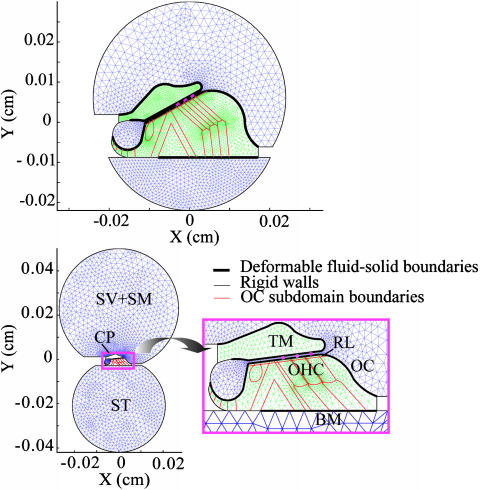
Here, we give a descriptive account of the model; a more detailed account, including the equations, boundary conditions, and iterative computational algorithm involving matlab elliptic and eigenvalue solvers (Mathworks, Natick, MA), is given in ref. 21. The computation is carried out in transverse (X, Y) planes. Fig. 2 shows two from a continuum of such planes, one at a basal region and the other at an apical region. The basal region was not treated previously (21), and the geometry of the apical region has been altered to reflect the correct tilt of the RL with respect to the BM. Each plane, or section, is divided into fluid and elastic domains. The elastic domain representing the OC is divided further into subdomains to include discrete cellular structures. The elastic subdomains are assigned different values for Young's modulus, E; our E-maps are shown in Fig. 2. The elasticity parameters for the apex are almost identical, with some changes in the Hensen cell region, to those used in ref. 21.
Fig. 2.
Distribution of the Young's modulus (E-map) used in the model. (Upper) Apical turn of the cochlea. (Lower) Basal turn of the cochlea. Scale bar represents log10E, where E is Young's modulus in dyn/cm2. The stereocilia stiffness values are 1 and 8 dyn/cm at apical and basal sites of the cochlea, respectively (22). Modulus of the BM (see Fig. 1) is given in Table 1.
Computations are done separately for each section; this is the main computational advantage of our method, which relies on the WKB approximation (21). In effect, this approximation assumes a wave propagates in the axial (Z) direction, with wavenumber k, such that for waves propagating from base to apex a Z-derivative is replaced by -ik. Although k becomes an additional unknown, it is still computationally simpler to find k than to numerically compute all of the sections coupled together. The only inputs to the computation are the geometry of the section, the material properties, and the frequency, ω. The outputs of the computation are the wavenumber k, and relative displacements of the OC, BM, and TM, together with the corresponding fluid motion field. The displacements are only relative because there is no local forcing in the cross section. If there is no local forcing, then why does anything move? The same question can be asked about any free-vibration problem. Usually in free-vibration problems, one seeks the natural frequencies ωn (n = 1, 2,..., N) and corresponding modes of vibration of a structure with N degree of freedom, where the ωn are the eigenvalues of the system. In the present case, however, the frequency ω is an input parameter, and the kn become eigenvalues for the fluid-structure interaction problem. Our algorithm seeks the kn with the least-negative imaginary part, which corresponds to the dominant propagating wave. The WKB method can, in principle, be extended to determine absolute rather than relative motions. That requires the application of an energy-transport equation, which relates the relative motions to a known forcing, e.g., the stapes input. Because we are not yet able to do this calculation for a model of this complexity, we cannot compute tuning curves here.
Other assumptions and simplifications built into the model are summarized here. The fluid compartments are comprised of viscous, incompressible fluid with dynamics following the linearized Navier–Stokes equations. Note that the scala media and scala vestibuli are combined into one compartment, with Reissner's membrane removed (Fig. 1). The solid domains (TM and OC) are modeled as linear isotropic Voigt solids. A Voigt solid is an elastic solid with E replaced by E + iωE′ to account for damping in the solid. Here, for simplicity, the TM is assumed to be homogeneous, whereas the OC is inhomogeneous. The role of structural inhomogeneity and anisotropy of the TM is beyond the scope of the present work. Note that extracellular fluid spaces and tunnel spaces in the OC are not treated as fluid domains but are simplified to be soft Voigt solids. The BM is treated as an orthotropic plate, and the TM and RL are elastically coupled through the stereocilia bundle stiffness. The OHCs are treated as passive structural elements; we do, however, investigate the effect of introducing a negative bundle-stiffness parameter (23). It is important to emphasize that although the computations are performed in planes, we still retain coupling in the axial direction through the wavenumber k both in the fluid and solid domains. Axial fluid flows can be inferred from the model (for e.g., see ref. 21).
Fig. 1.
Geometry and mesh of cross sections at apical (Upper) and basal (Lower) regions of the cochlea. X and Y indicate the radial and transverse directions, respectively. The size of the CP is very small compared with the fluid compartments at the base. A magnified view of the CP geometry and mesh is shown in Inset. The TM and OC are modeled as 2D elastic domains. The TM is homogeneous, whereas the OC contains different subdomains representing discrete cellular structures. The OC has the RL as its top boundary and rests on the BM, which is represented by an orthotropic clamped plate. The TM-RL gap is the narrow fluid-filled space between the RL and the lower surface of the TM. Stereocilia of the OHCs elastically couple the RL and TM. The scala tympani (ST) is the fluid compartment on the lower side, whereas the upper fluid region is the combined scala media (SM) and scala vestibuli (SV).
Model Specification
Constructing a model of such complexity is an evolving process that necessarily involves compromises and estimates with various degrees of soundness. Compromises arise because attempts to be more realistic result either in nonconvergence of the solution or in converged solutions that are obviously not correct. An example of the latter was our attempt to include extracellular fluid spaces in the OC, such as the tunnel of Corti, which resulted in unrealistically large pressures in these spaces. The reason for this artifact is that the true 3D structure of the OC is not yet captured in our current model, and as a result, the fluid paths were overly constrained. To avoid this problem, we chose in the current model to represent these fluid spaces as soft Voigt materials.
Estimates of material properties are required because the subdomains of the solid-domain solvers each requires a Young's modulus E (dyn/cm2) and Poisson's ratio. Poisson's ratio specifies the ratio of transverse strain to axial strain resulting from an axial stress. We model the solid material as almost incompressible by using the value 0.49 for Poisson's ratio. Specification of E values is a much more difficult problem because E is not a quantity that can be measured directly. Calibrated mechanical probes can only determine a point stiffness K (dyn/cm). A theoretical model is required to infer E from K. Zwislocki and Cefaratti (12) inferred E for the TM, for example, by using their measured pattern of deformation.
Three main sources guided our modeling of the guinea pig geometry. We used Salt et al. (25) for scalae areas, Kelly (26) for morphometry of the apical turn, and Echteler et al. (27) for base–apex geometrical relations. At low frequencies, the cross-sectional areas of the scalae affect fluid loading, but the boundary shape itself is not very important. We, therefore, simplified the bony boundaries as circular arcs in the apical cross section. In the basal region, we had to compromise by making scalae areas smaller than is realistic for the base. Because the CP area is a very small fraction of the scalae areas at the base of the guinea pig cochlea, meshing problems prevent us from using true scalae areas. This limitation should be of minor consequence, however, because our computation of pressure at the base indicates that the cochlear wave is confined to very near the CP at high frequencies and is insensitive to the shape of the outer boundaries. The E-map given in Fig. 2 and the values of Table 1 were obtained by using the following strategies. Isolated OHC axial stiffness (K) (28) was converted to an elastic modulus by using the formula E = KL/A, where L and A are the length and cross-sectional area of the cylindrical cell. The formula assumes that a 1D Hooke's law holds. The RL comprises filament-containing pillar cells and Deiters cells (29); therefore, these structures should have higher moduli than OHCs. Cytoskeletal filaments have an elastic modulus in the GPa range (1 GPa = 1010 dyn/cm2) (30). But because the filaments occupy only a small portion of the supporting structures and RL, the E values of the pillar and Deiters cells and RL should be <1 GPa. However, the BM seems to require a large E. This requirement is consistent with other models based on flexural rigidity and requiring a bending modulus D = Eh3/12 (24, 31). BM thickness h was obtained from (27). Other cells in the OC without cytoskeletal filaments (e.g., Hensen cells) were assigned E values smaller than those of the OHCs. The E values we used for the TM are consistent with an estimate given by Zwislocki and Cefaratti (12). Their estimate for shear stiffness per unit length can be interpreted as a shear modulus, which is E/3 for an incompressible, isotropic material. Also, our modeling values are not only close to our measured values, but they anticipated them (B.S., unpublished data) on isolated TM probed by using atomicforce microscopy.
Table 1. Young's moduli E (dyn/cm2).
| Region | Apex | Base |
|---|---|---|
| BM | 2 × 10⁹ | 3 × 10⁸ |
| TM | 1 × 10⁴ | 4 × 10⁴ |
| OC | 2 × 10³ | 2 × 10⁴ |
| HS | 1 × 10⁴ | 5 × 10⁴ |
| RL | 3 × 10⁵ | 5 × 10⁶ |
| PI | 5 × 10⁵ | 8 × 10⁶ |
| DE | 1 × 10⁵ | 1 × 10⁶ |
| OHC | 6 × 10⁴ | 9 × 10⁴ |
| IHC | 4 × 10⁴ | 7 × 10⁴ |
Stereocilia stiffness was 1 and 8 dyn/cm for apex and base, respectively. HS, Hensen cells; PT, Pillar cells; DE, Deiters cells.
Results
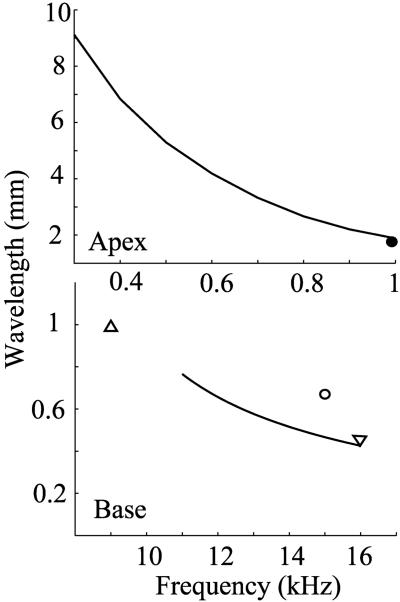
Wavelength of the Traveling Wave. The axial wavelength λ of the traveling wave is related to the real part of the wavenumber by λ = 2π/Re[k]. Our computed wavelength–frequency relations at the apical and basal regions are shown in Fig. 3. Experimental values from the literature measured in the guinea pig or gerbil that are within or near our computable frequency range are included for comparison. (The gerbil is included because its high-frequency hearing limit is similar to that of the guinea pig.) In the basal region of the gerbil cochlea, Ren (Fig. 1) (32) measured a wavelength of 0.45 mm at 16 kHz; Russell et al. (33) measured 0.67 mm at 15 kHz in the guinea pig; and Kohllöffel (34) measured 1 mm at 9 kHz in the guinea pig (postmortem). At the apex of the guinea pig cochlea, Cooper and Rhode (35) measured 1.55 mm at 1 kHz.
Fig. 3.
Axial wavelength of the traveling wave as a function of frequency at the apex (Upper) and base (Lower) of the cochlea. Our computed results (solid lines) are compared with the following measured values from the literature:▿, gerbil data from ref. 32; ○, guinea pig data from ref. 33; ▵, guinea pig data from ref. 34; •, guinea pig data from ref. 35.
Damping Factor of the Traveling Wave. We calculate an axial decay rate, β (in dB/mm), which is related to the imaginary part of the wavenumber by β = -20log10{exp[-0.1Im(k)]}. We use β in the following two ways: first, to determine whether a wave propagates, and second, to estimate the characteristic frequency of a cross section. The wave propagates when β is much smaller than 40–50 dB/mm reported at the cut-off region of the traveling wave (36, 37) or the 58 dB/mm reported for the click response in the hemicochlea (36). The frequency at which β approaches the cut-off value provides an estimate for the characteristic frequency. By using this method, we find characteristic frequencies of 1.8 kHz and 20 kHz for the apical and basal cross sections, respectively.
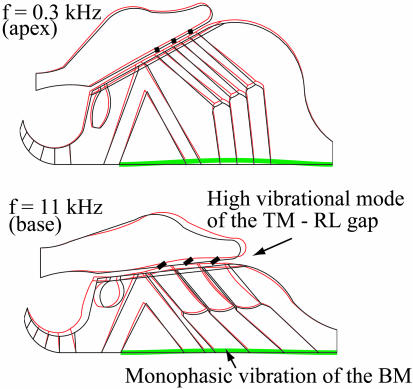
Vibrational Patterns of the CP. We find a monophasic vibrational mode of the BM at both the apical and basal portions of the cochlea, with the maximum vibration amplitude at the location of the first row of Deiters cells (Fig. 4). This result is consistent with the experimental observations at the base (18, 37). However, this simple upward transverse movement of the BM is associated with a complex vibrational mode of the TM–RL gap at high frequency (Fig. 4), and it induces a clockwise rotation of the stereocilia, as is commonly believed in the classical view (3, 38). Note that the stereocilia rotation is smaller at 0.3 kHz than at 11 kHz, consistent with the view that their stiffness can be overcome by TM inertia (3).
Fig. 4.
Vibrational mode of the CP at the apical (Upper) and basal (Lower) regions of the hearing organ. The BM exhibits a simple monophasic motion, whereas the TM–RL gap develops a higher vibrational mode at high frequency.
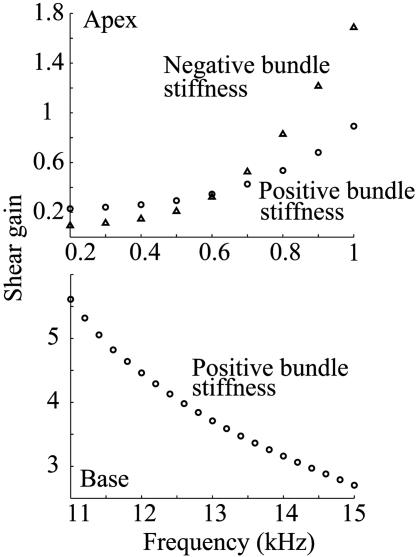
The shear gain is a useful index to quantify the bending mechanism of the stereocilary bundle (39, 6). Fig. 5 shows our computed shear gain–frequency relation at the apical and basal turns of the cochlea. Purely geometric theories (6, 39) do not show frequency dependence for shear gain, whereas dynamic theories do show dependency on frequency (3). The effect of negative hair-bundle stiffness on the shear gain is also simulated (see Discussion). The shearing motion between the TM and RL is calculated at the second row of OHCs, and the BM displacement is computed at its center. The ratio of these motions defines the shear gain. The shear gain for the first and third rows of OHCs is not significantly different from that of the second row.
Fig. 5.
Shear gain at the apex (Upper) and base (Lower) of the cochlea. The shear gain is defined as the ratio of shearing displacement of the TM and RL to the BM deflection. ○, Simulation with positive bundle stiffness of the OHCs;▵, simulation with negative bundle stiffness of the OHCs. Negative hair-bundle stiffness improves the shear gain at the cochlear apex, but it has a negligible effect on the shear gain at the cochlear base (data not shown).
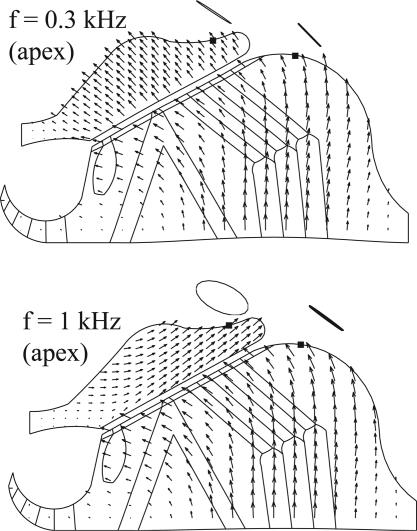
Fig. 6 shows the comparison of the detailed deformations within the OC and TM at the apex of cochlea, stimulated at 300 Hz and 1 kHz, respectively. We found a transition to an evident TM radial motion at ≈0.85 kHz; at >1.1 kHz, we could not obtain convergent solutions except at isolated points. At 300 Hz, the vector patterns resemble those obtained by the optical-flow technique (16, 17, 39), where the vector patterns (represented by the arrows in Fig. 6) have been described as a rotation around a point near the foot of the inner pillar cell. This pattern corresponds to the classical picture. At 1 kHz, however, the direction of the vectors on the TM changes dramatically to show an evident radial motion. Hemmert et al. (14). measured the trajectories of microspheres on the top of the TM, and Hensen cells at the apex of the guinea pig cochlea. The microspheres traced out closed paths or orbits, the shapes of which reveal the magnitude of motion in the radial and transverse directions. We simulate microsphere orbits by following points on the surface of the TM and Hensen cells. At >0.85 kHz, orbits of our simulated microspheres change from rectilinear to oval on the TM, similar to those reported by Hemmert et al. (14). At the apex, these calculated orbits are counterclockwise. Movie 1, which is published as supporting information on the PNAS web site, clearly shows the TM radial motion at 1 kHz in the apical region. The difference in arrow directions seen at 300 Hz and 1 kHz is particularly striking for a passive cochlea. The orientation of arrows is consistent with the lumped-parameter model (3) for a frequency regime spanning the parallel resonance formed by the stereocilia stiffness and TM mass. Below that resonance, the lumped-parameter model predicts a TM/RL radial motion amplitude ratio less than one, with a small phase lag. Slightly above that resonance, the amplitude ratio should be greater than one, with a large phase lag.
Fig. 6.
Detailed movements within the OC and TM at cochlea apex. The direction and size of the arrows denote the direction and relative amplitude, respectively, of OC and TM displacements. Stimulation frequencies are 300 Hz (Upper) and 1 kHz (Lower), respectively. Orbits are shown for two simulated microspheres.
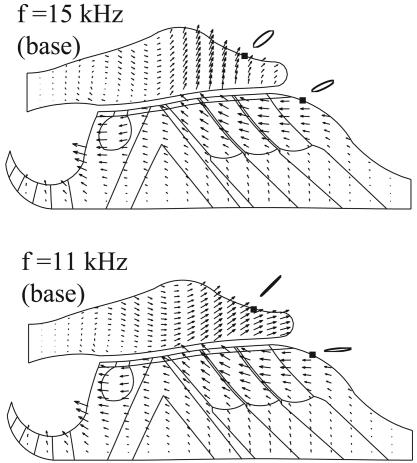
Fig. 7 shows the comparison of the detailed deformations within the OC and TM at the base of the cochlea, stimulated at 11 kHz and 15 kHz, respectively. We found a transition to an evident TM radial motion in the frequency range of 11–14 kHz; below 11 kHz, we could not obtain convergent solutions except at isolated points. Deformations within the OC are complex at the cochlear base. As the BM oscillates, the tunnel of Corti rotates around the foot plate of the inner pillar cell, inducing a relatively large radial movement of the IHC body. The RL is observed to have distinct motion patterns on either side of the top of the tunnel of Corti. The left part moves essentially in the radial direction, whereas the motion of the right portion contains both radial and transverse components. Orbits of simulated microspheres are distinctly different from those at the apex. At the base, the inclination of the long axis of the orbits is more radial. The simulated microsphere on the TM surface orbits clockwise, and that on the Hensen cell surface orbits counter-clockwise. Also note that TM vectors change significantly through the TM thickness at 15 kHz but not at 11 kHz. Again the orientation of arrows is consistent with the lumped-parameter model (3) for a frequency regime above the parallel resonance point. For that regime, the lumped-parameter model predicts that the TM/RL radial motion amplitude ratio should decrease to values smaller than one as frequency increases.
Fig. 7.
Detailed movements within the OC and TM at cochlea base. Stimulation frequencies are 15 kHz (Upper) and 11 kHz (Lower), respectively. Orbits are shown for two simulated microspheres.
Discussion
We can compare the calculated aspect ratios and long-axes orientations of our simulated microsphere orbits (Fig. 6) with values measured in figure 10 of ref. 14. Defining the aspect ratio as the ratio of short axis to long axis, our value of 0.50 should be compared with the largest value in figure 10 of ref. 14, which is 0.33. Hemmert et al. (14) mentioned, however, that even larger aspect ratios were seen. In addition, our calculated angle of the orbital long axis is 125° with respect to the RL, compared with the experimental value of 127°. The corresponding comparisons at the base are not yet possible because the experimental data do not exist. Nevertheless, the predictions at the base are noteworthy because they show that the phenomenon of TM radial motion persists in the model at higher frequency. Experiments show that radial TM resonance occurs ≈0.5 octaves (oct) below the BM resonance (13, 14). In our computations, we have some indications from the shear gain curve, Fig. 5, that the maximal TM radial motion occurs at ≈1 kHz at the apex and 10 kHz at the base. Although we cannot compute smooth curves for frequencies >1 kHz at the apex or <10 kHz at the base because of convergence difficulties, we do see reductions in the shear gain in these regions for isolated points. As we have already estimated from the damping factor β, the characteristic frequencies for the apical and basal sections are ≈1.8 kHz and ≈20 kHz, respectively. Although they are not yet definitive, these estimates suggest that a radial TM resonance occurs at a frequency less than the BM resonance (0.85 oct for the apical section and 1 oct for the basal section). This trend is consistent with experiments (13, 14) and with the prediction from the lumped-parameter model seen in figure 5 ref. 1.
How Is the Model Calibrated? Because our knowledge of the elastic moduli of the different elements of the CP is incomplete, we rely on a dynamic-calibration method that compares computed axial wavelength with measured values. To get convergent solutions, we need to use a different E-map for the apical and basal regions of the cochlea, suggesting an axial variation in the elastic moduli of components of the CP along the cochlear duct. This variation invites further experimental confirmation.
Role of TM Mass and Elasticity. Keeping other parameters fixed, changing the density of the TM from 1.0 to 1.2 g/cm3 has no effect on the shear gain curve at the apex (Fig. 5), but it shifts it to the left toward lower frequencies at the base. Similar percentage increases in E values for the TM shift the curve to the right toward higher frequencies at both the base and apex. These shifts indicate that TM elasticity plays a role in stereocilia bending at all frequencies, whereas TM mass is not important at low frequencies.
Role of OHC Bundle Stiffness. In our model, the elastic coupling between the TM and RL is handled by means of a localized shear stress induced on their boundaries (21). Increasing bundle stiffness increases the local shear stress. Shear gain is not very sensitive to the bundle stiffness at the base, but it is sensitive at the apex. Negative bundle stiffness, demonstrated in the bullfrog sacculus at low frequency (23), but not yet in mammals, has been suggested as a possible amplifier mechanism. In our model, negative bundle stiffness improves shear gain at the apex but not at the base. This location dependence suggests that the negative bundle stiffness is not likely to be an amplifier mechanism at high frequency.
Bending of the Stereocilia of IHCs. Although we do not attempt here to calculate the bending of IHC stereocilia, our model suggests that the radial motions of the TM and IHC body are in antiphase (Figs. 6 and 7). Consequently, the IHC bundle deflections, which are driven by the Couette (shear) flow, should be enhanced.
Supplementary Material
Acknowledgments
We thank E. K. Dimitriadis and K. Iwasa for their helpful comments.
Abbreviations: BM, basilar membrane; CP, cochlear partition; IHC, inner hair cell; OC, organ of Corti; OHC, outer hair cell; RL, reticular lamina; TM, tectorial membrane.
References
- 1.Zwislocki, J. J. (1986) Hear. Res. 22, 155-169. [DOI] [PubMed] [Google Scholar]
- 2.Dallos, P., Popper, A. N. & Fay, R. R. (eds.). (1996) The Cochlea (Springer, New York).
- 3.Zwislocki, J. J. (2002) Auditory Sound Transmission, an Autobiographical Perspective (L. Erlbaum, Mahwah, NJ).
- 4.Zwislocki, J. J. & Kletsky, E. J. (1979) Science 204, 639-641. [DOI] [PubMed] [Google Scholar]
- 5.Zwislocki, J. J. (1980) J. Acoust. Soc. Am. 67, 1679-1685. [DOI] [PubMed] [Google Scholar]
- 6.Allen, J. B. (1980) J. Acoust. Soc. Am. 68, 1660-1670. [DOI] [PubMed] [Google Scholar]
- 7.Neely, S. T. & Kim, D. O. (1986) J. Acoust. Soc. Am. 79, 1472-1480. [DOI] [PubMed] [Google Scholar]
- 8.Mammano, F. & Nobili, R. (1993) J. Acoust. Soc. Am. 93, 3320-3332. [DOI] [PubMed] [Google Scholar]
- 9.Allen, J. B. & Neely, S. T. (1992) Phys. Today 7, 40-47. [Google Scholar]
- 10.Allen, J. B. & Fahey, P. F. (1993) J. Acoust. Soc. Am. 94, 809-816. [DOI] [PubMed] [Google Scholar]
- 11.Brown A. M., Gaskill, S. A. & Willliams, D. M. (1992) Proc. R. Soc. London Ser. B 250, 29-34. [DOI] [PubMed] [Google Scholar]
- 12.Zwislocki, J. J. & Cefaratti, L. K. (1989) Hear. Res. 42, 211-227. [DOI] [PubMed] [Google Scholar]
- 13.Gummer, A. W., Hemmert, W. & Zenner, H. (1996) Proc. Natl. Acad. Sci. USA, 93, 8727-8732. [DOI] [PMC free article] [PubMed] [Google Scholar]
- 14.Hemmert, W., Zenner H. & Gummer A. W. (2000) Biophys. J. 78, 2285-2297. [DOI] [PMC free article] [PubMed] [Google Scholar]
- 15.Ulfendahl, M., Khanna, S. M. & Heneghan C. (1995) NeuroReport 6, 1157-1160. [DOI] [PubMed] [Google Scholar]
- 16.Richter, C. P. & Dallos, P. (2003) in Biophysics of the Cochlea, from Molecules to Models, ed. Gummer, A. W. (World Scientific, Singapore), pp. 278-284.
- 17.Cai, H., Richter, C. P. & Chadwick, R. S. (2003) Biophys. J. 85, 1929-1937. [DOI] [PMC free article] [PubMed] [Google Scholar]
- 18.Cooper, N. P. (1999) in Recent Developments in Auditory Mechanics, eds. Wada, H., Takasaka, T., Ikeda, K., Ohyama, K. & Koike, T. (World Scientific, Singapore), pp. 109-115.
- 19.Nilsen, K. E. & Russell, I. J. (1999) Nat. Neurosci. 2, 642-648. [DOI] [PubMed] [Google Scholar]
- 20.Robles, L. & Ruggero, M. A. (2001) Physiol. Rev. 81, 1305-1351. [DOI] [PMC free article] [PubMed] [Google Scholar]
- 21.Cai, H. & Chadwick R. S. (2003) SIAM J. Appl. Math. 63, 1105-1120. [Google Scholar]
- 22.Strelioff, D. & Flock, A. (1984) Hear. Res. 15, 19-28. [DOI] [PubMed] [Google Scholar]
- 23.Martin, P. Mehta, A. D. & Hudspeth A. J. (2000) Proc. Natl. Acad. Sci. USA 97, 12026-12031. [DOI] [PMC free article] [PubMed] [Google Scholar]
- 24.Steele, C. R. (1999) J. Otorhinolaryngol. Relat. Spec. 61, 238-251. [DOI] [PubMed] [Google Scholar]
- 25.Salt, A. N., Henson, M. M., Gewalt. S. L. & Keating, A. W. (1995) Hear. Res. 88, 79-86. [DOI] [PubMed] [Google Scholar]
- 26.Kelly, J. P. (1989) Acta Otolaryngol. Suppl. 467, 113-122. [DOI] [PubMed] [Google Scholar]
- 27.Echteler, S. M., Fay, S. R. & Popper, A. N. (1994) in Comparative Hearing: Mammals, eds. Fay, P. R. & Popper A. N. (Springer, New York), pp. 134-171.
- 28.Iwasa, K. H. & Adachi, M. (1997) Biophys. J. 73, 546-555. [DOI] [PMC free article] [PubMed] [Google Scholar]
- 29.Slepecky N. B. (1996) in The Cochlea, eds. Dallos, P., Popper, A. N. & Fay R. R. (Springer, New York), pp. 44-129.
- 30.Howard, J. (2001) Mechanics of Motor Proteins and the Cytoskeleton (Sinauer, Synderland, MA).
- 31.Gummer, A. W., Johnstone, B. M. & Armstrong N. J. (1981) J. Acoust. Soc. Am. 70, 1298-1309. [Google Scholar]
- 32.Ren, T. Y. (2002) Proc. Natl. Acad. Sci. USA 99, 17101-17106. [DOI] [PMC free article] [PubMed] [Google Scholar]
- 33.Russell, I. J. & Nilsen, K. E. (1997) Proc. Natl. Acad. Sci. USA 94, 2660-2664. [DOI] [PMC free article] [PubMed] [Google Scholar]
- 34.Kohllöffel, L. (1972) Acustica 27, 66-81. [Google Scholar]
- 35.Cooper, N. P. & Rhode, W. S. (1996) Aud. Neurosci. 2, 289-299. [Google Scholar]
- 36.Richter, C. P, Evans, B. n., Edge, R. & Dallos, P. (1998) J. Neurophys. 79, 2255-2264. [DOI] [PubMed] [Google Scholar]
- 37.Ren, T. Y., Zou, Y., Zhang, J. F., Nuttall, A. l., Povsov, E. & Mathews, S. (2003) in Biophysics of the Cochlea: from Molecule to Models, ed. Gummer, A. W. (World Scientific, Singapore), pp. 211-217.
- 38.Dallos, P. (2003) in Biophysics of the Cochlea: from Molecule to Models, ed. Gummer, A. W. (World Scientific, Singapore), pp. 97-109.
- 39.Rhode, W. S. & Geisler, C. D. (1967) J. Acoust. Soc. Am. 42, 185-190. [DOI] [PubMed] [Google Scholar]
- 40.Fridberger A. & Monvel J. B. (2003) Nat. Neurosci. 6, 1-2. [DOI] [PubMed] [Google Scholar]
Associated Data
This section collects any data citations, data availability statements, or supplementary materials included in this article.


