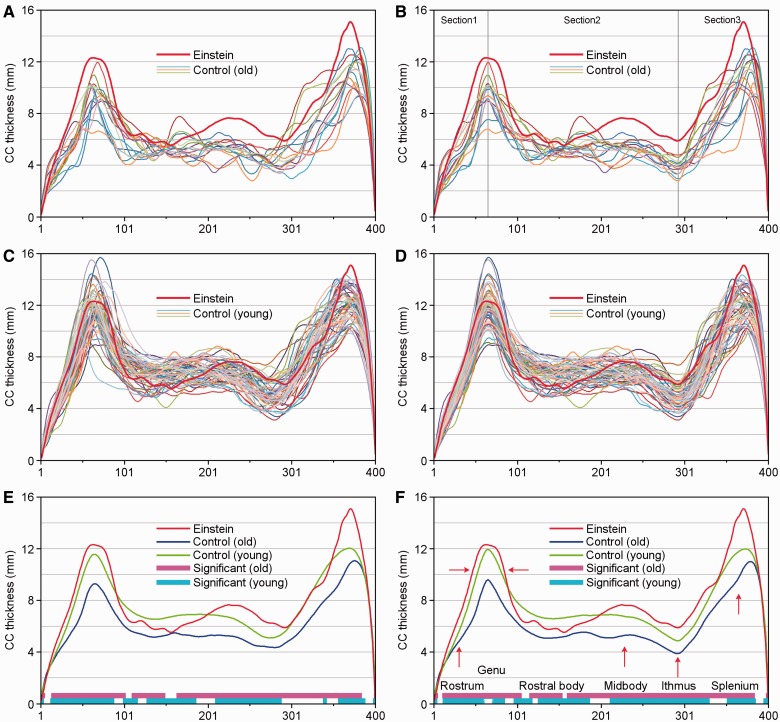
Figure 3.
The corpus callosum (CC) thickness plots, with left to right sequentially representing genu to splenium (as labelled in F). (A) Measured thickness plots of Einstein (red thick line) and elderly controls (coloured thin lines). (B) Each control thickness plot sectioned into three segments (at the maximum thickness in genu and minimum thickness in isthmus) and registered to Einstein’s callosal thickness plot. (C) Measured thickness plots of Einstein (red thick line) and young controls (coloured thin lines). (D) The callosal thickness plots of the young group were sectioned and registered to Einstein’s corpus callosum thickness plot. (E) Measured average corpus callosum thickness plots of Einstein (red), the elderly control group (blue) and the young control group (green), the purple (old controls) and cyan (young controls) spans indicate that these regions differ significantly (P < 0.05, FDR corrected) between Einstein and the two age control groups. (F) The sectioned and registered average corpus callosum thickness plots, Einstein (red), the elderly control group (blue) and the young control group (green); labels after Witelson (1989). The meaning of purple and cyan spans are the same as (E). Red arrows indicate that Einstein’s callosal thickness is 10% thicker than the mean for the young group, especially in the splenium, whereas the width of Einstein’s corpus callosum is noticeably larger in the genu.

