Abstract
A major issue of in the treatment of diabetes is the risk of hypoglycemia. Hypoglycemia is detected both centrally and peripherally in the porto-hepatic area. The portal locus for hypoglycemic detection was originally described using the “local irrigation of the liver” approach in a canine model. Further work using portal vein denervation (DEN) in a rodent model characterized portal hypoglycemic sensing in detail. However, recent controversy about the relevance of rodent findings to large animals and humans prompted us to investigate the effect of portal DEN on the hypoglycemic response in the canine, a species with multiple similarities to human glucose homeostasis. Hypoglycemic hyperinsulinemic clamps were performed in male canines, before (PRE) and after (POST) portal vein DEN or sham surgery (CON, control). Insulin (30 pmol/kg·min) and glucose (variable) were infused to slowly decrease systemic glycemia to 50 mg/dL over 160 minutes. The average plasma glucose during clamp steady state was: 2.9 ± 0.1 mmol DEN-PRE, 2.9 ± 0.2 mmol DEN-POST, 2.9 ± 0.1 mmol CON-PRE, and 2.8 ± 0.0 mmol CON-POST. There were no significant differences in plasma insulin between DEN and CON, PRE and POST experiments. The epinephrine response to hypoglycemia was reduced by 62% in DEN but not in CON. Steady-state cortisol was 46% lower after DEN but not after CON. Our study shows, in a large animal model, that surgical disconnection of the portal vein from the afferent pathway of the hypoglycemic counterregulatory circuitry results in a substantial suppression of the epinephrine response and a significant impact on cortisol response. These findings directly demonstrate an essential role for the portal vein in sensing hypoglycemia and relating glycemic information to the central nervous system.
Hyperinsulinemic hypoglycemia is a serious complication in the management of type 1 and type 2 diabetes. Tight glycemic control, as recommended to reduce vascular complications of diabetes, increases the risk of hypoglycemia, which in turn has negative implications on the mortality, morbidity, and quality of life of diabetic patients (1). A decrease in blood glucose below the physiological range results in a sequence of counterregulatory responses, initiated by activation of glucose sensors throughout the body (2, 3). A large amount of research has been devoted to understanding where hypoglycemia is sensed, what the contribution of these sensors to overall hypoglycemic response is and under what circumstances they are activated. It is now known that areas in the brain (hypothalamus and hindbrain) and outside the brain, such as the carotid bodies and the hepato-portal area, are involved in glucose sensing (3). It is difficult to study brain and hepato-portal sensing in humans, so very often animal models were used to better understand the pathophysiology of hypoglycemic counterregulation.
The role of hepatic portal vein sensing in hypoglycemic counterregulation was originally described by Donovan et al (4) in a large animal model using the “local irrigation” technique. They showed that inducing systemic hypoglycemia by insulin infusion, but maintaining the porto-hepatic area at euglycemia, results in a blunting of catecholamine response. However, much of the subsequent work on portal vein hypoglycemic sensing was done in rodent models. Donovan and coworkers (5–8), in a series of elegant studies, characterized the portal vein-mediated counterregulatory response to hypoglycemia and provided direct evidence of portal vein sensors to hypoglycemia via portal vein denervation (DEN) in rats. In contrast to the rodent work, Jackson et al (9) reported in the dog that afferent signaling from the liver and hepato-portal region is not required for the normal counterregulatory response to insulin-induced hypoglycemia. Recently, the relevance of rodent portal hypoglycemic sensing to humans has also been questioned. Smith et al (10) showed that administration of oral glucose during a hypoglycemic clamp reduced the early epinephrine response to hypoglycemia. In contrast, Rossetti et al (11) found that in nondiabetic patients, hyperinsulinemic hypoglycemic counterregulation was not affected by normalization of portal glucose via an oral glucose load, whereas Heptulla et al (12) found that oral glucose augmented the counterregulatory hormone response during insulin-induced hypoglycemia. Thus, it remains controversial whether the role of portal sensing of hypoglycemia plays an essential role in hypoglycemic counterregulation in larger animals or in man. Therefore, the aim of the current study was to assess the importance of portal vein hypoglycemic sensing to the counterregulatory response in a canine model via portal DEN and to investigate whether hypoglycemic counterregulation mechanisms other than the catecholamine response are affected by this intervention.
Materials and Methods
Animals
Experiments were performed in male mongrel dogs (1 y old; body weight 27.7 ± 0.7 kg), in the conscious relaxed state (n = 17), housed under controlled kennel conditions in the Cedars Sinai Medical Center vivarium, and fed once daily with a standard diet (27% protein, 32% fat, and 41% carbohydrate; Labdiet; PMI Nutrition International). The animals were used for experiments only if judged to be in good health as determined by body temperature, hematocrit, regularity of food intake, and direct observation. All surgical and experimental procedures were approved by the Cedars Sinai Medical Center Institutional Animal Care and Use Committee.
Experimental design
Experiments were all performed in the morning, after 12–16 hours of fasting. In each animal, the metabolic assessment was performed before and at least 1 week after portal DEN or sham surgery. At the end of the experimental period, the animals were euthanized, and portal veins were harvested for assessment of catecholamine content by high performance liquid chromatography (HPLC) and of tyrosine hydroxylase by immunohistochemistry.
Surgical procedures
Portal vein DEN and sham DEN were performed under general anesthesia induced with propofol and maintained with isoflurane or sevoflurane. For portal vein DEN (n = 11), after a midline incision, the hepatic portal vein was exposed. A myelin-specific dye (toluidine blue 1%) was used to visualize nerve bundles along the portal vein, hepatic artery, common bile duct, and liver hilum. Only the visible nerves along the portal vein were cut, and the vein was painted with a solution of phenol-alcohol (10% phenol in alcohol vol/vol). Special care was taken to preserve the nerves running along the hepatic artery and its branches, the hepatic hilum nerves where nerve fibers enter the liver, the hepatic branch of the vagus nerve, and innervation of the common bile duct. Specifically, the portal vein was denervated distally (1–2 cm) from the liver hilum. It has been shown that, in rat, the portal vein glucose sensor is situated 1–3 cm from the liver hilum (5, 13), so this distance is likely to be even longer in larger mammals. The abdomen was then sutured closed. For sham surgery (n = 6), after a midline incision, the hepatic portal vein was exposed and painted with saline. The abdomen was then sutured closed.
Hypoglycemic clamps
Intracatheters were acutely placed in the cephalic or saphenous vein for infusion of insulin and glucose and for blood sampling. After basal sampling (−20–0 min) at t = 0, insulin was infused at 30 pmol/kg·min to slowly decrease glycemia to 3 mmol/L. Glucose (50% dextrose, 454 mg/mL; B Braun) was infused at a variable rate. The glucose infusion rate (Ginf) was adjusted every 10 minutes to achieve approximately 0.55 mmol/L reductions in blood glucose over 40-minute periods. Thus peripheral glucose decreased stepwise to a nadir that was reached between 120 and 160 minutes (steady state). Blood samples were taken every 10 minutes for measurements of glucose, insulin, lactate, and cortisol and every 30 minutes for glucagon. Samples for measurement of catecholamines were taken at basal and at steady state. Data for cortisol and for catecholamines were not available for one hypoglycemic clamp.
Blood samples and assay measurements
Samples for determination of glucose, insulin, and cortisol were collected into tubes coated with LiF and heparin containing EDTA. Samples for determination of glucagon were collect in tubes coated with lithium fluoride and containing EDTA and Trasylol. Samples for determination of catecholamines were collected in tubes containing EDTA/sodium metabisulfite and flash frozen after plasma separation. Plasma glucose concentrations were determined using a YSI 2300 autoanalyzer (Yellow Springs Instruments). Insulin was measured using a human ELISA kit (Millipore) adapted in our laboratory for dog plasma. Plasma glucagon was measured using RIA (Millipore). Cortisol was measured using RIA (Siemens Healthcare Diagnostics). Plasma catecholamines were measured using ELISA (Rocky Mountain Diagnostics).
Portal vein catecholamine content by HPLC
Catecholamine content of organs and tissues has been used in various studies as an indicator of sympathetic DEN (9, 14, 15). We assessed DEN of the portal vein via measuring catecholamine content of portal vein by HPLC (n = 3 denervated, 2 nondenervated animals). Tissue catecholamines were isolated by binding to activated alumina and eluted with perchloric acid (1:1 or 1:4 wt/vol) and centrifuged for 15 minutes at 4°C (14 000 rpm); the supernatant was filtered and the filtrate directly injected to the HPLC (pg/g).
Tyrosine hydroxylase immunohistochemistry
Tyrosine hydroxylase immunohistochemistry was performed in portal veins from 7 animals (4 denervated and 3 nondenervated). Briefly, the portal tissue was washed with 0.015M PBS and dehydrated with a series of increasing concentrations of ethanol. After dehydration, the tissue was incubated in xylene (2 × 60 min) and then infiltrated with paraffin, a paraplast-embedding media (Sigma Chemical), at 60°C overnight and then embedded with fresh paraffin. Each pad was sliced across its extent at 5 μm using a rotary microtome (American Optical Instrument). Sections were placed in a tissue-floating water bath (37°C) immediately after being sliced and were mounted on glass slides. Slides were left on a slide-warming table (37°C) to air-dry overnight. Slides were placed in a series of xylene to remove paraffin, then a series of ethanol. After a wash in tap water, the slides were placed in 3% hydrogen peroxide/methanol solution for 10 minutes. After a wash in distilled water, the slides were incubated for 25 minutes in citrate buffer (pH 6) at 95°C using a vegetable steamer. The slides were brought to room temperature, rinsed in PBS containing 0.05% Tween 20 (PBST), and incubated with antityrosine hydroxylase (AB152; Millipore) at the dilution of 1:100 at 4°C overnight. The slides were rinsed with PBST and incubated with Dako EnVision+ System-HRP Labelled Polymer Anti-Rabbit (K4003; Dako) at room temperature for 30 minutes. After a rinse with PBST, the slides were incubated with 3,3′-diaminobenzidine for visualization. Subsequently, the slides were washed in tap water, counterstained with Harris' hematoxylin, dehydrated in ethanol, and mounted with media.
Calculations
Tyrosine hydroxylase quantification scanning and analyses were performed through the Translational Pathology Core Laboratory, Department of Pathology and Laboratory Medicine, David Geffen School of Medicine at University of California Los Angeles. Images were acquired and analyzed using Ariol SL-50 (Applied Imaging Corp). The Ariol scanner is based on an Olympus BX61 microscope with motorized stage and autofocus capabilities, equipped with a black and white video camera (Jai CVM2CL). Slides were scanned at ×20 objective magnification with the 4′,6-diamidino-2-phenylindole and fluorescein isothiocyanate filters. Optimal exposure times were determined before automated scanning. After scanning, threshold levels of the individual signals were optimized before final analysis. Analytical readouts of user-defined areas included: area of signal (area of signal above the signal threshold), and total area analyzed was calculated by the software.
Statistical analysis
Results are presented as means ± SE unless indicated otherwise. Paired t tests with Bonferroni correction were used for time-point comparisons before and after DEN or sham. Repeated measurements ANOVA was used for timeline comparisons. Area under the curve (AUC) 0–180 was calculated using the trapezoid rule. All differences were considered statistically significant when P < .05.
Results
Verification of hepatic portal vein DEN
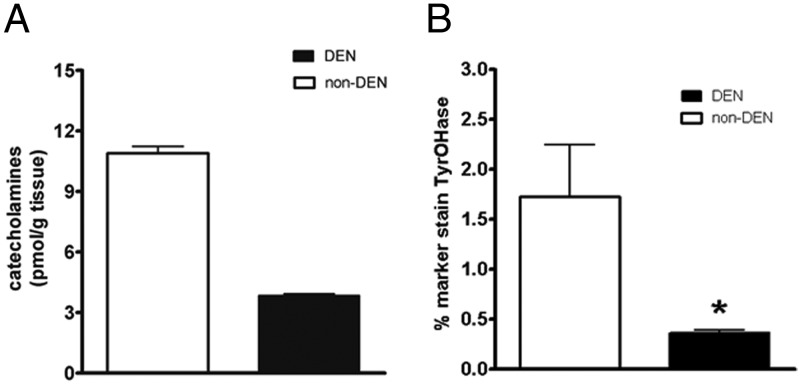
Hepatic portal DEN was measured by tyrosine hydroxylase immunohistochemistry and by portal vein catecholamine content in denervated vs nondenervated animals. Tyrosine hydroxylase staining, an indicator of DEN, showed a 79% decrease in denervated animals compared with nondenervated (Figure 1B). Portal vein catecholamine was performed in a subset of samples (2 nondenervated and 3 denervated) and showed a 47% content reduction in denervated animals.
Figure 1.
Hepatic portal vein total catecholamine content by HPLC (A) and tyrosine hydroxylase immunohistochemistry percentage staining (B) in denervated (□) or nondenervated (■) animals.
Counterregulatory response to hypoglycemia: hypoglycemic clamps
To test the counterregulatory response to hypoglycemia, hypoglycemic clamps were performed in denervated and sham, before and after surgery.
Glucose, insulin, lactate, and Ginf
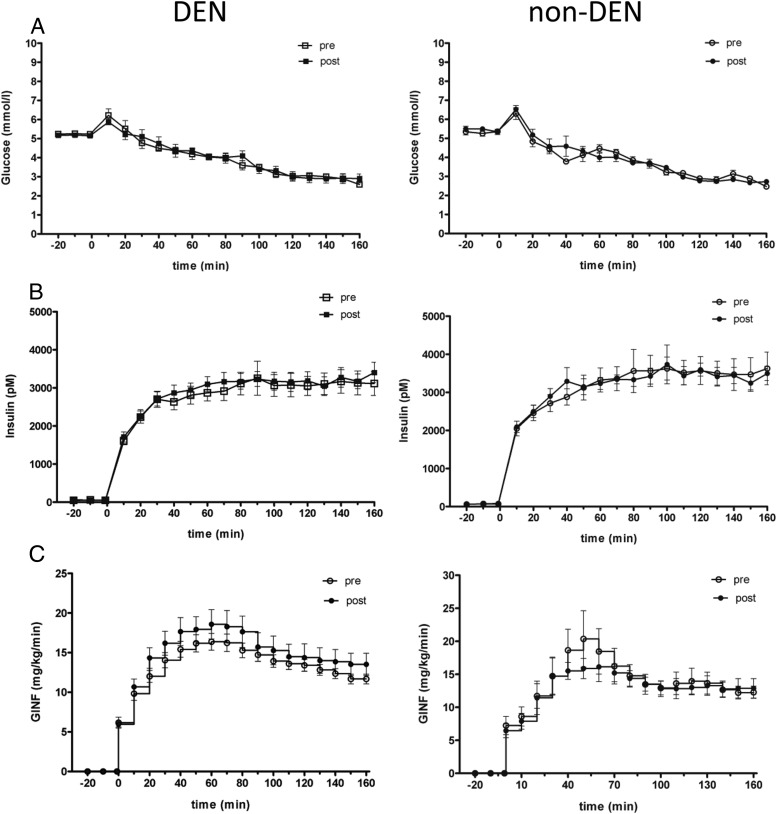
There was no significant difference in baseline glucose or insulin between the denervated group and the control group or within groups before and after DEN or sham (Figure 2).
Figure 2.
Plasma levels of glucose (A), insulin (B), and Ginf (C) before (open symbols) and after (closed symbols) DEN (left panel) or sham (right panel).
Insulin infusion during the hypoglycemic clamp resulted in an increase in plasma insulin (to ∼3000pM) and a slow decrease in plasma glucose, to a nadir of approximately 3 mmol/L, in the denervated and in the control group. There was no difference in glycemia at steady state (120–160 min) before and after DEN (2.9 ± 0.1 mmol/L vs 2.9 ± 0.2 mmol/L, P = .78) or before and after sham (2.9 ± 0.1 mmol/L vs 2.8 ± 0.0 mmol/L, P = .27) (Figure 2A). There was no significant difference in plasma insulin before and after DEN (AUC0–180: before 444 888 ± 35 077 pmol/L·min, AUC after 460 561 ± 27 370 pmol/L·min; P = .46), before and after sham DEN (AUC before 500 983 ± 42 224 pmol/L·min, AUC after 502 889 ± 25 854 pmol/L·min; P = .94), or between the portally denervated group and the sham DEN group (ANOVA, P = .63) (Figure 2B).
Ginf necessary to maintain hypoglycemia tended to be higher after DEN, without reaching significance (AUC before 2170 ± 101 mg/kg, AUC after 2425 ± 217 mg/kg; P = .12), but it was not significantly higher in sham (AUC before 2261 ± 272 mg/kg, AUC after 2122 ± 208 mg/kg; P = .9) (Figure 2C). Plasma lactate concentration was not different between groups or before and after DEN. AUC0–180, DEN: before 1455 ± 108 mg/dL·min, after 1356 ± 90 mg/dL·min, P = .25; sham: before 1349 ± 139 mg/dL·min, after 1266 ± 129 mg/dL·min, P = .34.
Plasma catecholamines
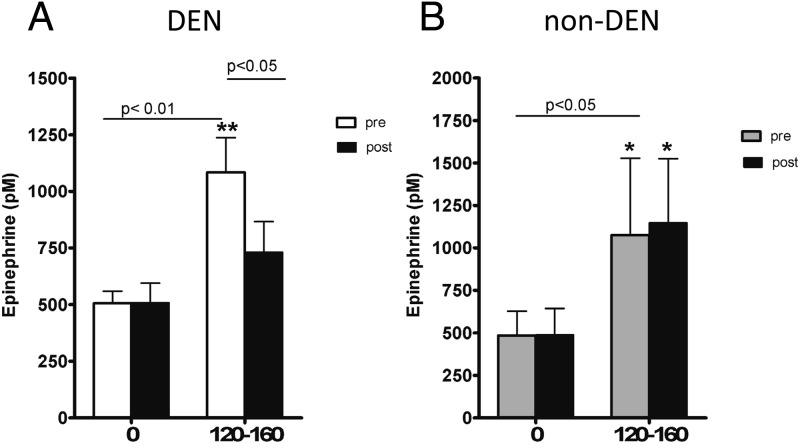
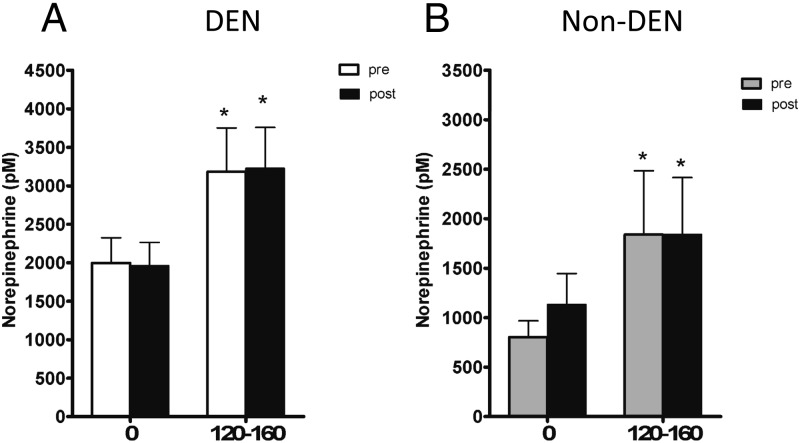
Before DEN, hypoglycemia resulted in significant increases in plasma epinephrine and norepinephrine. Epinephrine concentration doubled at steady state (120–160 min), from 528 ± 66 basal to 1084 ± 153 pmol/L, P = .001, in the denervated group, and from 444 ± 143 to 1075 ± 433 pmol/L, P < .05, in the sham group; norepinephrine rose from 1997 ± 327 to 3184 ± 567 pmol/L, P < .01, in the denervated group, and from 804 ± 163 to1840 ± 645 pmol/L, P < .05, in the sham group. After surgery, the epinephrine response to hypoglycemia was dramatically reduced in portally denervated animals (531 ± 76 to 679 ± 75 pmol/L, P = .19) but not reduced in sham (488 ± 156 to 1147 ± 375 pmol/L, P < .05) (Figure 3). Interestingly, we did not measure a decrease in norepinephrine response to hypoglycemia after DEN (1812 ± 304 to 3226 ± 531 pmol/L, P < .01) (Figure 4). Thus, intact portal vein nerves are essential for a normal epinephrine response to hypoglycemia in the conscious dog.
Figure 3.
Plasma epinephrine at basal (0) and steady state (120–160) before (open bar) and after (closed bar) DEN (A) or sham (B).
Figure 4.
Plasma norepinephrine at basal (0) and steady state (120–160) before (open bar) and after (closed bar) DEN (A) or sham (B).
Cortisol
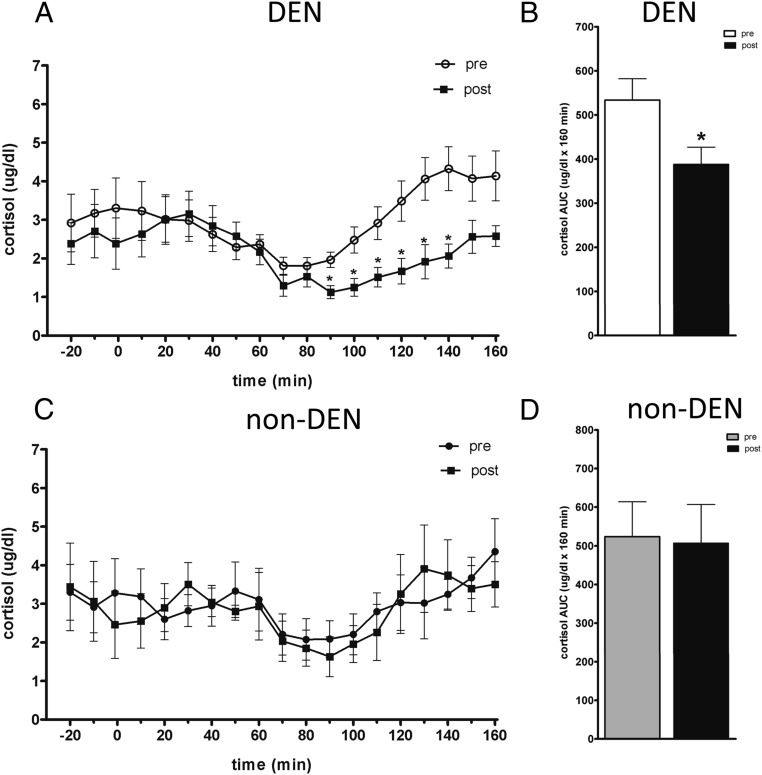
There was no significant difference in fasting cortisol before and after DEN (before 2.9 ± 0.7 ng/L, after 2.5 ± 0.6 ng/L; P = .66) or before and after sham (before 3.3 ± 0.8 ng/L, after 3.0 ± 0.8 ng/L; P = .44). However, at steady state during the hypoglycemic clamp, cortisol was 45% lower after DEN (4.0 ± 0.5 ng/L before vs 2.2 ± 0.3 ng/L after DEN, P < .001). In contrast, there was no difference between cortisol before (3.5 ± 0.9 ng/L) and after (3.6 ± 0.7 ng/L, P = .28) sham (Figure 5). It appears that, like the sympathetic response, intact portal vein receptors are essential for a full hypothalamo-pituitary axis access response to hypoglycemia.
Figure 5.
Plasma concentration of cortisol before and after DEN (A) or sham (C). Cortisol AUC before and after DEN (B) or sham (D).
Glucagon
Glucagon did not significantly increase from basal during the hypoglycemic clamps in denervated (DEN: before 41 ± 9 to 34 ± 6 ng/L, P = .12; after 44 ± 6 to 42 ± 7 ng/L, P = .16) or sham-operated animals (before 46 ± 4 to 43 ± 3 ng/L, P = .58; after 47 ± 7 to 38 ± 5 ng/L, P = .09). There was no difference in glucagon before and after DEN, or before and after sham.
Discussion
Our study brings direct proof, via portal denvervation, of the essential role of the hepatic portal vein in hypoglycemic counterregulation in a nonrodent model, the canine. Previous studies in the canine that explored the portal involvement in hyperinsulinemic hypoglycemia used the local irrigation technique, in which hypoglycemia is induced peripherally via an insulin infusion, and concomitantly, glucose is infused into the portal vein to expose the porto-hepatic area to euglycemia (16–18). This technique does not discriminate between liver and portal vein sensing and does not rule out the former as the exclusive site of porto-hepatic hypoglycemia sensing. To the contrary, our findings, in which surgical disconnection of the portal vein from the afferent pathway of the hypoglycemic counterregulatory circuitry resulted in a very substantial suppression of the epinephrine response, demonstrates an essential role for the portal vein in sensing hypoglycemia (when hypoglycemia is slowly induced) and relating glycemic information to the central nervous system (CNS).
The essentiality of receptors in the portal vein for the sympathoadrenal response to hypoglycemia has been controversial in all but rodent models. In dogs, Jackson et al (9, 19) found that hepatic and portal vein denervation (alone or combined with vagal cooling) in dogs had no effect on the counteregulatory response to insulin-induced hypoglycemia. In a study in nondiabetic humans, Rossetti et al (11) showed that hyperinsulinemic hypoglycemic counterregulation was not affected by administration of an oral glucose load. Moreover, other findings from rodents involving hepato-portal area sensing and its role in glycemic control were not translatable to humans. Infusion of glucose into the portal vein at rates equal to endogenous glucose production resulted in peripheral hypoglycemia in mice but not in dogs (20) or humans (21). These contrasting results suggest that there might be fundamental differences in hepato-portal sensing and glucoregulation between rodents and large mammals or humans. It is known that such interspecies differences exist with respect to glucose homeostasis. For example, a prolonged fast impairs insulin-stimulated glucose use in humans but enhances it in normal mice (22). These gluco-homeostatic differences could extend to hypoglycemic sensing and relay of signals to and from the CNS. To respond to this criticism, Saberi et al (8) suggested that differences in methodology might be responsible for the different results. One of these differences is the rate of glycemic fall. Indeed, when hypoglycemia was induced slowly (80 min to reach 2.5 mmol/L), the catecholamine response was blunted in the capsaicin-denervated animals, whereas when hypoglycemia was induced rapidly (20 min to reach 2.5 mmol/L), there was no impact on counterregulation. They proposed that the relative contribution of the brain vs the hepato-portal sensors in hypoglycemia varies with the rate of glycemic fall: when the fall in glucose is slow, such as most clinical situations, the porto-hepatic area is essential, whereas during more extreme situations, when glucose levels drop rapidly and dramatically, CNS sensing is activated (8). In the canine studies of Jackson et al (9, 19), the rate of glycemic drop was rapid (30 min to reach 2.5 mmol/L), which could explain why they did not find a role for hepato-portal denervation in hypoglycemic counterregulation. In our study, we created a slow pattern of glucose drop, similar to that employed by Saberi et al (8) (120 min to reach 2.5–3 mmol/L). Under these conditions, we indeed obtained a significant 73% decrease in the epinephrine response, supporting the role of portal sensors as primary responsible for initiation of a counterregulatory epinephrine response.
We did not find a significant decrease in the norepinephrine response to hypoglycemia. Unlike the epinephrine response, which is reliably decreased when portal sensing of hypoglycemia is eliminated, a significant suppression of norepinephrine is an inconsistent finding (17, 23). The lack of a detectable norepinephrine decrease after denervation in our study could suggest a dissociated catecholamine response, depending on the source: adrenal medulla vs nonadrenal (such as muscle sympathetic nerve activity). Indeed, it has been shown that type 1 diabetic subjects have diminished muscle sympathetic nerve activity but normal responses to hypoglycemia, indicating that epinephrine and norepinephrine might represent independently mediated responses (24).
The pattern of the counterregulatory response observed in the current study does not respect the traditional hierarchy of hypoglycemia response. Under physiological conditions, the first step is an inhibition of insulin release and an increase in glucagon secretion, followed by changes in epinephrine and norepinephrine, and if the hypoglycemia persists, cortisol and GH (3). In our study, glucagon was not changed from basal and was not different with or without denervartion. This finding is similar to other studies, in which a hyperinsulinemic hypoglycemic clamp in denervated or sham-operated animals failed to elicit a glucagon response. Jackson et al (9) found no significant differences in glucagon levels during the clamp in liver-denervated animals; Donovan et al (17) found a small increase in glucagon only during the final part of the clamp (240–260 min). In both studies, the plasma insulin levels were significantly lower than ours (1300–1800 pmol/L vs 3000 pmol/L). As suggested by earlier studies (17), it is very likely that the presence of hyperinsulinemia inhibited glucagon release and that this signal to the α-cells dominates over the hypoglycemia signals. Davis et al (25) showed that exposure to hyperinsulinemia in the presence of euglycemia for 30 minutes before hypoglycemia completely eliminated the subsequent glucagon response. In addition, the study of Donovan et al (17), in which changes in glucagon were found, used the local irrigation technique instead of portal/liver denervation. It is not known whether an intact vs denervated liver/portal vein plays a role in glucagon regulation.
An interesting finding in our study is represented by the cortisol changes in the denervated group. Basal cortisol was significantly suppressed in response to glucose infusion, in the euglycemic period. With hypoglycemia, cortisol started a slow rise, and by the end of the clamp, it reached baseline or slightly higher levels. However, in the denervated group, the cortisol stayed at lower levels significantly longer, suggesting that denervation affected the glycemia-dependent cortisol release. Thus, it is possible that the portal signal-mediated loop involves in the efferent part not only the medullary adrenal gland but also the cortex and possibly the hypothalamo-pituitary axis. Preliminary studies in which ACTH was measured support the involvement of the hypothalamo-pituitary axis in the counterregulatory response mediated by portal vein receptors (Ionut, V., unpublished observation).
Based on the lack of a full epinephrine counterregulatory response to hypoglycemia after denervation, we would have expected the Ginf in these experiments to be significantly higher, in order to supply glucose for maintaining the same glycemic levels as before denervation. In this context, the fact that the Ginf is not significantly higher is intriguing. However, a lack of change in Ginf was found in other studies investigating the counterregulatory response to hypoglycemia as well. Although Saberi et al (8) found in denervated rats a significant increase in Ginf during a hypoglycemic clamp, the same group did not report a significant increase in Ginf (P = .2) in a similar study in rats (7) or in a study using canines (17). It is possible that, under our experimental circumstances, the epinephrine contribution to the overall counterregulatory response is rather small, precluding a significant effect on Ginf. Another possibility is that we did not have enough power to detect significance, because the study was powered for the catecholamine response. Indeed, the Ginf tended to be higher after denervation (P = .12) without reaching significance (in contrast, in sham tends to be lower).
Previous studies have not elucidated whether portal vein receptors are essential for full counterregulatory response to hypoglycemia in large animals or in man. This study shows clearly the critical role played by receptors in the portal vein per se in hypoglycemic counterregulation. Whether this putative mechanism is dysfunctional in states of metabolic disease remains to be elucidated.
Acknowledgments
We thank Dr Igor Rebrin at the University of Southern California for measuring catecholamines by HPLC and Dr Clara Magyar at UCLA for her assistance with quantification of tyrosine hydroxylase staining.
This work was supported by National Institutes of Health (NIH)/National Institute of Diabetes and Digestive and Kidney Diseases (NIDDK) Grants R37DK027619 and 5R01DK029867 (to R.N.B.).
Disclosure Summary: The authors have nothing to disclose.
Footnotes
- AUC
- area under the curve
- CNS
- central nervous system
- DEN
- denervation
- Ginf
- glucose infusion rate
- HPLC
- high performance liquid chromatography
- PBST
- PBS containing 0.05% Tween 20.
References
- 1. Cryer PE. The barrier of hypoglycemia in diabetes. Diabetes. 2008;57(12):3169–3176 [DOI] [PMC free article] [PubMed] [Google Scholar]
- 2. Watts AG, Donovan CM. Sweet talk in the brain: glucosensing, neural networks, and hypoglycemic counterregulation. Front Neuroendocrinol. 2010;31(1):32–43 [DOI] [PMC free article] [PubMed] [Google Scholar]
- 3. Tesfaye N, Seaquist ER. Neuroendocrine responses to hypoglycemia. Ann NY Acad Sci. 2010;1212:12–28 [DOI] [PMC free article] [PubMed] [Google Scholar]
- 4. Donovan CM, Cane P, Bergman RN. Search for the hypoglycemia receptor using the local irrigation approach. Adv Exp Med Biol. 1991;291:185–196 [DOI] [PubMed] [Google Scholar]
- 5. Hevener AL, Bergman RN, Donovan CM. Portal vein afferents are critical for the sympathoadrenal response to hypoglycemia. Diabetes. 2000;49(1):8–12 [DOI] [PubMed] [Google Scholar]
- 6. Fujita S, Donovan CM. Celiac-superior mesenteric ganglionectomy, but not vagotomy, suppresses the sympathoadrenal response to insulin-induced hypoglycemia. Diabetes. 2005;54(11):3258–3264 [DOI] [PubMed] [Google Scholar]
- 7. Fujita S, Bohland M, Sanchez-Watts G, Watts AG, Donovan CM. Hypoglycemic detection at the portal vein is mediated by capsaicin-sensitive primary sensory neurons. Am J Physiol Endocrinol Metab. 2007;293(1):E96–E101 [DOI] [PubMed] [Google Scholar]
- 8. Saberi M, Bohland M, Donovan CM. The locus for hypoglycemic detection shifts with the rate of fall in glycemia: the role of portal-superior mesenteric vein glucose sensing. Diabetes. 2008;57(5):1380–1386 [DOI] [PubMed] [Google Scholar]
- 9. Jackson PA, Cardin S, Coffey CS, et al. Effect of hepatic denervation on the counterregulatory response to insulin-induced hypoglycemia in the dog. Am J Physiol Endocrinol Metab. 2000;279(6):E1249–E1257 [DOI] [PubMed] [Google Scholar]
- 10. Smith D, Pernet A, Reid H, et al. The role of hepatic portal glucose sensing in modulating responses to hypoglycaemia in man. Diabetologia. 2002;45(10):1416–1424 [DOI] [PubMed] [Google Scholar]
- 11. Rossetti P, Porcellati F, Lucidi P, et al. Portal vein glucose sensors do not play a major role in modulating physiological responses to insulin-induced hypoglycemia in humans. Diabetes. 2009;58(1):194–202 [DOI] [PMC free article] [PubMed] [Google Scholar]
- 12. Heptulla RA, Tamborlane WV, Ma TY, Rife F, Sherwin RS. Oral glucose augments the counterregulatory hormone response during insulin-induced hypoglycemia in humans. J Clin Endocrinol Metab. 2001;86(2):645–648 [DOI] [PubMed] [Google Scholar]
- 13. Hevener AL, Bergman RN, Donovan CM. Hypoglycemic detection does not occur in the hepatic artery or liver: findings consistent with a portal vein glucosensor locus. Diabetes. 2001;50(2):399–403 [DOI] [PubMed] [Google Scholar]
- 14. Rooks CR, Penn DM, Kelso E, Bowers RR, Bartness TJ, Harris RB. Sympathetic denervation does not prevent a reduction in fat pad size of rats or mice treated with peripherally administered leptin. Am J Physiol Regul Integr Comp Physiol. 2005;289(1):R92–R102 [DOI] [PubMed] [Google Scholar]
- 15. Andrew PS, Kaufman S. Splenic denervation worsens lipopolysaccharide-induced hypotension, hemoconcentration, and hypovolemia. Am J Physiol Regul Integr Comp Physiol. 2001;280(5):R1564–R1572 [DOI] [PubMed] [Google Scholar]
- 16. Hevener AL, Bergman RN, Donovan CM. Novel glucosensor for hypoglycemic detection localized to the portal vein. Diabetes. 1997;46(9):1521–1525 [DOI] [PubMed] [Google Scholar]
- 17. Donovan CM, Hamilton-Wessler M, Halter JB, Bergman RN. Primacy of liver glucosensors in the sympathetic response to progressive hypoglycemia. Proc Natl Acad Sci USA. 1994;91(7):2863–2867 [DOI] [PMC free article] [PubMed] [Google Scholar]
- 18. Hamilton-Wessler M, Bergman RN, Halter JB, Watanabe RM, Donovan CM. The role of liver glucosensors in the integrated sympathetic response induced by deep hypoglycemia in dogs. Diabetes. 1994;43(8):1052–1060 [DOI] [PubMed] [Google Scholar]
- 19. Jackson PA, Pagliassotti MJ, Shiota M, Neal DW, Cardin S, Cherrington AD. Effects of vagal blockade on the counterregulatory response to insulin-induced hypoglycemia in the dog. Am J Physiol. 1997;273(6 pt 1):E1178–E1188 [DOI] [PubMed] [Google Scholar]
- 20. Moore MC, Cardin S, Edgerton DS, et al. Unlike mice, dogs exhibit effective glucoregulation during low-dose portal and peripheral glucose infusion. Am J Physiol Endocrinol Metab. 2004;286(2):E226–E233 [DOI] [PubMed] [Google Scholar]
- 21. Zangeneh F, Basu R, Shah P, Arora P, Camilleri M, Rizza RA. Enteral infusion of glucose at rates approximating EGP enhances glucose disposal but does not cause hypoglycemia. Am J Physiol Endocrinol Metab. 2003;285(2):E280–E286 [DOI] [PubMed] [Google Scholar]
- 22. Ayala JE, Samuel VT, Morton GJ, et al. Standard operating procedures for describing and performing metabolic tests of glucose homeostasis in mice. Dis Model Mech. 2010;3(9–10):525–534 [DOI] [PMC free article] [PubMed] [Google Scholar]
- 23. Donovan CM, Halter JB, Bergman RN. Importance of hepatic glucoreceptors in sympathoadrenal response to hypoglycemia. Diabetes. 1991;40(1):155–158 [DOI] [PubMed] [Google Scholar]
- 24. Hoffman RP, Sinkey CA, Anderson EA. Hypoglycemia increases muscle sympathetic nerve activity in IDDM and control subjects. Diabetes Care. 1994;17(7):673–680 [DOI] [PubMed] [Google Scholar]
- 25. Davis SN, Dobbins R, Colburn C, et al. Effects of hyperinsulinemia on the subsequent hormonal response to hypoglycemia in conscious dogs. Am J Physiol. 1993;264(5 pt 1):E748–E755 [DOI] [PubMed] [Google Scholar]


