

Abstract
Both prenatal stress (PNS) exposure and a passive stress-coping style have been identified as risk factors for insulin resistance in rats. In the current study, we test the hypothesis that PNS and stress-coping style may interact in predicting susceptibility for metabolic disease. To test this hypothesis, adult male control and PNS offspring were behaviorally characterized using a defensive burying test to have either a passive or proactive stress-coping style. In adulthood, all rats were fed either a standard chow or a high-fat diet for 3 weeks. After 3 weeks of diet exposure, glucose and insulin levels were assessed during an oral glucose tolerance test. Under high-fat diet conditions, PNS rats display elevated glucose and insulin responses to the oral glucose tolerance test, indicative of glucose intolerance. Interestingly, these effects of PNS were far more pronounced in rats characterized by a passive stress-coping style. Additionally, the passively coping PNS rats also gained more weight on the high-fat diet than all other rats tested. This observation suggests that a stressful prenatal environment in combination with a passive stress-coping strategy may prime an individual to be sensitive to diet-induced obesity and type 2 diabetes.
Obesity and obesity-associated disorders, such as type 2 diabetes mellitus, may result from exposure to an environment characterized by the availability of energy-dense food and lack of physical activity. However, large individual differences in disease susceptibility suggest that genetic factors play an important role as well. Interactions between environment and genetics determine each individual's risk of developing obesity and type 2 diabetes. Evolutionarily, obesity is hypothesized to result from a “thrifty genotype”; that is, our current genome is based on the environmental conditions of our hunter-gatherer ancestors, which protected them from intermittent periods of famine. In the current society, where food is always readily available, this genotype leads to an obese phenotype (1). Although this hypothesis is adequate to explain a multigenerational increases in obesity, it does not account for the rapid increase in metabolic disorders in the last decades that only spans 1 or 2 generations (2–4). Recent studies have suggested that these differences may be mediated through epigenetic alterations induced by the prenatal or the early postnatal environment (reviewed in Ref. 5).
The role of the prenatal environment in determining the metabolic phenotype of the offspring has been shown in studies using caloric restriction or caloric overload during pregnancy. Both caloric restriction and overload have been shown put the offspring at risk for developing obesity and type 2 diabetes (6–8). In addition to maternal diet, prenatal stress (PNS) exposure has been shown to influence the metabolic risk of the offspring. Adult offspring of dams exposed to stress during the third week of their pregnancy were hyperinsulinemic and hyperglycemic when they were fed a high-fat diet (8, 9). Thus, a stressful prenatal environment seems to prime the rat for adverse metabolic conditions.
Stress-coping style may be categorized as either proactive or passive. Individuals with a proactive stress-coping style are characterized by an active approach to stress, they manipulate their environment to decrease stress, are more aggressive, and are more impulsive. The proactive stress response is primarily mediated by sympathetic activation. In contrast, passive stress-coping individuals respond passively towards stressor, display little aggression, and their stress response is primarily mediated by the hypothalamus-pituitary-adrenal-axis (10). In a previous study, we found that rats genetically selected for a passive stress-coping style also displayed hyperinsulinemia when exposed to a high-fat diet, indicating that the way an individual copes with stress may further influence their risk for type 2 diabetes (11). Although PNS has been suggested to influence the stress-coping strategy of the offspring, the direction and amplitude of these changes seem highly dependent on the sex of the offspring and the type of stressor used (12–18). In the current study, we test the hypothesis that PNS and stress-coping style may interact in predicting susceptibility to adverse metabolic conditions.
Materials and Methods
Animals
Pregnant female rats (n = 31) arrived from Charles River on gestational day 2. All rats were individually housed in standard tub cages with water and food available ad libitum. Dams were fed a standard lab chow diet (2018; Harlan). The offspring were fed either a standard lab chow diet (2018; Harlan) or a 60% high-fat diet (D12492; Research Diets). The rats were housed in a climate-controlled room with a 12-hour light, 12-hour dark cycle; lights on at 6 am and lights off at 6 pm. All animal procedures were approved by the Animal Care and Use Committee of the Johns Hopkins University School of Medicine.
Experimental set-up
During the third week of their pregnancy (gestational d 14–21), half of the dams (n = 16) were exposed to chronic variable stress as previously described (8). Each stressor was applied during the light cycle unless noted otherwise (Table 1). The variable stress paradigm was chosen for our studies to prevent the animals from habituating to the stress, as has been documented using predictable stressors, such as repeated restraint stress (19). The remaining control dams (n = 15) were exposed to normal animal room husbandry practices in the animal facility.
Table 1.
Schematic Overview of Stressors Applied During Gestation
| GD | Time of day |
||
|---|---|---|---|
| Morning | Noon | Afternoon | |
| 14 | Restraint, 60 min | Swim, 15 min | Restraint, 60 min |
| 15 | Cold exposure, 6 h | ||
| 16 | Swim, 15 min | Restraint, 60 min | Swim, 15 min |
| 17 | Swim, 15 min | Lights on overnight | |
| 18 | Social stress 12 h | ||
| 19 | Restraint, 60 min | Swim, 15 min | Restraint, 60 min |
| 20 | Cold exposure, 6 h | ||
| 21 | Restraint, 60 min | Swim, 15 min | Swim, 15 min |
GD, gestational day.
Body weight and food intake of the dams were measured daily during gestation. The day a litter was found was designated postnatal day (PND)0. On PND1, litters were culled to 10 pups per litter (5 male and 5 female pups), to avoid effects of litter size or within litter sex-distribution on development. Pups were weaned on PND21 and housed with 2 or 3 same-sex litter mates until PND50. Hereafter, the pups were individually housed. On PND60, a defensive burying test was performed to determine the stress-coping style of the offspring.
On PND90, 1 male pup per litter was assigned to the chow diet group and 1 pup per litter was assigned to the high-fat diet group. When assigning pups to their respective groups, we assured that the numbers of proactive and passively coping pups in each experimental group was balanced. This led to the following 8 experimental groups: control chow-fed passively coping (CCP), control chow-fed proactively coping (CCA), control high-fat diet-fed passively coping (CHP), control high-fat diet-fed proactively coping (CHA), PNS chow-fed passively coping (PCP), PNS chow-fed proactively coping (PCA), PNS high-fat diet-fed passively coping (PHP), and PNS high-fat diet-fed proactively coping (PHA). The pups in the high-fat diet groups (CHP, CHA, PHP, and PHA) were switched from a standard rat chow diet on PND90 to a palatable high-fat diet (60% fat, D12492; Research Diets) and maintained on this diet for the remainder of the study. The rats in the control group were kept on the standard chow diet throughout the study. On PND120 (after 30 d on their respective diets), an oral glucose tolerance test was performed. All rats were killed on PND127 at 11 am (5 h into the light phase). Blood plasma samples were obtained at killing for plasma leptin concentration analysis. Brains were collected, immediately frozen, and stored at −80°C for neuropeptide gene expression analysis. Adrenals, thymus, and spleen were dissected out and weight.
Defensive burying test
The rats were characterized as passive or proactive coping using the defensive bury test (37). Rats were tested in a random fashion to control for circadian effects. During this test the rats were transferred to the test cage 30 minutes before testing. The defensive burying test was performed in the middle of the light phase (10 am to 1 pm). The test cage consisted of a standard tub cage with a hole of approximately 1.5 cm in diameter that allowed a shock probe to be inserted into the cage. After habituation, an electrified probe (length, 8.5 cm; diameter, 1 cm) was inserted into the cage. Upon touching the probe, the rat received a mild shock (2.5 mA). After receiving shock, the following behaviors displayed by the rat were scored for 5 minutes using Hindsight software: “exploration of the cage,” “immobility,” “grooming behavior,” “burying of the shock probe,” and “other behavior.” The percentage time spent burying the prod was used as the criterion for the coping style: animals burying 10% of the time or less were characterized as passive, rats burying 20% of the time or more were characterized as proactive, and rats that were between the cut-off criteria (10%–20% burying) were not included in the analysis. Within the control rat population, 72% of the rats could be characterized as either passive or proactive. Within the PNS rats, 100% of the rats could be characterized.
Oral glucose tolerance test
The oral glucose tolerance test was performed in the middle of the light phase (10 am to 12 pm). Rats were food deprived overnight to ensure basal glucose and insulin levels. Animals were housed in the experimental room for 3 hours before testing. A baseline blood sample was taken through a small nick of the tail. Rats then received an oral gavage of glucose solution (2 g/kg body weight, 20% glucose in sterile water solution). Additional blood samples were taken 15, 30, 45, 60, and 120 minutes after glucose administration. Glucose levels in the blood were determined immediately using a handheld glucose analyzer (Freestyle; TheraSense). Blood (200 μL) was collected into a heparinized microcentrifuge tubes, centrifuged at 4°C to collect plasma, and plasma was stored at −80°C for insulin analysis. Insulin levels in the plasma were analyzed using a commercially available insulin radio immunoassay kit (Millipore). Inter- and intraassay variability, respectively, were as follows: 8.5%–9.4% and 1.4%–4.6%.
Plasma hormone analysis
At killing, trunk blood (5 mL) was collected into heparinized microcentrifuge tubes, centrifuged at 4°C to collect plasma, and plasma was stored at −80°C for leptin and corticosterone analysis. Plasma corticosterone concentrations were determined by commercially available radio immunoassay kits for corticosterone (MP Biomedicals). Inter- and intraassay variability for the assay was as follows: 6.5%–7.1% and 4.4%–10.3%, respectively. Leptin levels in the plasma were analyzed using a commercially available Leptin ELISA kit (Millipore). Inter- and intraassay variability, respectively, were as follows: 2.95%–3.93% and 1.88%–2.49%.
Gene expression
Animals were killed by decapitation at 11 am (5 h into the light phase). Brains were removed, frozen immediately on powdered dry ice, and stored at −80°C; 500-μm-thick frozen coronal sections were cut on a cryostat, and tissue punches of the arcuate nucleus of the hypothalamus were collected using a blunted 16-gauge stainless steel needle (inner diameter 1.65 mm) based on the coordinates from Paxinos and Watson (20).
Total RNA from the tissue punches was obtained using the RNeasy Lipid Tissue Mini kit (QIAGEN) with the Qiazol reagent that allows for an efficient separation of RNA from contaminating proteins. QuantiTect Reverse Transcription kit (QIAGEN) was used to generate cDNA for subsequent quantitative real-time PCR. Negative reverse transcriptase samples were used to control for possible contamination of gDNA. All reactions were carried out in triplicate using 1× TaqMan Master Mix (Applied Biosystems), 1× TaqMan probes for each gene (Npy, Pomc, and Agrp), and 2 μg of cDNA template in a total volume of 20 μL; accession numbers and TaqMan Assay ID numbers are as follows:
Npy, NM_012614.1/TaqMan Assay ID Rn01410145_m1;
Pomc, NM_139326.2/TaqMan Assay ID Rn00595020_m1;
Agrp, NM_033650.1/TaqMan assay ID Rn01431703_g1.
Real-time reactions were performed on an Applied Biosystems 7900HT Fast Real-Time PCR System with standard PCR conditions (50°C for 2 min; 95°C for 10 min; and 95°C for 15 s and 60°C for 1 min for 40 cycles). Each set of triplicates was checked to ensure that the threshold cycle (Ct) values were all within 1 Ct of each other. To determine relative expression values, the −ΔΔCt method (Applied Biosystems) was used, where triplicate Ct values for each tissue sample were averaged and subtracted from those derived from the housekeeping gene β-actin. β-Actin levels did not differ among the groups. The average Ct difference for the control group was subtracted from those of the test samples, and the resulting −ΔΔCt values were raised to a power of 2 to determine normalized relative expression.
Statistical analysis
All data are presented as averages with SEMs. Data were analyzed by Statistica 7.0 (Systat). Differences between the groups in body weight, food intake, insulin, and glucose levels were statistically analyzed using repeated measures ANOVA, with coping style (COPING), diet (DIET), and prenatal condition (STRESS) as between subject factors. Tukey post hoc analysis was used to compare the different group and time points. Differences in gene expression were statistically analyzed using factorial ANOVA with coping style (COPING), diet (DIET), and prenatal condition (STRESS) as between subject factors followed by a Tukey post hoc analysis to assess specific group differences. Area under the curve was calculated using the trapezoidal rule. Correlations between body weight and gene expression were calculated using Pearson's correlation analysis. For all statistical analysis, a confidence interval of 5% was used.
Results
Dams
There were no significant differences in body weight or food intake between control and stressed dams during the gestation or the lactation period. However, the body weight growth during pregnancy was significantly lower within the PNS rats compare with the control rats (repeated measures [RM]-ANOVA TIME*STRESS: F6,90 = 3.559, P < .01) (Table 2). There were no differences in litter weight, litter size, or male to female ratio between control and PNS litters.
Table 2.
Litter and Dam Characteristics
| Control | PNS | |
|---|---|---|
| Weight dams (g) (GD12, before stress) | 223 ± 3.3 | 218 ± 3.8 |
| Weight dams (g) (GD21, after stress) | 363 ± 5.5a | 335 ± 9.1a |
| Litter size (before culling) | 10.7 ± 0.78 | 11.2 ± 0.68 |
| Male/female ratio (before culling) | 1.11 ± 0.21 | 0.9 ± 0.24 |
| Average pup weight (g) (PND1) | 8.9 ± 0.76 | 8.8 ± 0.637 |
| Average pup weight (g) (PND21) | 58.7 ± 0.62 | 56.1 ± 1.65 |
GD, gestational day. Litters were culled to n = 10 per litter (5 males and 5 females) on PND1.
Significant difference between control and PNS groups (P < .05).
Defensive burying behavior in offspring
To assess the coping styles of the offspring, a defensive burying test was performed (Figure 1). The percentages of time spent immobile, grooming, exploring, burying, and on other behaviors are shown in Figure 1A. PNS rats spent significantly more time burying the prod and exploring their cage (ANOVA STRESS: burying F1,71 = 5.057, P < .05; explore F1,71 = 30.904, P < .01). There was a tendency for PNS rats to spend more time immobile; however, this difference did not reach statistical significance (P = .063) (Figure 1A). The distribution of burying behavior within the population was significantly different in PNS and control populations (χ2 = 56.01538, degrees of freedom = 9, P < .0001). PNS stress populations had more rats in the 0%–10%, 70%–80%, and 90%–100% burying categories and less rats in the 10%–20%, 20%–30%, 30%–40%, 40%–50%, and 50%–60% burying categories (Figure 1B).
Figure 1.
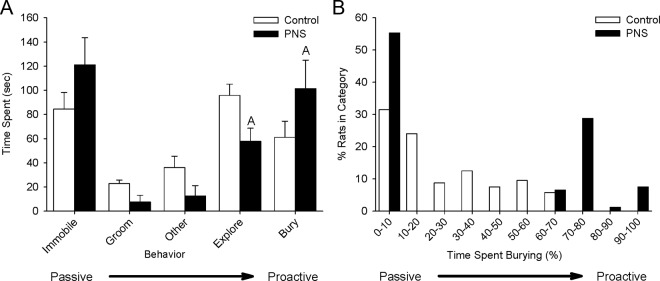
Defensive burying behavior in PNS and control male rats. A shock probe was inserted into the test cage. The behavior of the rats was scored for 300 seconds after the rats received a shock from the probe. A, Time spent on each recorded behavior during the defensive burying test. B, Distribution of burying behavior within PNS and control rat populations. Rats were categorized by the percentage of time spent burying. The graph displays the percentage of rats in each burying category. White bars, control rats; black bars, PNS rats; an A indicates a significant difference between control and PNS rats, P < .05.
Body weight and food intake of offspring
At PND90, when half of all offspring were switched to a high-fat diet, there were no differences in body weight between PNS and control offspring (Figure 2). Coping style did not have an effect on body weight before the start of the diet. After 4 days on a high-fat diet, all passively coping individuals (CHP and PHP) gained more weight than their proactive counterparts (CHA and PHA) (RM-ANOVA TIME*DIET*COPING: F19,779 = 2.5526, P < .05). From day 5 onwards, the PHP rats were significantly heavier than all other tested offspring (RM-ANOVA TIME*STRESS*DIET*COPING: F19,779 = 1.6272, P < .05).
Figure 2.

Body weight and food intake of adult (PND90–PND120) control and PNS rats, characterized as passive or proactive coping. A, Body weights of rats on chow diet. The bar graphs present body weight on PND90 (d 0 on diet). The lines present the body weight gain (% of baseline) between PND90 and PND120. B, Body weights of rats on a high-fat diet. The bar graphs present body weights on PND90 (d 0 on diet). The lines present the body weight gain (% of baseline) between PND90 and PND120. C, Food intake of rats on a chow diet. D, Food intake of rats on a high-fat diet. White bars/symbols, proactive coping; gray bars/symbols, passive coping; triangles, control; circles, PNS; a C indicates a significant difference between passive and proactive-coping rats, P < .05; a D indicates a significant difference between passive PNS rats and all other groups, P < .05. Cpro, control proactive; Cpas, control passive; Ppro, PNS proactive; Ppas, PNS passive.
Throughout the whole measurement period, rats on the high-fat diet had significantly higher food intake than rats fed a chow diet (RM-ANOVA TIME*DIET: F20,840 = 4.3034, P < .01) regardless of coping style and PNS exposure. However, cumulative food intake before oral glucose tolerance test (21 days) was significantly higher in passively coping PNS rats (ANOVA STRESS*DIET*COPING: F1,37 = 4.8458, P < .05). There were no significant differences in adrenal, spleen, or thymus weights between the groups (Supplemental Table 1, published on The Endocrine Society's Journals Online web site at http://endo.endojournals.org).
Oral glucose tolerance test
Figure 3 displays the glucose response to an oral glucose load in chow-fed (Figure 3A) and high-fat diet-fed (Figure 3B) offspring. The offspring fed a high-fat diet had significantly higher glucose response than chow-fed rats (RM-ANOVA TIME*DIET: F5,185 = 4.6593 P < .01). ANOVA analysis additionally showed that there was a time*PNS*diet*coping interaction (RM-ANOVA TIME*STRESS*DIET*COPING: F5,185 = 3.5215, P < .05). More specifically, post hoc analysis showed that within the rats on the chow diet, passively coping offspring of stressed dams (PCP) had significantly higher glucose levels 30, 45, and 60 minutes after the glucose administration (P < .05) compared with all other groups (CCP, CCA, and PCA). Within the rats on a high-fat diet, passively coping offspring of stressed dams (PHP) had significantly higher glucose levels 15 minutes after glucose administration compared with all other groups (CHP, CHA, and PHA) (P < .05). Between 30 and 60 minutes after glucose administration, all offspring exposed to PNS had higher glucose levels, independent of coping style (P < .05). Analysis of the area under the glucose curve confirmed these findings. There was an overall diet effect; rats on a high-fat diet have higher glucose levels (ANOVA DIET: F1,37 = 13.2906, P < .01). Prenatal condition also had an overall effect, with higher glucose responses in prenatally stress rats (ANOVA STRESS: F1,37 = 4.8542, P < .05). Finally, there was an PNS*diet*coping style interaction effect (ANOVA STRESS*DIET*COPING: F1,37 = 3.2864, P < .05). Within the control rats, all rats on the high-fat diet had higher glucose levels than their chow-fed counterparts (CCP and CCA vs CHP and CHA). In contrast, within the PNS offspring, glucose levels were lower in proactive chow-fed rats compared with either proactive high-fat diet-fed rats of passively coping rats on either diet (PCA vs PCP, PHP, and PHA). A difference that can be explained by increased glucose levels in the chow-fed passively coping PNS rats (PCP).
Figure 3.

Glucose levels during the oral glucose tolerance test (OGTT) of adult (PND121) control and PNS rats, characterized as passive or proactive coping. On PND121, rats received an oral gavage of 2-mg/kg glucose at t = 0. Glucose levels were measured before gavage (t = 0) and 15, 30, 45, 60, and 120 minutes after gavage. A, Glucose levels during the OGTT for rats on a chow diet. White symbols, proactive coping; gray symbols, passive coping; triangles, control; circles, PNS. B, Glucose levels during the OGTT for rats on a high-fat diet. White symbols, proactive coping; gray symbols, passive coping; triangles, control; circles, PNS. C, Area under the curve for glucose response for rats on either a chow or a high-fat diet. White bars, proactive coping; gray bars, passive coping; open bars, chow diet; hatched bars, high-fat diet; an A indicates a significant difference between control and PNS rats, P < .05; a B indicates a significant difference between chow and high-fat diet-fed rats, P < .05; a D indicates a significant difference between passive PNS rats and all other groups, P < .05.
Figure 4 displays the insulin response to an oral glucose load in chow-fed (Figure 4A) and high-fat diet-fed (Figure 4B) offspring. Rats fed a high-fat diet had significantly higher insulin levels during the oral glucose tolerance test than rats on a chow diet (RM-ANOVA TIME*DIET: F5,185 = 4.2367, P < .05). Within rats on a standard chow diet, there were no effects of coping style or PNS on the glucose-stimulated insulin response (Figure 4A). Within the rats on the high-fat diet, passively coping rats had higher insulin levels 30 minutes after glucose administration (CHP vs CHA, and PHP vs PHA) (P < .05). Sixty minutes after glucose administration, the insulin levels of PNS passive-coping rats (PHP) were significantly higher than all other rats (CHP, CHA, and PHA) (P < .01). Analysis of the area under the insulin curve showed that rats on the high-fat diet had higher insulin responses to an oral glucose tolerance test than chow-fed rats (ANOVA DIET: F1,37 = 34.9891, P < .01). There was a diet*PNS*coping effect (ANOVA STRESS*DIET*COPING: F1,37 = 3.2802, P < .05). Post hoc analysis showed that the area under the insulin curve was significantly larger in high-fat diet-fed PNS passively coping rats (PHP) compared with all other group (P < .01).
Figure 4.

Insulin levels during the oral glucose tolerance test (OGTT) of adult (PND121) control and PNS rats, characterized as passive or proactive coping. On PND121, rats received an oral gavage of 2-mg/kg glucose at t = 0. Blood sample for plasma insulin analysis were taken before gavage (t = 0) and 15, 30, 45, 60, and 120 minutes after gavage. A, Insulin levels during an OGTT of rats on a chow diet. White symbols, proactive coping; gray symbols, passive coping; triangles, control; circles, PNS. B, Insulin levels during the OGTT for rats on high-fat diet. White symbols, proactive coping; gray symbols, passive coping; triangles, control; circles, PNS. C, Area under the curve for insulin response of rats on either a chow or a high-fat diet. White bars, proactive coping; gray bars, passive coping; open bars, chow diet; hatched bars, high-fat diet; an A indicates a significant difference between control and PNS rats, P < .05; a B indicates a significant difference between chow and high-fat diet-fed rats, P < .05; a C indicates a significant difference between passive and proactive-coping rats, P < .05; a D indicates a significant difference between passive PNS rats and all other groups, P < .05.
Plasma hormone levels
Table 3 displays the corticosterone and leptin levels. At killing, the plasma corticosterone levels were significantly higher in passively coping rats (ANOVA COPING: F1,37 = 8.4564, P < .01). There were no overall effects of PNS or diet on the corticosterone levels. However, there was a PNS*diet*coping style interaction (ANOVA STRESS*DIET*COPING: F1,37 = 5.3919 P < .05). Post hoc analysis revealed that within the passively coping rats, rats fed a high-fat diet had lower corticosterone levels. This effect was more pronounced in PNS rats compared with control rats (P < .05).
Table 3.
Leptin and Corticosterone Levels on PND127
| Chow Diet |
High-Fat Diet |
|||
|---|---|---|---|---|
| Proactive | Passive | Proactive | Passive | |
| Corticosterone control (ng/mL) | 123.0 ± 35.7 | 135.9 ± 3.4b | 100.7 ± 6.8 | 97.0 ± 15.4a |
| Corticosterone PNS (ng/mL) | 106.3 ± 12.9 | 184.7 ± 21.8b | 95.5 ± 7.1 | 154.2 ± 20.9a,b |
| Leptin control (ng/mL) | 9.48 ± 1.31 | 14.08 ± 3.29b | 13.19 ± 2.67a | 17.11 ± 1.99a,b |
| Leptin PNS (ng/mL) | 9.78 ± 1.99 | 13.05 ± 0.84b | 14.69 ± 2.86a | 21.08 ± 2.45a,b |
Leptin and corticosterone levels are presented in ng/mL plasma.
Significant difference between chow and high-fed diet rats within the same experimental group (P < .05).
Significant difference between passive and proactive rats on the same diet (P < .05).
Rats on a high-fat diet had higher leptin levels than rats on a chow diet (ANOVA DIET: F1,37 = 14.0109, P < .01). Stress-coping style also influenced the plasma leptin levels; passively coping rats had significantly higher leptin levels than proactive rats (ANOVA COPING: F1,37 = 13.5738, P < .01). There were no effects of PNS on leptin levels nor were there significant interactions among diet, PNS, and/or coping. There was a significant positive correlation between the body weight on the day of killing and the plasma leptin levels (R = 0.4422, P < .05).
Gene expression
Figure 5 displays the relative expression of the Npy (Figure 5A), the Agrp (Figure 5B), and the Pomc (Figure 5C) genes in the arcuate nucleus of the rats. On the chow diet, there were no effects of the PNS or the coping style on the expression of Npy, Agrp, or Pomc. There were no overall diet effects on the gene expression of Npy, Agrp, or Pomc. However, there was a PNS*diet*coping style interaction; PNS rats with a passive stress-coping style (PHP) on a high-fat diet had significantly lower Npy expression and significantly higher Pomc expression than PNS proactive-coping rats or control rats (CHP, CHA, and PHA) (Npy: ANOVA STRESS*DIET*COPING: F1,37 = 9.8215, P < .01; Pomc: ANOVA STRESS*DIET*COPING: F1,37 = 7.3680, P < .01). There were no significant differences in Agrp expression in rats on the high-fat diet. The Npy expression levels negatively correlated with the rats body weights (r = −0.7235, P < .01), whereas Pomc expression levels positively correlated with the rats body weights (r = 0.6193 P < .01).
Figure 5.

Npy, Agrp, and Pomc gene expression in the arcuate nucleus of adult (PND121) control and PNS rats, characterized as passive or proactive coping. A, Npy expression. White bars, proactive coping; gray bars, passive coping; open bars, control rats; hatched bars, PNS rats. B, Agrp expression. White bars, proactive coping; gray bars, passive coping; open bars, control rats; hatched bars, PNS rats. C, Pomc expression. White bars, proactive coping; gay bars, passive coping; open bars, control rats; hatched bars, PNS rats; a D indicates a significant difference between passive PNS rats and all other groups, P < .05. HF, high fat diet; Npy, neuropeptide Y; Pomc, proopiomelanocortin; Agrp, agouti related protein.
Discussion
Consistent with previous findings (8, 9), our data suggest that rats exposed to PNS display a diabetes-prone phenotype. Under high-fat diet conditions, PNS rats display elevated glucose and insulin responses in an oral glucose tolerance test, indicative of glucose intolerance. These effects of PNS were far more pronounced in rats characterized by a passive stress-coping style. Additionally, the passively coping PNS rats gained more weight on the high-fat diet than all other rats tested. Thus, it seems that the prenatal environment and the stress-coping style of an individual interact in predicting metabolic risk under high-fat diet conditions. Pomc gene expression was elevated, and Npy was decreased in the passively coping PNS rats on the high-fat diet. The expression levels of these neuropeptides correlated with the body weights of the rats. This suggests that altered expression of Npy and Pomc are likely a consequence of increased body weight in these rats.
The effects of PNS on glucose homeostasis in chow-fed rats are contradictory, where some studies find no differences on this diet (8, 21), others report hyperglycemia in PNS offspring (9). In our study, we only observed hyperglycemia on the standard chow diet in the passively coping PNS rats. Because different rat strains and even different populations of rats from the same strain may have variable distributions of passive and proactive stress-coping styles, the effects of PNS on glucose homeostasis on the chow diet may have been clouded by the stress-coping styles of the rats used in the previously published studies. When PNS rats are exposed to a high-fat diet, development of glucose intolerance seems more pronounced. Whether or not PNS alters stress-coping style and, thereby, induces a diabetes-prone phenotype or whether these are separate mechanistic pathways is unclear at this point. However, our data show that within the PNS offspring population, a more extreme stress-coping phenotype is observed, suggesting that there may be an effect of PNS on development of stress-coping style. These effects of PNS on stress-coping style are somewhat controversial, because previous studies have reported both increased and decreased passive-coping behavior after PNS exposure as well as no effect of PNS on coping behavior (reviewed in Refs. 15, 18). Differences in methodology and the type of stressor used may account, in part, for these discrepancies (22). Nevertheless, our data suggest that PNS might not determine the coping style but may result in a stronger coping phenotype.
Previously, we reported that if PNS rats were weaned onto a high-fat diet, they developed hyperglycemia and hyperinsulinemia relative to control rats and PNS rats weaned to chow (8). The current study shows that adult PNS offspring that are exposed to a high-fat diet for just 3 weeks as adults also develop hyperinsulinemia and hyperglycemia, suggesting that susceptibility to diet-induced obesity in PNS offspring persists into adulthood. Hyperinsulinemia is only observed in those rats characterized by a passive stress-coping style. High-fat diet-fed proactive rats exposed to PNS had an elevated glucose response but without concurrent elevated insulin levels. Therefore, hyperglycemia observed in passive and proactive-coping PNS rats may have a different underlying mechanism. Because passively coping PNS rats display hyperglycemia, hyperinsulinemia, and showed increased body weight gain, the phenotype of these rats most closely resembles insulin resistance as is observed in type 2 diabetic humans. However, further studies directly measuring insulin sensitivity, such as a euglycemic hyperinsulinemic clamp, are needed to confirm insulin resistance in passively coping PNS rats. The hypothesis that passively coping rats are more susceptible to a metabolic syndrome-like phenotype is further strengthened by the observation that these animals have higher circulating plasma leptin levels. Higher leptin levels are typically indicative of higher body adiposity (23). In our study, the plasma leptin levels were correlated with the body weights of the rats, suggesting that the increased body weight observed in the high-fat diet-fed rats was induced by increased adiposity. Of note, when leptin levels were normalized to the rats body weight, passively coping PNS rats still had higher leptin levels compared with all other groups (P = .0058), suggesting that these rats may also experience a degree of leptin insensitivity in addition to insulin resistance.
Proactively coping PNS rats on the high-fat diet displayed elevated glucose levels in the absence of elevated insulin responses, suggesting that hyperglycemia in these rats is likely not due to insulin resistance. Because proactively coping rats do not display a large glucocorticoid response to stress, but rather have elevated sympathetic activation (24), PNS may not affect their glucocorticoid system and, thus, may not influence their glucose homeostasis through the glucocorticoid pathway. Elevated glucose levels in the proactive rats may be a consequence of heighted sympathetic activation in the animals. Activation of the sympathetic nervous system leads to increased glycogenolysis and gluconeogenesis, resulting in increased hepatic glucose production. Additionally, release of epinephrine inhibits insulin-stimulated glucose uptake in skeletal muscle and adipose tissue, which will also lead to increase glucose levels (reviewed in Ref. 25). Because proactive rats are characterized by heightened sympathetic activation in responses to stress (10), and being fed a high-fat diet might serve as a physiological “stressor,” exposure to high-fat diet may have increased sympathetic activity in response to nutrients in the proactively coping rat and thereby increased the glucose response while inhibiting insulin release. To test this hypothesis, future studies investigating levels of epinephrine, norepinephrine, and corticosterone in response to ingestion of a high-fat diet in proactively and passively coping PNS rats are warranted.
We could further speculate on another candidate underlying this interaction between PNS and stress-coping style in the development of a type 2 diabetes-like phenotype. The most obvious candidate is the glucocorticoid system. Both PNS and a passive stress-coping style have been reported to increase glucocorticoid levels (10, 26). A role for glucocorticoids in the development of type 2 diabetes has been indicated by several studies. Elevated glucocorticoids levels may affect glucose homeostasis through several pathways. Glucocorticoids decrease insulin-dependent glucose uptake by inhibition of phosphorylation of insulin receptor 1 (muscle) and insulin receptor 2 (adipocytes) subunits by phosphatidylinositol 3-kinase (27, 28). Both these pathways lead to a decreased activation of protein kinase B, which in turn leads to a decreased translocation of glucose transporter 4, resulting in decreased glucose uptake (reviewed in Ref. 29). Furthermore, glucocorticoids have been reported to induce visceral adiposity, which in turn may promote insulin insensitivity (reviewed in Ref. 30). In previous studies, we have seen that the more passive the coping behavior of the rats, the higher their glucocorticoid response to stressors is and the higher their insulin response after glucose infusion (31). The current study confirms this finding with higher corticosterone levels in passively coping rats. However, being fed a high-fat diet decreased corticosterone levels, which seems in contradiction to the glucocorticoid-mediated insulin resistance hypothesis posited above. More detailed investigations of stress-induced glucocorticoid release and circadian glucocorticoid patterns on both diets are needed to test this hypothesis.
Apart from effects on the sympatho-adrenal balance on the glucose homeostasis of offspring exposed to PNS, PNS may affect neuronal development, which in turn may mediate the metabolic phenotype of the offspring. Changes in hippocampal morphology have been reported, including reduction in the number of synapses, increased number of hippocampal lesions, and decreased hippocampal volume (32). Changes in monoamine levels may also play a role. Serotonin binding has been altered (33, 34), and studies examining dopaminergic pathways suggest that PNS leads to an increase in the density of dopamine D2 receptors in the nucleus accumbens and a reduction in dopamine release in this area (35, 36). Overall, changes in brain morphology and/or neuropeptide release induced by PNS likely plays a role in the development of the disease-prone phenotype of PNS rats. Additional studies to assess β-cell function, insulin receptor sensitivity, and signaling pathways in hypothalamus and in other brain areas are needed to further elucidate the underlying mechanisms responsible for the metabolic phenotypes of both proactively and passively coping PNS rats.
In summary, our data indicate that PNS and stress-coping style interact in predicting the metabolic phenotype of the individual rat. This observation suggests that a stressful prenatal environment in combination with an innate passive stress-coping strategy may prime an individual to be sensitive to diet-induced obesity and type 2 diabetes. Further research is needed to investigate whether interventions during the early developmental period aimed at stress responsivity may prove beneficial in preventing the development of adverse metabolic conditions specifically in passively coping individuals.
Acknowledgments
We thank Dr Nu-Chu Liang and Ryan Purcell for their technical assistance with these studies. We also thank Dr Timothy Moran for his valuable feedback on the manuscript.
This work was supported by the National Institutes of Health (NIH) Grant HD055030, a Brain and Behavior Research Foundation NARSAD Young Investigator Award, and the Dutch Scientific Organization NWO Rubicon Post-Doctoral Fellowship 825.10.032.
Disclosure Summary: The authors have nothing to disclose.
Footnotes
- CCA
- control chow-fed proactively coping
- CCP
- control chow-fed passively coping
- CHA
- control high-fat diet-fed proactively coping
- CHP
- control high-fat diet-fed passively coping
- Ct
- threshold cycle
- PCA
- PNS chow-fed proactively coping
- PCP
- PNS chow-fed passively coping
- PHA
- PNS high-fat diet-fed proactively coping
- PHP
- PNS high-fat diet-fed passively coping
- PND
- postnatal day
- PNS
- prenatal stress.
References
- 1. Neel JV. Diabetes mellitus: a “thrifty” genotype rendered detrimental by “progress”? Am J Hum Genet. 1962;14:353–362 [PMC free article] [PubMed] [Google Scholar]
- 2. Chakravarthy MV, Booth FW. Eating, exercise, and “thrifty” genotypes: connecting the dots toward an evolutionary understanding of modern chronic diseases. J Appl Physiol. 2004;96(1):3–10 [DOI] [PubMed] [Google Scholar]
- 3. Speakman JR. Thrifty genes for obesity, an attractive but flawed idea, and an alternative perspective: the 'drifty gene' hypothesis. Int J Obes (Lond). 2008;32(11):1611–1617 [DOI] [PubMed] [Google Scholar]
- 4. Wells JC. The evolution of human fatness and susceptibility to obesity: an ethological approach. Biol Rev Camb Philos Soc. 2006;81(2):183–205 [DOI] [PubMed] [Google Scholar]
- 5. Tamashiro KL, Moran TH. Perinatal environment and its influences on metabolic programming of offspring. Physiol Behav. 2010;100(5):560–566 [DOI] [PMC free article] [PubMed] [Google Scholar]
- 6. Levin BE, Govek E. Gestational obesity accentuates obesity in obesity-prone progeny. Am J Physiol. 1998;275(4 pt 2):R1374–R1379 [DOI] [PubMed] [Google Scholar]
- 7. Shin BC, Dai Y, Thamotharan M, Gibson LC, Devaskar SU. Pre- and postnatal calorie restriction perturbs early hypothalamic neuropeptide and energy balance. J Neurosci Res. 2012;90(6):1169–1182 [DOI] [PMC free article] [PubMed] [Google Scholar]
- 8. Tamashiro KL, Terrillion CE, Hyun J, Koenig JI, Moran TH. Prenatal stress or high-fat diet increases susceptibility to diet-induced obesity in rat offspring. Diabetes. 2009;58(5):1116–1125 [DOI] [PMC free article] [PubMed] [Google Scholar]
- 9. Lesage J, Del-Favero F, Leonhardt M, et al. Prenatal stress induces intrauterine growth restriction and programmes glucose intolerance and feeding behaviour disturbances in the aged rat. J Endocrinol. 2004;181(2):291–296 [DOI] [PubMed] [Google Scholar]
- 10. Koolhaas JM, Korte SM, de Boer SF, et al. Coping styles in animals: current status in behavior and stress-physiology. Neurosci Biobehav Rev. 1999;23(7):925–935 [DOI] [PubMed] [Google Scholar]
- 11. Boersma GJ, Benthem L, van Dijk G, Steimer TJ, Scheurink AJ. Coping style predicts the (in)sensitivity for developing hyperinsulinemia on a high fat diet in rats. Physiol Behav. 2010;100(4):401–407 [DOI] [PubMed] [Google Scholar]
- 12. Bosch OJ, Krömer SA, Neumann ID. Prenatal stress: opposite effects on anxiety and hypothalamic expression of vasopressin and corticotropin-releasing hormone in rats selectively bred for high and low anxiety. Eur J Neurosci. 2006;23(2):541–551 [DOI] [PubMed] [Google Scholar]
- 13. Bowman RE, MacLusky NJ, Sarmiento Y, Frankfurt M, Gordon M, Luine VN. Sexually dimorphic effects of prenatal stress on cognition, hormonal responses, and central neurotransmitters. Endocrinology. 2004;145(8):3778–3787 [DOI] [PubMed] [Google Scholar]
- 14. Clinton S, Miller S, Watson SJ, Akil H. Prenatal stress does not alter innate novelty-seeking behavioral traits, but differentially affects individual differences in neuroendocrine stress responsivity. Psychoneuroendocrinology. 2008;33(2):162–177 [DOI] [PMC free article] [PubMed] [Google Scholar]
- 15. Dahlöf LG, Hård E, Larsson K. Influence of maternal stress on the development of the fetal genital system. Physiol Behav. 1978;20(2):193–195 [DOI] [PubMed] [Google Scholar]
- 16. McCormick CM, Smythe JW, Sharma S, Meaney MJ. Sex-specific effects of prenatal stress on hypothalamic-pituitary-adrenal responses to stress and brain glucocorticoid receptor density in adult rats. Brain Res Dev Brain Res. 1995;84(1):55–61 [DOI] [PubMed] [Google Scholar]
- 17. Ordyan NE, Pivina SG. Characteristics of the behavior and stress-reactivity of the hypophyseal-adrenal system in prenatally stressed rats. Neurosci Behav Physiol. 2004;34(6):569–574 [DOI] [PubMed] [Google Scholar]
- 18. Weinstock M. Does prenatal stress impair coping and regulation of hypothalamic-pituitary-adrenal axis? Neurosci Biobehav Rev. 1997;21(1):1–10 [DOI] [PubMed] [Google Scholar]
- 19. Barnum CJ, Blandino P, Jr, Deak T. Adaptation in the corticosterone and hyperthermic responses to stress following repeated stressor exposure. J Neuroendocrinol. 2007;19(8):632–642 [DOI] [PubMed] [Google Scholar]
- 20. Paxinos GW, Watson C. The Rat Brain in Stereotaxic Coordinates. 6 ed Sydney, Australia: Academic Press; 1982 [Google Scholar]
- 21. D'Mello AP, Liu Y. Effects of maternal immobilization stress on birth weight and glucose homeostasis in the offspring. Psychoneuroendocrinology. 2006;31(3):395–406 [DOI] [PubMed] [Google Scholar]
- 22. Richardson HN, Zorrilla EP, Mandyam CD, Rivier CL. Exposure to repetitive versus varied stress during prenatal development generates two distinct anxiogenic and neuroendocrine profiles in adulthood. Endocrinology. 2006;147(5):2506–2517 [DOI] [PubMed] [Google Scholar]
- 23. Considine RV, Sinha MK, Heiman ML, et al. Serum immunoreactive-leptin concentrations in normal-weight and obese humans. N Engl J Med. 1996;334(5):292–295 [DOI] [PubMed] [Google Scholar]
- 24. Coppens CM, de Boer SF, Koolhaas JM. Coping styles and behavioural flexibility: towards underlying mechanisms. Philos Trans R Soc Lond B Biol Sci. 2010;365(1560):4021–4028 [DOI] [PMC free article] [PubMed] [Google Scholar]
- 25. Nonogaki K. New insights into sympathetic regulation of glucose and fat metabolism. Diabetologia. 2000;43(5):533–549 [DOI] [PubMed] [Google Scholar]
- 26. Maccari S, Morley-Fletcher S. Effects of prenatal restraint stress on the hypothalamus-pituitary-adrenal axis and related behavioural and neurobiological alterations. Psychoneuroendocrinology. 2007;32(suppl 1):S10–S15 [DOI] [PubMed] [Google Scholar]
- 27. Giorgino F, Pedrini MT, Matera L, Smith RJ. Specific increase in p85α expression in response to dexamethasone is associated with inhibition of insulin-like growth factor-I stimulated phosphatidylinositol 3-kinase activity in cultured muscle cells. J Biol Chem. 1997;272(11):7455–7463 [DOI] [PubMed] [Google Scholar]
- 28. Saad MJ, Folli F, Kahn JA, Kahn CR. Modulation of insulin receptor, insulin receptor substrate-1, and phosphatidylinositol 3-kinase in liver and muscle of dexamethasone-treated rats. J Clin Invest. 1993;92(4):2065–2072 [DOI] [PMC free article] [PubMed] [Google Scholar]
- 29. Youngren JF. Regulation of insulin receptor function. Cell Mol Life Sci. 2007;64(7–8):873–891 [DOI] [PMC free article] [PubMed] [Google Scholar]
- 30. Peeke PM, Chrousos GP. Hypercortisolism and obesity. Ann NY Acad Sci. 1995;771:665–672 [DOI] [PubMed] [Google Scholar]
- 31. Boersma G, Benthem L, van Dijk G, Steimer TJ, Scheurink AJ. Pharmacological treatment of hyperinsulineamia in rats depends on coping style. Eur J Pharmacol. 2011;654(1):122–127 [DOI] [PubMed] [Google Scholar]
- 32. Hayashi A, Nagaoka M, Yamada K, Ichitani Y, Miake Y, Okado N. Maternal stress induces synaptic loss and developmental disabilities of offspring. Int J Dev Neurosci. 1998;16(3–4):209–216 [DOI] [PubMed] [Google Scholar]
- 33. Peters DA. Effects of maternal stress during different gestational periods on the serotonergic system in adult rat offspring. Pharmacol Biochem Behav. 1988;31(4):839–843 [DOI] [PubMed] [Google Scholar]
- 34. Van den Hove DL, Lauder JM, Scheepens A, Prickaerts J, Blanco CE, Steinbusch HW. Prenatal stress in the rat alters 5-HT1A receptor binding in the ventral hippocampus. Brain Res. 2006;1090(1):29–34 [DOI] [PubMed] [Google Scholar]
- 35. Alonso SJ, Navarro E, Rodriguez M. Permanent dopaminergic alterations in the n. accumbens after prenatal stress. Pharmacol Biochem Behav. 1994;49(2):353–358 [DOI] [PubMed] [Google Scholar]
- 36. Henry C, Guegant G, Cador M, et al. Prenatal stress in rats facilitates amphetamine-induced sensitization and induces long-lasting changes in dopamine receptors in the nucleus accumbens. Brain Res. 1995;685(1–2):179–186 [DOI] [PubMed] [Google Scholar]
- 37. Boer SF, Slangen JL, Van der GJ. Plasma catecholamine and corticosterone levels during active and passive shock-prod avoidance behavior in rats: effects of chlordiazepoxide. Physiol Behav. 1990;47(6):1089–1098 [DOI] [PubMed] [Google Scholar]