Abstract
Background
Splenectomy is a clinical risk factor for complicated thrombosis. We hypothesized that the loss of the mechanical filtering function of the spleen may enrich for thrombogenic phospholipids in the circulation, thereby affecting the vascular remodeling of thrombosis.
Methods and Results
We investigated the effects of splenectomy both in chronic thromboembolic pulmonary hypertension (CTEPH), a human model disease for thrombus nonresolution, and in a mouse model of stagnant flow venous thrombosis mimicking deep vein thrombosis. Surgically excised thrombi from rare cases of CTEPH patients who had undergone previous splenectomy were enriched for anionic phospholipids like phosphatidylserine. Similar to human thrombi, phosphatidylserine accumulated in thrombi after splenectomy in the mouse model. A postsplenectomy state was associated with larger and more persistent thrombi. Higher counts of procoagulant platelet microparticles and increased leukocyte–platelet aggregates were observed in mice after splenectomy. Histological inspection revealed a decreased number of thrombus vessels. Phosphatidylserine‐enriched phospholipids specifically inhibited endothelial proliferation and sprouting.
Conclusions
After splenectomy, an increase in circulating microparticles and negatively charged phospholipids is enhanced by experimental thrombus induction. The initial increase in thrombus volume after splenectomy is due to platelet activation, and the subsequent delay of thrombus resolution is due to inhibition of thrombus angiogenesis. The data illustrate a potential mechanism of disease in CTEPH.
Keywords: hypertension, angiogenesis, spectroscopy, venous thrombosis
Introduction
Splenectomy is associated with venous thrombosis in general and, in particular, with nonresolving and recurrent thrombosis(2006) and deep vein thrombosis (DVT).(2010) One late consequence of nonresolution of venous and pulmonary thromboemboli is chronic thromboembolic pulmonary hypertension (CTEPH),(2008) a model disease for persistent/recurrent thrombosis. Several investigators have recently found in control retrospective and prospective cohort studies that splenectomy is a risk factor for CTEPH.(2005)–(2011)
Mechanisms linking splenectomy and CTEPH are unclear. Potential explanations have been the loss of splenic filtering function leading to the circulation of abnormal erythrocytes, possibly resulting in the exposure of phosphatidylserine (PS) on cell surfaces and the activation of coagulation.(1998) After splenectomy, activated platelets have been shown to enhance thrombin generation(2000) and to affect cytokine expression.(2006) Splenectomy leads to immediate reactive thrombocytosis due to decreased cell degradation and an increased risk of subsequent venous thromboembolism.(2012)–(2010) However, this association is likely to be due to additional risk factors of severely ill trauma patients included in these studies.(2005) No increase in the incidence of thromboembolism was evident directly after splenectomy in another study.(1978) Platelet counts return to normal values several weeks after surgical removal of the spleen, whereas CTEPH develops 7 to 25 years after splenectomy.(2005) Thus, an increased risk of CTEPH after splenectomy(2005)–(2011) is not simply explained by elevated platelet counts.
As proof‐of‐concept that the spleen affects thrombosis via circulating phospholipids, we analyzed thrombus phospholipid profiles of pulmonary endarterectomy (PEA) specimens from splenectomized CTEPH patients. To test the hypothesis that anionic phospholipids after splenectomy modulate the vascular remodeling of thrombus resolution, we interrogated a mouse model that recapitulates the time course, histological features, and evolution of venous thrombus resolution in humans.
Methods
Human Tissues
We collected surgical specimens from all splenectomized patients with CTEPH who underwent classic PEA at our institution (n=3). Four consecutive CTEPH patients undergoing PEA in the absence of prior splenectomy or other associated medical conditions(2009) were chosen to serve as controls. Tissues were harvested in phosphate‐buffered saline (PBS) containing 0.1% butylhydroxytoluol, 0.1% EDTA, and 0.1% dichloromethane‐soluble fraction and were immediately frozen in liquid nitrogen and stored at −80°C. Patients gave written informed consent under a study protocol that was approved by the Ethics Committee of the Medical University of Vienna.
Mouse Model of Splenectomy and Inferior Vena Cava Ligation
Female BALB/c mice (15 to 20 g body weight, 6 to 8 weeks old) were obtained from the Department of Laboratory Animal Science and Genetics, Core Unit for Biomedical Research, Medical University Vienna (Himberg, Austria) and were housed at the Institute of Biomedical Research, Medical University Vienna, under specific pathogen‐free conditions. For surgery, anesthesia was performed with 100 mg/kg ketamine and 5 mg/kg xylazine. In animals of the study group, splenectomy was performed 1 month before inferior vena cava (IVC) ligation through a lateral laparotomy to mobilize the spleen and ligate the spleen vessels through electrocoagulation. We also performed splenectomy 3 months before IVC ligation and obtained the same results as in the study group (data not shown). In parallel, sham‐operation was performed 1 month before IVC ligation in the control group. Sham‐operation involved the same technique and exposure time but without splenectomy.
For cava ligation, the IVC was exposed below the left renal veins through midline laparotomy. The intestines were retracted, and retroperitoneal blunt dissection of the IVC was performed to mobilize a 5‐mm segment distal of the left renal vein. A 5‐0 Prolene suture was placed alongside the IVC. A stenosis was produced in the vein by tying a 4‐0 silk suture around the vena cava to include the Prolene suture. The Prolene suture was then removed to allow blood to pass up the vein. The intestines were replaced, and the abdominal wall was sutured. The animals were then allowed to recover from anesthesia. Analgesia was performed using 0.05 mg/kg buprenorphine subcutaneously every 8 hours. Mice had access to water and conventional commercial chow ad libitum. We used 8 mice per group and time point. Baseline assessments were obtained before IVC ligation. Experiments were repeated in C57BL/6 mice, with the same results (data not shown). All animal studies were approved by the Austrian Ministry of Science.
Murine Tissue and Blood Harvest
One month after splenectomy (for baseline measurements) and on days 1, 3, 7, 14, and 28 after IVC ligation, mice from both groups (splenectomized and sham‐operated) were anesthetized as described earlier. Blood was obtained through cardiac puncture; 400 μL of whole blood was collected in syringes coated with EDTA for fluorescence‐activated cell sorting (FACS) analysis and processed immediately after blood sampling to keep ex vivo platelet activation as minimal as possible. Then, 200 μL of blood was used to perform a platelet count, a red blood cell count, and a leukocyte count. For this purpose, blood samples were analyzed within 30 minutes of sampling using a Cell‐Dyn 3500 analyzer (Abbott Laboratories).
Laparotomy was performed to excise the portion of IVC containing thrombus. On average, 5% of mice did not develop a thrombus distal to the ligation. We performed as many operations required to obtain 8 thrombi per group and time point. To facilitate analysis, the thrombus was considered to be a cylinder and volume was calculated by multiplying the thrombus cross‐sectional area (mm²) by the thrombus length (mm). Thrombus area and volume changes are expressed as percentages of the measurement at the preceding time point. After measurement of thrombus lengths, thrombi were dissected into 3 equal parts. For histological examination, 1 part was fixed immediately in 7.5% buffered formaldehyde. After dehydration through an ascending alcohol row, thrombi were embedded in paraffin. For lipid analysis, the second part was put in PBS containing 0.1% butylhydroxytoluol, 0.1% EDTA, and 0.1% dichloromethane‐soluble fraction and immediately frozen in liquid nitrogen and stored at −80°C until further use. The third part of the thrombus was embedded in RNAlater solution (Qiagen) and stored at −30°C for further analysis. All animal experiments were repeated at least 3 times.
Histological Examination of Mouse Thrombi
Three micrometer transverse thrombus sections were stained with a modified trichrome stain as previously described.(1987) Both early fibrin and red blood cells are shown by the use of lissamine fast yellow. Mature fibrin is stained through use of a combination of acid fuchsine, Biebrich scarlet, and Ponceau 2R (red), while collagen is visualized in green. Thrombus area quantification was achieved using an Olympus BX microscope equipped with the imaging software Axio (Version 3.0‐2002; Carl Zeiss Vision GmbH). Images were processed using Adobe Photoshop, version 7.0. Thrombus sections with the largest diameter were used for measurements. Sections within 10 μm of the largest cross‐sectional diameter were subjected to immunohistochemical analyses. All images were analyzed blindly. Thrombus size was also measured in a series of images of sections taken from 10 randomly selected animals by a second “blinded” observer. Because thrombi of control mice had almost completely resolved by day 28 after IVC ligation, day 28 was chosen as the last point of observation.
Analysis of Microparticles and Platelet Aggregates in Murine Blood
Peridinin chlorophyll protein complex (PerCP)‐conjugated anti‐mouse antibody against common leukocyte antigen (CD45), fluorescein isothiocyanate (FITC)‐labeled anti‐mouse antibody against glycoprotein IIb/IIIa (CD41), allophycocyanin (APC)‐conjugated anti‐mouse P‐selectin (CD62P) antibody, phycoerythrin (PE)‐labeled CD14 antibody, APC‐labeled platelet endothelial cell adhesion molecule (CD31) antibody, FITC‐labeled Ter119 antibody to stain murine erythroid cells; and PerCP‐, FITC‐, APC‐, and PE‐labeled isotype‐matched control antibodies were purchased from BD Biosciences.
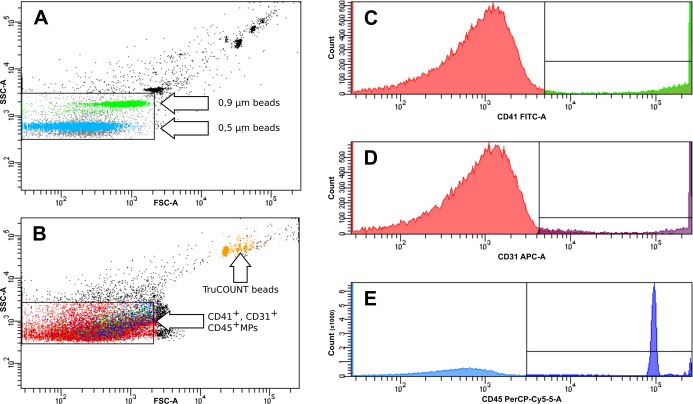
FACS analysis of microparticles (MPs) and leukocyte–platelet aggregates was carried out as described previously.(2011) Briefly, for MP analysis, EDTA‐anticoagulated whole blood was centrifuged at 2600g for 15 minutes to obtain platelet‐poor plasma, followed by a 5‐minute centrifugation of 9900g at room temperature to remove larger apoptotic bodies. Then, 25 μL of plasma and 4 μL of antibody (CD45–PerCP+CD41–FITC+CD31–APC or Ter119–FITC) or isotype‐matched controls were incubated shaking at room temperature in the dark for 20 minutes. Then, 500 μL of PBS was added, and the samples were transferred in TruCOUNT tubes (BD Biosciences) preloaded with a known quantity of fluorescent bead standards. Flow cytometry analysis was carried out within 60 minutes. Fluorescent Megamix beads (Biocytex) calibrated from 0.5 to 0.9 μm were used for initial settings and before each experiment to define an analysis window (gate) consistent with the size of MPs (<1 μm) with exclusion of background corresponding to debris that is usually present in buffers (raw data are shown in Figure 1).
Figure 1.
Representative flow cytometry density plots showing the gating protocol for microparticles (MPs). The gate of MPs was defined by the use of Megamix beads (Biocytex) containing fluorescent latex microbeads (0.5 and 0.9 μm). TruCOUNT tubes (BD Biosciences) preloaded with a known quantity of fluorescent bead standards were used to calculate absolute numbers of MPs (orange) (A). Representative density plot of detection of CD41+ (platelet derived, green), CD31+ (endothelial derived, violet), and CD45+ (leukocyte derived, blue) MPs using the MP gate defined in A (B). Representative fluorescence histograms showing detection of CD41+ (C), CD31+ (D), and CD45+ (E) MPs. All experiments were repeated 3 times. APC‐A indicates allophycocyanin; FITC, fluorescein isothiocyanate; PerCP, Peridin chlorophyll protein complex; SSC Side Scatter; FSC, Forward Scatter.
CD41+ (platelet‐derived MPs), Ter119+ (erythrocyte‐derived MPs), CD31+ (endothelial cell–derived MPs), and CD45+ (leukocyte‐derived MPs) cells were counted. The absolute number of MPs per milliliter was calculated by the formula provided by the manufacturer, using the actual number of TruCOUNT beads as specified in the tube's lot number. Isotype‐matched antibodies were used for negative controls. Experiments were repeated 3 times. For intra‐assay reproducibility, blood from 3 control mice was processed and labeled as described earlier, and platelet MPs were analyzed 10 times in total. The coefficient of variation was 8.6%.
For determination of leukocyte–platelet aggregates, 100 μL of EDTA‐anticoagulated whole blood was incubated with 4 μL of antibody simultaneously or isotype‐matched controls for 15 minutes at room temperature. Then, 1 mL of lysis solution (BD FACS lysing solution ×10 concentrate) was added during vortexing. Samples were incubated again for 15 minutes at room temperature in the dark. Then, the samples were centrifuged at 156g for 5 minutes. The supernatant was discarded, and 1 mL of PBS was added. Samples were vortexed and centrifuged again. This process was repeated 3 times. Flow cytometry was carried out within 60 minutes using a FACSCanto2 device with FACSDiva software (Becton Dickinson). Acquisition was stopped when 100 000 CD45+ events had been acquired. CD45+ cells were gated and CD45+CD41+CD62P+ (leukocyte–platelet aggregates) and CD45+CD14+CD41+CD62P+ (monocyte–platelet aggregates) cells were counted. Isotype controls were stained in the same way to reveal nonspecific binding.
Lipid Extraction and Electrospray Ionization–Mass Spectrometry
Human thrombus tissue and isolated mouse thrombi were homogenized, and total lipids were extracted with chloroform/methanol (2:1, v/v). Mass spectra were acquired in the m/z range 400 to 1200 (positive and negative mode) on a PE Sciex API 365 triple quadruple instrument equipped with an electrospray ion source. Total scan time was 90 seconds, corresponding to 18 individual scans, for each experiment. Precursor and neutral loss scanning of polar headgroups was used(2005) to assign the individual lipid species (m/z values) to the different phospholipid subsets present in thrombus samples. Precursor and neutral loss scanning of polar headgroups was used according to literature(2005) to assign the individual lipid species (m/z values) to the different phospholipid subsets present in thrombus samples.
Matrix‐Assisted Laser Desorption/Ionization–Mass Spectrometry
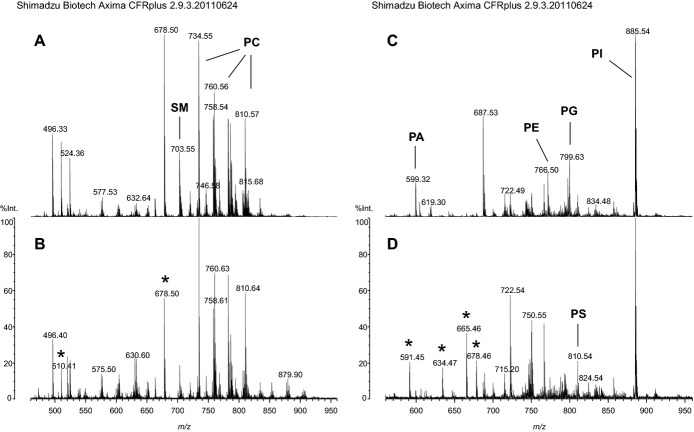
Mass spectra were obtained using a high‐resolution AXIMA‐CFRplus curved‐field reflectron time‐of‐flight mass spectrometer. Total lipid extracts (0.5 μL) containing non–naturally occurring phospholipid standards (Avanti Polar Lipids) belonging to the different phospholipid subsets were directly mixed on target with 0.5 μL of the matrix substances 2,4,6‐trihydroxyacetophenone or 9‐aminoacridine used for sample analysis.(2007)–(2008) Measurements were performed in the mass range between m/z 400 and 950 in either positive or negative ionization mode for the detection of cationic and anionic phospholipids, respectively (raw data are shown in Figure 2). Mass spectral calibration and semiquantitative analysis of individual phospholipid species according to assignments made by electrospray ionization–mass spectrometry were performed using the same internal phospholipid standards simultaneously. Variability between replicate analyses was in the range of <5% and up to 20% depending on the relative abundance of the individual lipid species. The same amount of synthetic phospholipids was added as internal standards to each sample, and values are expressed as the signal intensity ratio of the endogenous phospholipids to the signal of the corresponding phospholipid standards.
Figure 2.
Raw data from MALDI‐MS analysis of lipid extracts of murine thrombi harvested 14 days after IVC ligation. Mass spectra of splenectomized (A) and sham‐operated mice (controls) (B) recorded in positive mode showing the composition of cationic phospholipids and of splenectomized mice (C) and controls (D) recorded in negative mode showing the composition of anionic phospholipids are displayed. The peaks of most abundant phospholipid species of the different phospholipid classes are indicated, and peaks of the synthetic phospholipid standards added for quantitative evaluation are highlighted by asterisks. IVC indicates inferior vena cava; MALDI matrix‐assisted laser desorption/ionization; PA, phosphatidic acid; PC, phosphatidylcholine; PE, phosphatidylethanolamine, PG, phosphatidylglycerol; PI, phosphatidylinositol; PS, phosphatidylserine; SM, sphingomyelin.
Mass Spectral Data Analysis
Matrix‐assisted laser desorption/ionization–mass spectrometry data were processed by using the manufacturer‐supplied instrument software Launchpad 2.9 (Shimadzu) using the Savitzky‐Golay smoothing algorithm. Mass lists were exported to Microsoft Excel 2003 software package, and m/z values were filtered according to their assignment to the different phospholipid subsets. In a next step, signal intensity of the individual peaks was normalized to that of the internal phospholipid standards, and the resulting values were used for statistical analysis. Data are displayed as mean±SD of at least triplicate measurements (n≥3).
Systemic Phospholipid Treatment in the Mouse Model
For in vivo studies, phospholipid vesicles were prepared containing (1) 100% PC or (2) 60% PC/40% PS at a concentration of 3.75 mmol/L in sterile physiological saline. The organic solvent of the phospholipids was evaporated using dry nitrogen under argon stream to inhibit phospholipid oxidation. Vesicles were prepared fresh through sonication with a probe tip sonicator at 4°C. Mice (n=8 per group and time point) were injected with 150 μL of the respective phospholipid solution intravenously (1 day before IVC ligation and on days 1, 3, 7, 10, and 14 after IVC ligation) and with 150 μL of the respective phospholipid solution directly into the nascent thrombus on the day of the ligation. IVC ligation, anesthesia, thrombus harvest, and histological examination were performed as described earlier.
Immunohistochemistry of Mouse Thrombi
Biotinylated lectin (biotinylated GSL I–isolectin B4; Vector Labs) was used to detect mouse endothelial cells. Immunohistochemical analyses were performed as previously described.(1994) An Histostain SP kit (AEC Mouse Kit; Zymed Laboratories, Inc) appropriate for the primary antibody was used in the labeled‐[strept] avidin‐biotin technique. Lectin‐positive cells were counted using the imaging software as described earlier, and the number of positive cells per mm² thrombus area was documented. All counts and measurements were performed in a blinded fashion.
RNA Preparation and Real Time‐Reverse transcription Polymerase Chain Reaction (RT‐PCR)
Total thrombus RNA was extracted using the RNeasy Mini Kit (Qiagen). cDNA was synthesized from 2 μg of total RNA via reverse transcription (RT) (TaqMan Reverse Transcription Kit; Roche). Quantitative fluorogenic polymerase chain reaction (PCR) was performed in an ABI PRISM 7000 Sequence Detector (Applied Biosystems). Specific TaqMan primers and probes for extracellular signal–regulated kinase 5 (Erk5) (mm00839961_g1), vascular endothelial cadherin (Cdh5) (mm00486938_m1), kinase insert domain receptor (Kdr) (mm00440099_m1), platelet endothelial cell adhesion molecule 1 (Pecam1) (mm01246167_m1), nitric oxide synthase 3 (Nos3) (mm 00435204_m1), and podoplanin (Pdpn) (mm00494716_m1) were used (Applied Biosystems). PCR was performed under standard conditions: 40 cycles of denaturation at 95°C for 15 seconds and annealing/elongation at 60°C for 1 minute. The mRNA expression levels of the genes were normalized to endogenous 18S‐RNA (Hs00170014_m1, Applied Biosystems) levels. Because we obtained only very small RNA amounts from mouse thrombi, we pooled thrombi harvested on days 1 and 3 and those harvested on days 14 and 28 for the RT‐PCR experiments.
Cell Culture
Human umbilical vein endothelial cells (HUVECs) were isolated from umbilical cord vein by using collagenase and were grown in endothelial cell basal medium containing 0.4% endothelial cell growth supplement, 0.1 ng/mL recombinant human epidermal growth factor, 1 ng/mL recombinant human basic fibroblast growth factor, 1 μg/mL hydrocortisone, 90 μg/mL heparin (all from PromoCell‐supplement pack), and 2% FCS. HUVECs were used between passages 2 and 4.
Preparation of Phospholipid Vesicles
Phosphatidylcholine (PC), PS, and phosphatidylethanolamine (PE) (Avanti Polar Lipids) were dissolved in chloroform. Phospholipid vesicles were prepared, containing (1) 100% PC, (2) 60% PC/40% PS, (3) 60% PC/40% PE, and (4) 60% PC/20% PS/20% PE. Biological activity of the mixtures was confirmed via thrombin generation assay using thrombin substrate S2238, together with 50 nmol/L factor V, 1 nmol/L factor Xa, and 800 nmol/L prothrombin in HEPES‐buffered saline with Ca2+ buffer.
Bromodeoxyuridine Assay
Endothelial cell proliferation was determined by the amount of incorporated pyrimidine analogue bromodeoxyuridine (BrdU) using the cell proliferation BrdU‐ELISA kit from Roche according to the manufacturer's instructions. After 24 hours, HUVECs were treated with different concentrations of phospholipid mixtures (10, 50, and 100 μmol/L) diluted in endothelial cell basal medium with 0.2% FCS for 24 and 48 hours, respectively. Incubation with 2 ng/mL human basic fibroblast growth factor served as positive control. Absorbance was measured at 450 nm (reference wavelength 650 nm).
Endothelial Sprouting Assay (Spheroid Assay)
The effect of the different phospholipid mixtures on endothelial cell sprouting was investigated using a 3‐dimensional in vitro angiogenesis assay (spheroid assay).(1999) HUVECs were seeded in culture medium with 20% methylcellulose and aggregates (spheroids) formed over night. The washed spheroids were transferred to a fibrinogen solution and 0.65 U/mL thrombin was added to induce polymerization. Then, medium was replaced by endothelial cell basal medium with 1% FCS with 50 μmol/L or 100 μmol/L phospholipid mixtures and 50 ng/mL vascular endothelial growth factor (VEGF) for 48 hours. VEGF served as positive stimulus, so that an inhibitory effect could be detected. The angiogenic response was quantified by determination of the average total length of sprouts per spheroid. For each condition, 10 spheroids were analyzed.(2006)
Statistical Analyses
The significance of intergroup differences was determined by using unpaired 2‐tailed Student t test and analysis of variance because all data were normally distributed. P values <0.05 (95% confidence interval) were considered significant. For human data analysis, the Mann–Whitney U test was used. Statistical analyses were performed using IBM SPSS version 20 and GraphPad Prism 6 for area and volume changes. All results are expressed as means±SD or medians and ranges (Figure 3 and Table).
Figure 3.
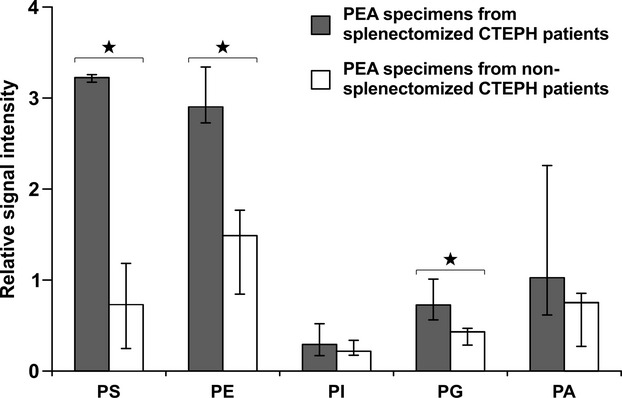
Phospholipid profiles of human pulmonary endarterectomy specimens. Phosphatidylserine (PS), phosphatidylethanolamine (PE), phosphatidylinositol (PI) phosphatidylglycerine (PG), and phosphatidic acid (PA) signal intensity is expressed as a ratio between signal intensity of the respective phospholipid and the sum of the signal intensities of the cationic phospholipids phosphatidylcholine (PC) and sphingomyelin (SM) in surgical material of splenectomized (black bars) and nonsplenectomized (open bars) CTEPH patients. Values represent medians and ranges (3 splenectomized CTEPH patients, 4 nonsplenectomized CTEPH patients). *P<0.05. CTEPH indicates chronic thromboembolic pulmonary hypertension; IVC, inferior vena cava; PEA, pulmonary endarterectomy.
Table 1.
Baseline Clinical and Hemodynamic Characteristics of Splenectomized and NonSplenectomized CTEPH Patients Undergoing PEA (Medians and Ranges Are Shown)
| Splenectomized CTEPH Patients (n=3) | NonSplenectomized CTEPH Patients (n=4) | P Value* | |
|---|---|---|---|
| Age, y | 58 (54 to 62) | 64 (57 to 69) | 0.22 |
| Sex, M/F | 1/2 | 4/0 | 0.14† |
| 6‐min walk distance, m | 377 (250 to 403) | 433 (340 to 501) | 0.29 |
| mPAP, mm Hg | 57 (41 to 71) | 51 (46 to 68) | 0.72 |
| mPAWP, mm Hg | 12 (6 to 13) | 12 (8 to 15) | 0.72 |
| CO, L/min per m2 | 4.4 (4.1 to 5.2) | 4.9 (4.1 to 5.2) | 0.71 |
| PVR, dyne/s per cm−5 | 811 (743 to 1755) | 547 (523 to 1171) | 0.18 |
| C‐reactive protein, mg/L | 5 (1 to 20) | 2 (1 to 6) | 0.48 |
| Fibrinogen, g/L | 4.8 (4.5 to 5.7) | 3.4 (2.7 to 4.9) | 0.16 |
| Leukocytes, ×109/L | 6.1 (5 to 7.3) | 5.6 (4.2 to 6.6) | 0.48 |
| Erythrocytes, ×1012/L | 4.6 (4.5 to 5.5) | 4.8 (4.7 to 5.2) | 0.48 |
| Platelets, ×109/L | 328 (236 to 365) | 278 (152 to 280) | 0.29 |
| Platelet microparticles, U/μL | 4087 (426 to 6638) | 693 (604 to 913) | 0.03 |
CO indicates cardiac output; CTEPH, chronic thromboembolic pulmonary hypertension; mPAP, mean pulmonary artery pressure; mPAWP, mean pulmonary arterial wedge pressure; PEA, pulmonary endarterectomy; PVR, pulmonary vascular resistance.
*All P values by Mann–Whitney U test except †Fisher's exact test.
Results
Anionic Phospholipids Are Accumulated in PEA Specimens From CTEPH Patients Who Had Undergone Prior Splenectomy
We analyzed thrombotic material obtained during PEA of 7 representative CTEPH patients (61±5 years, 29% females), 3 of whom had undergone prior splenectomy for trauma 11 to 32 years earlier (Table). We observed mildly elevated platelet counts and C‐reactive protein levels in patients with prior splenectomy, without statistical significance. Platelet‐derived MPs were significantly increased in splenectomized CTEPH patients (Table). Mass spectral analysis of PEA specimens from patients after splenectomy revealed significantly elevated levels of the anionic phospholipids PS and phosphatidylglycerol compared with samples from CTEPH patients with a spleen. Also, the neutral phospholipid PE, which is normally expressed on the inner side of the cell membrane, was significantly increased (Figure 3).
Splenectomy in a Mouse Model of Human DVT Delays Thrombus Resolution
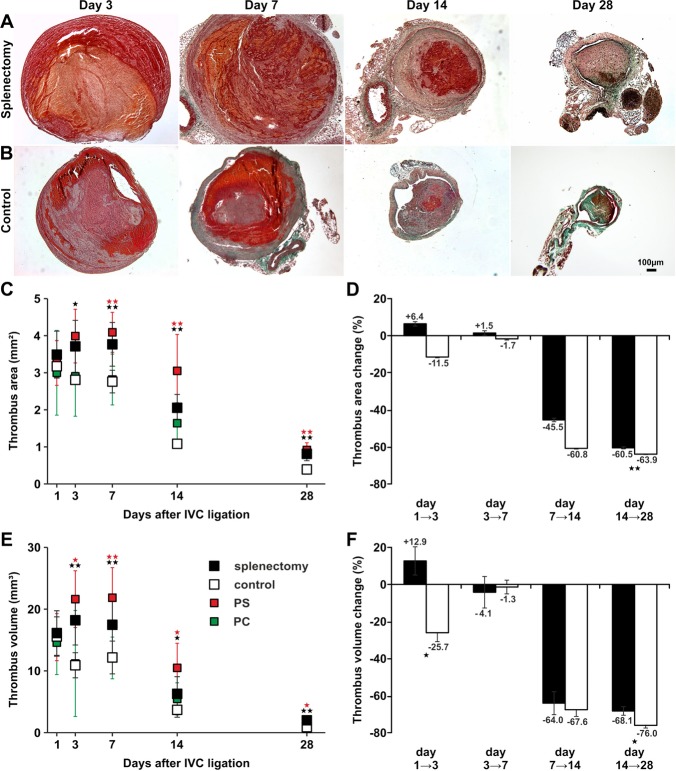
To analyze the effect of splenectomy on thrombus resolution in a model, we compared thrombus cross‐sectional areas and volumes between splenectomized and sham‐operated mice (subsequently called “controls”). Cross‐sectional area analyses revealed that thrombi after splenectomy were significantly larger than control thrombi on days 3, 7, 14, and 28, while they did not differ significantly on day 1 (Figure 4A through 4C). Thrombus cross‐sectional areas reached a maximum on day 7 and declined continuously until day 28 in splenectomized mice, whereas thrombus cross‐sectional areas of controls decreased gradually from day 1 after IVC ligation (Figure 4C). By day 28, thrombi of controls had almost completely resolved, whereas thrombus resolution was significantly delayed after splenectomy. Relative thrombus area change was significantly different between days 14 to 28 (Figure 4D), between days 3 and 28, and between days 7 and 28. Thrombus volume after splenectomy was significantly larger on days 3, 7, 14, and 28 after IVC ligation with a maximum volume on day 3 (Figure 4E). Similar thrombus area change, relative thrombus volume change was significant between days 1 and 3 (relative thrombus volume changes corresponding to an increase in splenectomized mice) and between days 14 and 28 (Figure 4F), as well as between days 7 and 28 (relative thrombus volume changes corresponding to a diminished decrease in splenectomized mice), suggesting a biphasic resolution process after splenectomy, with initial growth, followed by delayed resolution between days 7 and 28.
Figure 4.
Remodeling of vascular thrombosis in a mouse model of stagnant flow venous thrombosis. Trichrome stains of thrombi harvested on days 3, 7, 14, and 28 after IVC ligation in mice after splenectomy (A) and in controls (B). Representative results from 8 independent experiments per time point and study group are shown. Bar represents 100 μm. Cross‐sectional area (C), relative area change (D), volume (E), and relative volume change (F) of thrombi after splenectomy (closed symbols), of control thrombi (open symbols), after intravenous injection of PS (red symbols), and after injection of PC (green symbols) at defined time points after IVC ligation. All values represent the mean±SD (n=8). *P<0.05, **P<0.03 by t test comparing means between thrombi of splenectomized mice and controls (black asterisks) and between thrombi after PS injection and controls (red asterisks). Data points were not connected because every data point represents 8 animals that were killed. IVC indicates inferior vena cava; PC, phosphatidylcholine; PS, phosphatidylserine.
Platelet MP Counts Are Elevated After Experimental Splenectomy
No significant differences were observed in total platelet or erythrocyte counts between splenectomized mice and controls (Figure 5A and 5C). In contrast, platelet‐derived MPs were significantly increased in whole blood at baseline and 14 and 28 days after IVC ligation (Figure 5B; representative raw data are shown in Figure 1). Erythrocyte MPs were not significantly increased following splenectomy (Figure 5D). The ratio between platelet MPs and erythrocyte MPs was similar in both groups at early time points, whereas it was significantly higher in splenectomized mice on day 14 (Figure 6A). We observed that the majority of cell‐derived MPs were of platelet origin (Figure 6B) after splenectomy. Because platelet MPs carry procoagulant activity, we analyzed leukocyte–platelet aggregates (CD45+CD41+CD62P+ cells), and monocyte–platelet aggregates (CD45+CD14+CD41+CD62P+ cells). Leukocyte–platelet aggregates and monocyte–platelet aggregate formations were increased on days 14 and 28 in circulating blood from splenectomized mice (Figure 5G and H). There was no difference in total leukocyte and neutrophil counts (Figure 5E and 3F).
Figure 5.
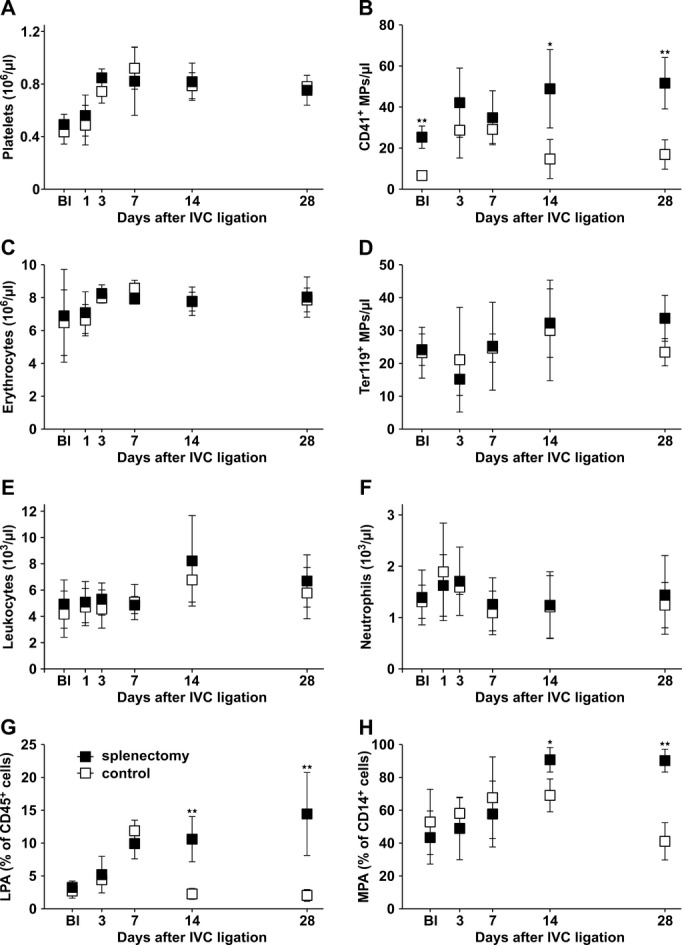
Circulating cell counts and MP counts in whole blood of splenectomized mice and controls. Platelet counts (A) and platelet MPs (CD41+) (B), erythrocyte counts (C), erythrocyte MPs (Ter119+) (D), leukocytes (E), neutrophils (F), leukocyte–platelet aggregates (LPAs, CD45+CD41+CD62P+ cells) (G), and monocyte–platelet aggregates (MPAs; CD45+CD14+CD41+CD62P+ cells) (H) in whole blood of mice after splenectomy (closed symbols) and controls (open symbols) at defined time points after IVC ligation. Bl indicates values at baseline before IVC ligation 1 month after splenectomy or sham‐splenectomy respectively (A through H). All values represent means±SD (n=8). *P<0.05, **P<0.03. IVC indicates inferior vena cava; MP, microparticles.
Figure 6.
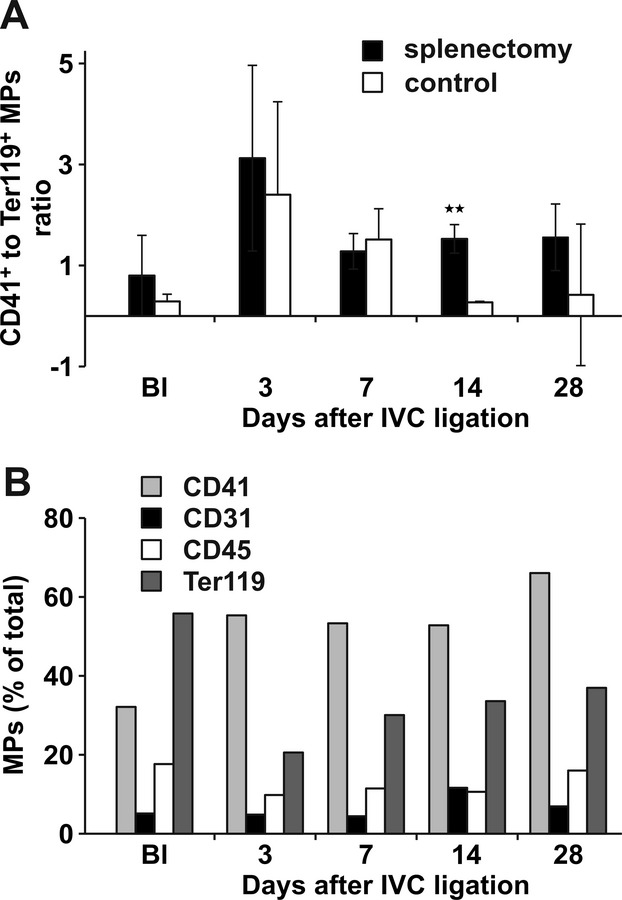
Characteristics of circulating mouse microparticles (MPs). Ratios of platelet MPs (CD41+) to erythrocyte MPs (Ter119+) detected by FACS in whole blood of mice after splenectomy (filled bars) and controls (open bars). Bl indicates values at baseline before IVC ligation. *P<0.05, **P<0.03 (A). Distribution of cell‐derived MPs in whole blood of splenectomized mice (B). Bl indicates values at baseline before IVC ligation. *P<0.05, **P<0.03. FACS indicates fluorescence‐activated cell sorting; IVC, inferior vena cava.
Procoagulant Phospholipid Profiles in Murine Thrombi After Splenectomy
Because damaged and apoptotic cells surface‐express negatively charged phospholipids and the spleen is thought to function as a filter for these cell remnants, we analyzed the content of anionic phospholipids in thrombi after splenectomy and in controls using electrospray ionization‐mass spectrometry and matrix‐assisted laser desorption/ionization–mass spectrometry. Thrombi of splenectomized mice contained significantly more anionic phospholipids such as PS and phosphatidylglycerol. The contents of the anionic phospholipids phosphatidylinositol and phosphatidic acid were also higher in thrombi after splenectomy, especially at later time points, although these differences did not reach statistical significance. Like in human PEA specimens, PE was significantly increased after splenectomy. To compare relative amounts of phospholipids in various thrombi, we correlated negatively charged phospholipids with cationic phospholipids, PC, and sphingomyelin in each sample (Figure 7A through 7E; representative raw data are shown in Figure 2). We confirmed that anionic phospholipids selectively accumulate in murine thrombi after splenectomy.
Figure 7.
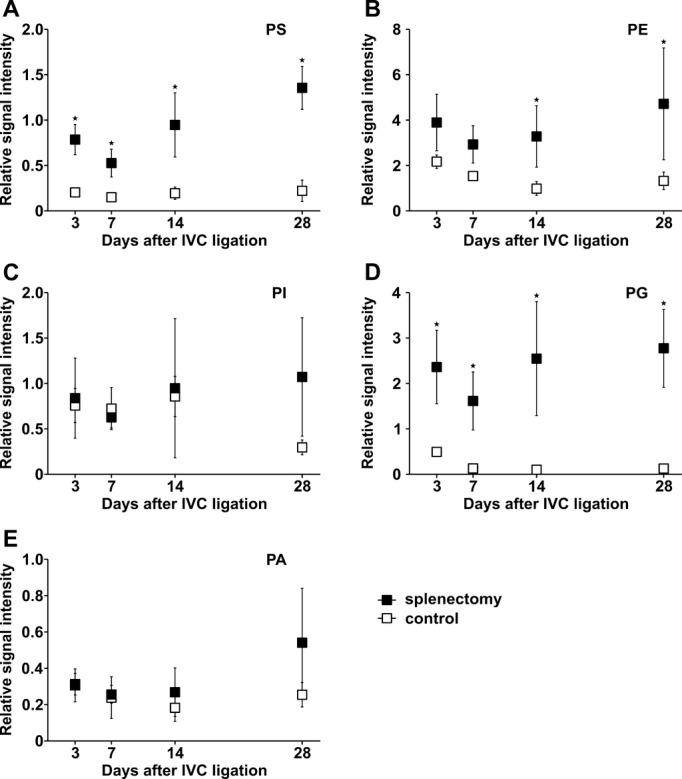
Phospholipid profiles of mouse thrombi. Phosphatidylserine (PS) (A), phosphatidylethanolamine (PE) (B), phosphatidylinositol (PI) (C), phosphatidylglycerine (PG) (D), and phosphatidic acid (PA) (E) signal intensity expressed as ratio between signal intensity of the respective phospholipid and the sum of the signal intensities of the cationic phospholipids phosphatidylcholine (PC) and sphingomyelin (SM) in thrombus homogenates of splenectomized mice (closed symbols) and controls (open symbols) at defined time points after IVC ligation. All values represent means±SD (n=8). *P<0.05. IVC indicates inferior vena cava.
Circulating Anionic Phospholipids Delay Thrombus Resolution In Vivo
Injection of PS‐rich phospholipid vesicles in the tail vein of intact mice had similar effects on thrombus resolution as splenectomy: thrombi were significantly larger on days 7, 14, and 28 than in controls (Figure 4C). Also, thrombus volume was significantly larger on days 3, 7, 14, and 28 after injection of PS (Figure 4E). Injection of the neutral phospholipid PC had no effect on thrombus size (data not shown).
Reduced Vascular Recanalization of Thrombus After Splenectomy
Neovascularization is an important step in thrombus resolution, and enhanced angiogenesis contributes to restoration of the vein lumen.(2011) To investigate neovascularization of thrombi in our model, we performed immunohistochemical staining of isolectin B4, which is associated with microvessel formation.(2011) Isolectin B4+ cells appeared in the subperipheral zone of the thrombus by day 3, later appeared in the center of the thrombus, and reached a maximum on day 14 in controls. In thrombi of splenectomized mice, appearance of isolectin B4+ cells was significantly delayed (Figure 8). To quantify vascular cells, we investigated the expression of angiogenesis‐related genes in thrombi of both groups. We observed that mRNA levels of Erk5 (Figure 9A), VE‐Cadherin (Figure 9B), Kdr (Figure 9C), Nos3 (Figure 9D), and Pecam1 (Figure 9E) were diminished in thrombi of splenectomized mice. mRNA expression levels of each gene were normalized to the corresponding level of a respective control on day 1, which was set to zero. Relative mRNA levels of podoplanin, a small mucin‐like transmembrane glycoprotein, which is highly expressed on the surface of lymphatic endothelial cells,(1999) were also significantly decreased in thrombi after splenectomy (Figure 9F).
Figure 8.

Lectin immunoreactivity as a marker for microvessel density in mouse thrombi. Isolectin B4+ (IB4+) cells in a representative thrombus after splenectomy (A) and in a control thrombus (B) 14 days after IVC ligation. Channels lined with IB4+ cells were more frequent in control thrombi than in thrombi after splenectomy. Bar represents 100 μm. Quantification of thrombus IB4+ cells in splenectomized mice (filled bars) and controls (open bars) (C). All values represent means±SD (n=8). *P<0.05, **P<0.03. IVC indicates inferior vena cava.
Figure 9.
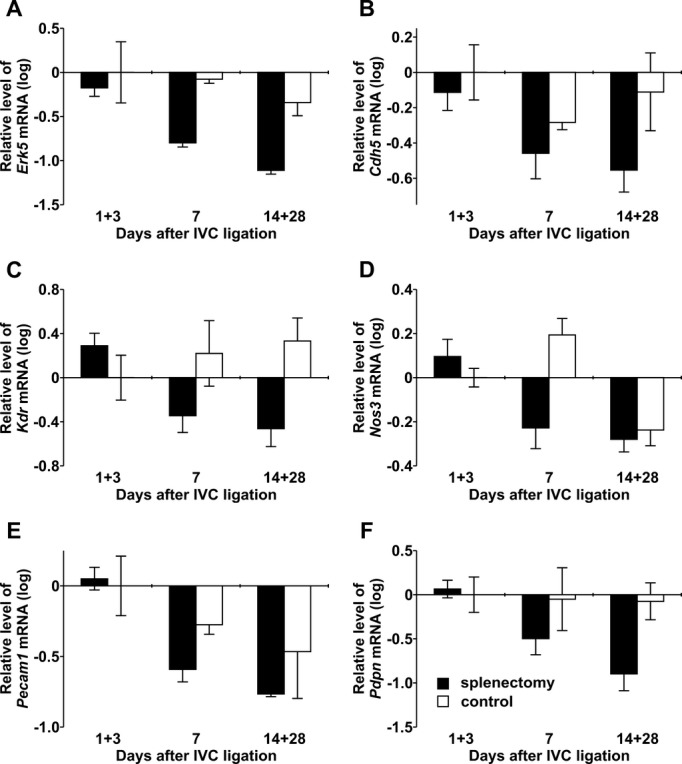
Angiogenesis‐related gene expression in mouse thrombi. mRNA levels for Erk5 (A), VE‐Cadherin (Cdh5) (B), Kdr (C), Nos3 (D), Pecam1 (E), and podoplanin (Pdpn) (F) determined by real‐time PCR in thrombi of splenectomized animals (filled bars) and controls (open bars) at defined days after IVC ligation. IVC indicates inferior vena cava; PCR, polymerase chain reaction.
The Effect of Anionic Phospholipids on Endothelial Cell Proliferation
We hypothesized that thrombus‐borne phospholipids after splenectomy may affect not only the enlargement of acute thrombus by accelerating platelet aggregation(2008) but also thrombus angiogenesis and thrombus resolution. Therefore, HUVECs were incubated with different mixtures of phospholipid vesicles, followed by measurement of BrdU incorporation into newly synthesized DNA of actively proliferating cells. After incubation for 24 hours with phospholipid vesicles containing 40% PS/60% PC, proliferation was significantly decreased compared to incubation with 100% PC. Incubation with phospholipid vesicles containing 20% PE/20% PS/60% PC also decreased proliferation significantly. Incubation with a mixture containing 40% PE/60% PC did not differ from incubation with 100% PC (Figure 10A). After incubation for 48 hours with the same mixtures, we obtained similar results (Figure 10B). However, the inhibition of DNA synthesis was concentration dependent. Biological activity of the mixtures was confirmed by using a thrombin generation assay (Figure 10C). A lactate dehydrogenase assay confirmed a lack of cytotoxicity of phospholipids on HUVECs (data not shown). Furthermore, in an in vitro 3‐dimensional angiogenesis assay, the effect of these phospholipid mixtures on endothelial sprout formation was investigated. When spheroids were treated with 50 ng/mL VEGF and the respective phospholipid mixtures, those containing PS significantly reduced the stimulatory effect of VEGF (Figure 10D).
Figure 10.
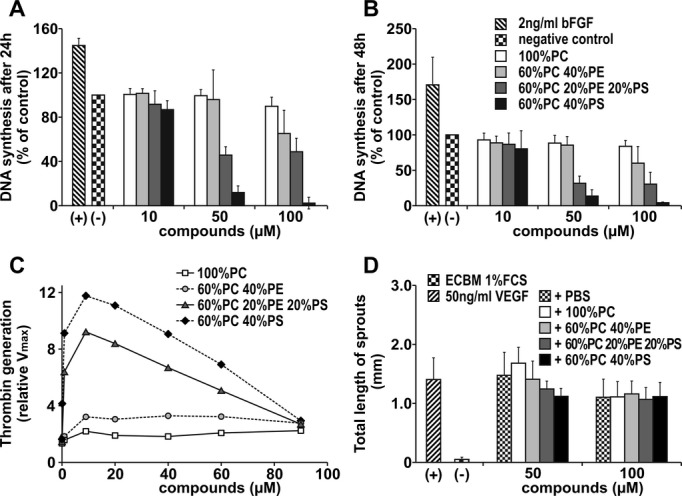
Effect of phospholipids on endothelial cell proliferation. Effect of phospholipids on HUVEC proliferation was evaluated in a BrdU assay. Bars illustrate DNA synthesis rates after incubation with different concentrations of phospholipid mixtures after 24 hours (A) and 48 hours (B). Values determined in the absence of any additions were set at 100% (control). Thrombin generation rates of different phospholipid mixtures were measured with chromogenic substrate S2238, together with components of the prothrombinase complex. Values determined in the presence of buffer alone were set at 1 (control) (C). Angiogenic potential of various phospholipid mixtures was measured in the spheroid assay. Spheroids were treated with 50 ng/mL VEGF together with the compounds for 48 hours. Bars illustrate mean total length of sprouts of a spheroid (D). Assays were repeated 3 times and performed in triplicate. All values represent means±SD. Groups were statistically different (ANOVA, P<0.05) except those after treatment with 100 μmol/L phospholipids in Figure 10D. ECBM indicates endothelial cell basal medium; HUVEC, human umbilical vein endothelial cell; PBS, phosphate‐buffered saline; PC, phosphatidylcholine; PE, phosphatidylethanolamine; PS, phosphatidylserine; VEGF, vascular endothelial growth factor.
These observations confirm that anionic phospholipids inhibit proliferation and angiogenesis in vitro.
Discussion
We observed that thrombi of CTEPH patients who had undergone previous splenectomy display a significant enrichment of anionic phospholipids (Figure 3), which may represent a key mechanism underlying the persistence of venous thrombi. For proof‐of‐concept, we used a mouse model of stagnant flow venous thrombosis resembling human DVT. In this model, in which thrombus formation and thrombus resolution are inextricably overlapped we observed an initial phase of increased thrombus formation, followed by delayed thrombus resolution when splenectomy was performed 1 month earlier. This observation was accompanied by (1) an increase of the anionic component of thrombus‐borne phospholipids and (2) reduced isolectin B4+ cells and angiogenesis‐related gene expressions within thrombi.
While platelet and leukocyte counts tended to be higher in patients after splenectomy (Table), circulating cell numbers were not relevant in the mouse model (Figure 5A, 5C, 5E, and 5F). However, platelet‐derived MPs were significantly increased in blood of splenectomized mice compared with controls before thrombus induction (Figure 3B). MPs are fragments of plasma membranes of <1 μm in diameter and can be shed from various cell types on activation or apoptosis.(2010) MPs are procoagulant because they provide a negatively charged surface for the assembly of components of coagulation proteases, contributing to thrombin generation, and platelet–leukocyte interactions.(2010) In the early phase of thrombosis, counts of platelet MPs representing the majority of MPs (Figure 6B) were substantially increased (Figure 5B), similar to observations in humans,(2008) and may account for the initial thrombus growth in splenectomized mice. Platelets are activated by anionic phospholipids accelerating the formation of complexes with leukocytes (Figure 5G), in particular, monocytes (Figure 5H).
In contrast, the anionic phospholipids PS and phosphatidylglycerol, as well as the neutral phospholipid PE, increased in the later phase of vascular remodeling (Figure 7), suggesting that their cellular effects may be primarily driving the delay in thrombus resolution. During apoptosis, loss of membrane phospholipid asymmetry is occurring.(2010) The translocation of phospholipids such as PS to the outer leaflet of the erythrocyte membrane dose‐dependently supports coagulation by acting as cofactors for proteolytic reactions that are triggered by coagulation factors (1998) (Figure 7).
In addition to an immediate effect on coagulation through the exposure of annexin V–binding sites and tissue factor, anionic phospholipids affect thrombus angiogenesis.
Angiogenesis is a key event in the remodeling of vascular thrombosis.(2005) In clinical studies, inhibition of angiogenesis with the VEGF receptor blockers sorafenib and sunitinib increased the risk of thromboembolic events.(2010) The importance of angiogenesis in thrombus resolution is in line with our observation that, 14 days after IVC ligation, control thrombi were “perforated” with multiple vessel‐like formations detaching the thrombus body from the vein wall. In contrast, thrombi from splenectomized mice appeared dense and tightly attached to the wall, and they contained fewer vessels (Figure 8). We were able to demonstrate that nonresolution was associated with low expression of angiogenesis‐related genes. Lymphangiogenesis is also compromised after splenectomy, as illustrated by a decreased expression of podoplanin, a transmembrane glycoprotein expressed on the surface of lymphatic endothelial cells (Figure 9F). Whether a lack of specific lymphatic cells contributes to thrombus nonresolution is a subject of further research. Anionic phospholipids, particularly PS, significantly inhibited DNA synthesis rates in endothelial cells, compared with cationic and neutral phospholipids, and inhibited endothelial sprout formation in a 3‐dimensional angiogenesis assay (Figure 10). PS may inhibit angiogenesis via the ubiquitously expressed brain‐specific angiogenesis inhibitor‐1. This adhesion‐type G protein–coupled receptor binds PS on apoptotic cells and has been shown to inhibit in vivo neovascularization.(2007)–(2005)
Patient numbers are small because splenectomized CTEPH patients benefit much less from PEA and are commonly technically nonoperable.(2005) Therefore, differences in hemodynamics and inflammation parameters (ie, leukocyte counts, fibrinogen) were not statistically significant (Table) but were in accordance with previous reports.(2007) Higher numbers of platelet MPs (Table) and platelet–leukocyte aggregates (data not shown) may account for the more severe phenotype, with more severe distal arteriopathy and small vessel occlusive vascular remodeling in these patients. The use of the IVC mouse model to replicate human disease in the pulmonary arteries may be an inference. However, this model is well established to study thrombus nonresolution.(2005),(2008)–(2003) Furthermore, thrombus histologies were strikingly similar to those of organizing DVT or CTEPH thrombi, which generally resemble organized thrombi in the deep veins (Figure 4). (1994) Besides the simplistic concept of the spleen serving as a filter, other sequela of splenectomy may be more important. For example, the loss of innate immune cells as a consequence of splenectomy may deserve further investigation.
Taken together, our data demonstrate a disease‐relevant link between splenectomy and the vascular remodeling of thrombosis as it occurs in CTEPH. As a consequence of thrombus induction after splenectomy, platelet MPs accumulate in the early phase of thrombosis, and thrombus‐borne phospholipid profiles are shifted toward anionic components that impede subsequent thrombus angiogenesis. These insights shed new light on pathological remodeling of thrombosis, applying to CTEPH and possibly also to mechanisms of DVT recurrence.
Acknowledgments
The authors would like to thank Dr Omar Belgacem (Shimadzu, Manchester, UK) for providing the mass spectrometry instrumentation used in this study.
Sources of Funding
This research project received financial support from the European Commission under the 6th Framework Programme (contract LSHM‐CT‐2005‐018725, PULMOTENSION) and from the Medical Science Fund of the Mayor of the City of Vienna (contract 11047).
Disclosures
None.
References
- Stamou KM, Toutouzas KG, Kekis PB, Nakos S, Gafou A, Manouras A, Krespis E, Katsaragakis S, Bramis J. Prospective study of the incidence and risk factors of postsplenectomy thrombosis of the portal, mesenteric, and splenic veins. Arch Surg. 2006; 141:663-669 [DOI] [PubMed] [Google Scholar]
- Thomsen RW, Schoonen WM, Farkas DK, Riis A, Fryzek JP, Sorensen HT. Risk of venous thromboembolism in splenectomized patients compared with the general population and appendectomized patients: a 10‐year nationwide cohort study. J Thromb Haemost. 2010; 8:1413-1416 [DOI] [PubMed] [Google Scholar]
- Lang IM, Klepetko W. Chronic thromboembolic pulmonary hypertension: an updated review. Curr Opin Cardiol. 2008; 23:555-559 [DOI] [PubMed] [Google Scholar]
- Bonderman D, Jakowitsch J, Adlbrecht C, Schemper M, Kyrle PA, Schonauer V, Exner M, Klepetko W, Kneussl MP, Maurer G, Lang I. Medical conditions increasing the risk of chronic thromboembolic pulmonary hypertension. Thromb Haemost. 2005; 93:512-516 [DOI] [PubMed] [Google Scholar]
- Bonderman D, Wilkens H, Wakounig S, Schafers HJ, Jansa P, Lindner J, Simkova I, Martischnig AM, Dudczak J, Sadushi R, Skoro‐Sajer N, Klepetko W, Lang I. Risk factors for chronic thromboembolic pulmonary hypertension. Eur Respir J. 2009; 33:325-331 [DOI] [PubMed] [Google Scholar]
- Condliffe R, Kiely DG, Gibbs JS, Corris PA, Peacock AJ, Jenkins DP, Goldsmith K, Coghlan JG, Pepke‐Zaba J. Prognostic and aetiological factors in chronic thromboembolic pulmonary hypertension. Eur Respir J. 2009; 33:332-338 [DOI] [PubMed] [Google Scholar]
- Jais X, Ioos V, Jardim C, Sitbon O, Parent F, Hamid A, Fadel E, Dartevelle P, Simonneau G, Humbert M. Splenectomy and chronic thromboembolic pulmonary hypertension. Thorax. 2005; 60:1031-1034 [DOI] [PMC free article] [PubMed] [Google Scholar]
- Pepke‐Zaba J, Delcroix M, Lang I, Mayer E, Jansa P, Ambroz D, Treacy C, D'Armini AM, Morsolini M, Snijder R, Bresser P, Torbicki A, Kristensen B, Lewczuk J, Simkova I, Barbera JA, de Perrot M, Hoeper MM, Gaine S, Speich R, Gomez‐Sanchez MA, Kovacs G, Hamid AM, Jais X, Simonneau G. Chronic thromboembolic pulmonary hypertension (CTEPH): results from an international prospective registry. Circulation. 2011; 124:1973-81 [DOI] [PubMed] [Google Scholar]
- Kuypers FA. Phospholipid asymmetry in health and disease. Curr Opin Hematol. 1998; 5:122-131 [DOI] [PubMed] [Google Scholar]
- Cappellini MD, Robbiolo L, Bottasso BM, Coppola R, Fiorelli G, Mannucci AP. Venous thromboembolism and hypercoagulability in splenectomized patients with thalassaemia intermedia. Br J Haematol. 2000; 111:467-473 [DOI] [PubMed] [Google Scholar]
- Moshtaghi‐Kashanian GR, Gholamhoseinian A, Hoseinimoghadam A, Rajabalian S. Splenectomy changes the pattern of cytokine production in beta‐thalassemic patients. Cytokine. 2006; 35:253-257 [DOI] [PubMed] [Google Scholar]
- Ho KM, Yip CB, Duff O. Reactive thrombocytosis and risk of subsequent venous thromboembolism: a cohort study. J Thromb Haemost. 2012; 10:1768-1774 [DOI] [PubMed] [Google Scholar]
- Kashuk JL, Moore EE, Johnson JL, Biffl WL, Burlew CC, Barnett C, Sauaia A. Progressive postinjury thrombocytosis is associated with thromboembolic complications. Surgery. 2010; 148:667-674 [DOI] [PubMed] [Google Scholar]
- Valade N, Decailliot F, Rebufat Y, Heurtematte Y, Duvaldestin P, Stephan F. Thrombocytosis after trauma: incidence, aetiology, and clinical significance. Br J Anaesth. 2005; 94:18-23 [DOI] [PubMed] [Google Scholar]
- Boxer MA, Braun J, Ellman L. Thromboembolic risk of postsplenectomy thrombocytosis. Arch Surg. 1978; 113:808-809 [DOI] [PubMed] [Google Scholar]
- Garvey W, Fathi A, Bigelow F, Carpenter B, Jimenez C. A combined elastic, fibrin and collagen stain. Stain Technol. 1987; 62:365-368 [DOI] [PubMed] [Google Scholar]
- Stahl AL, Sartz L, Karpman D. Complement activation on platelet‐leukocyte complexes and microparticles in enterohemorrhagic escherichia coli‐induced hemolytic uremic syndrome. Blood. 2011; 117:5503-5513 [DOI] [PubMed] [Google Scholar]
- Taguchi R, Houjou T, Nakanishi H, Yamazaki T, Ishida M, Imagawa M, Shimizu T. Focused lipidomics by tandem mass spectrometry. J Chromatogr B Analyt Technol Biomed Life Sci. 2005; 823:26-36 [DOI] [PubMed] [Google Scholar]
- Stubiger G, Belgacem O. Analysis of lipids using 2,4,6‐trihydroxyacetophenone as a matrix for MALDI mass spectrometry. Anal Chem. 2007; 79:3206-3213 [DOI] [PubMed] [Google Scholar]
- Sun G, Yang K, Zhao Z, Guan S, Han X, Gross RW. Matrix‐assisted laser desorption/ionization time‐of‐flight mass spectrometric analysis of cellular glycerophospholipids enabled by multiplexed solvent dependent analyte‐matrix interactions. Anal Chem. 2008; 80:7576-7585 [DOI] [PMC free article] [PubMed] [Google Scholar]
- Lang IM, Marsh JJ, Olman MA, Moser KM, Loskutoff DJ, Schleef RR. Expression of type 1 plasminogen activator inhibitor in chronic pulmonary thromboemboli. Circulation. 1994; 89:2715-2721 [DOI] [PubMed] [Google Scholar]
- Korff T, Augustin HG. Tensional forces in fibrillar extracellular matrices control directional capillary sprouting. J Cell Sci. 1999; 112:3249-3258 [DOI] [PubMed] [Google Scholar]
- Hoffmann J, Alt A, Lin J, Lochnit G, Schubert U, Schleicher E, Chavakis T, Brownlee M, Van der Woude FJ, Preissner KT, Hammes HP. Tenilsetam prevents early diabetic retinopathy without correcting pericyte loss. Thromb Haemost. 2006; 95:689-695 [PubMed] [Google Scholar]
- Evans CE, Humphries J, Waltham M, Saha P, Mattock K, Patel A, Ahmad A, Wadoodi A, Modarai B, Burnand K, Smith A. Upregulation of hypoxia‐inducible factor 1 alpha in local vein wall is associated with enhanced venous thrombus resolution. Thromb Res. 2011; 128:346-351 [DOI] [PMC free article] [PubMed] [Google Scholar]
- Kang KT, Allen P, Bischoff J. Bioengineered human vascular networks transplanted into secondary mice reconnect with the host vasculature and re‐establish perfusion. Blood. 2011; 118:6718-6721 [DOI] [PMC free article] [PubMed] [Google Scholar]
- Breiteneder‐Geleff S, Soleiman A, Kowalski H, Horvat R, Amann G, Kriehuber E, Diem K, Weninger W, Tschachler E, Alitalo K, Kerjaschki D. Angiosarcomas express mixed endothelial phenotypes of blood and lymphatic capillaries: podoplanin as a specific marker for lymphatic endothelium. Am J Pathol. 1999; 154:385-394 [DOI] [PMC free article] [PubMed] [Google Scholar]
- Urbanus RT, Derksen RH, de Groot PG. Platelets and the antiphospholipid syndrome. Lupus. 2008; 17:888-894 [DOI] [PubMed] [Google Scholar]
- Mause SF, Ritzel E, Liehn EA, Hristov M, Bidzhekov K, Muller‐Newen G, Soehnlein O, Weber C. Platelet microparticles enhance the vasoregenerative potential of angiogenic early outgrowth cells after vascular injury. Circulation. 2010; 122:495-506 [DOI] [PubMed] [Google Scholar]
- Owens AP, III, Mackman N. Microparticles in hemostasis and thrombosis. Circ Res. 2010; 108:1284-1297 [DOI] [PMC free article] [PubMed] [Google Scholar]
- Fontana V, Jy W, Ahn ER, Dudkiewicz P, Horstman LL, Duncan R, Ahn YS. Increased procoagulant cell‐derived microparticles (C‐MP) in splenectomized patients with ITP. Thromb Res. 2008; 122:599-603 [DOI] [PubMed] [Google Scholar]
- Bevers EM, Williamson PL. Phospholipid scramblase: an update. FEBS Lett. 2010; 584:2724-2730 [DOI] [PubMed] [Google Scholar]
- Modarai B, Burnand KG, Humphries J, Waltham M, Smith A. The role of neovascularisation in the resolution of venous thrombus. Thromb Haemost. 2005; 93:801-809 [DOI] [PubMed] [Google Scholar]
- Choueiri TK, Schutz FA, Je Y, Rosenberg JE, Bellmunt J. Risk of arterial thromboembolic events with sunitinib and sorafenib: a systematic review and meta‐analysis of clinical trials. J Clin Oncol. 2010; 28:2280-2285 [DOI] [PubMed] [Google Scholar]
- Park D, Tosello‐Trampont AC, Elliott MR, Lu M, Haney LB, Ma Z, Klibanov AL, Mandell JW, Ravichandran KS. BAI1 is an engulfment receptor for apoptotic cells upstream of the ELMO/Dock180/Rac module. Nature. 2007; 450:430-434 [DOI] [PubMed] [Google Scholar]
- Kaur B, Brat DJ, Devi NS, Van Meir EG. Vasculostatin, a proteolytic fragment of brain angiogenesis inhibitor 1, is an antiangiogenic and antitumorigenic factor. Oncogene. 2005; 24:3632-3642 [DOI] [PubMed] [Google Scholar]
- Bonderman D, Skoro‐Sajer N, Jakowitsch J, Adlbrecht C, Dunkler D, Taghavi S, Klepetko W, Kneussl M, Lang IM. Predictors of outcome in chronic thromboembolic pulmonary hypertension. Circulation. 2007; 115:2153-2158 [DOI] [PubMed] [Google Scholar]
- Bonderman D, Jakowitsch J, Redwan B, Bergmeister H, Renner MK, Panzenbock H, Adlbrecht C, Georgopoulos A, Klepetko W, Kneussl M, Lang IM. Role for staphylococci in misguided thrombus resolution of chronic thromboembolic pulmonary hypertension. Arterioscler Thromb Vasc Biol. 2008; 28:678-684 [DOI] [PubMed] [Google Scholar]
- Mercier O, Fadel E. Chronic thromboembolic pulmonary hypertension: animal models. Eur Respir J. 2013; 41:1200-1206 [DOI] [PubMed] [Google Scholar]
- Modarai B, Humphries J, Burnand KG, Gossage JA, Waltham M, Wadoodi A, Kanaganayagam GS, Afuwape A, Paleolog E, Smith A. Adenovirus‐mediated VEGF gene therapy enhances venous thrombus recanalization and resolution. Arterioscler Thromb Vasc Biol. 2008; 28:1753-1759 [DOI] [PubMed] [Google Scholar]
- Singh I, Burnand KG, Collins M, Luttun A, Collen D, Boelhouwer B, Smith A. Failure of thrombus to resolve in urokinase‐type plasminogen activator gene‐knockout mice: rescue by normal bone marrow‐derived cells. Circulation. 2003; 107:869-875 [DOI] [PubMed] [Google Scholar]
- Wakefield TW, Linn MJ, Henke PK, Kadell AM, Wilke CA, Wrobleski SK, Sarkar M, Burdick MD, Myers DD, Strieter RM. Neovascularization during venous thrombosis organization: a preliminary study. J Vasc Surg. 1999; 30:885-892 [DOI] [PubMed] [Google Scholar]
- Waltham M, Burnand KG, Collins M, McGuinness CL, Singh I, Smith A. Vascular endothelial growth factor enhances venous thrombus recanalisation and organisation. Thromb Haemost. 2003; 89:169-176 [PubMed] [Google Scholar]


