

Abstract
Background
Atherosclerotic changes associated with dyslipidemia and increased cardiovascular disease risk are believed to begin in childhood. While previous studies have linked added sugars consumption to low high‐density lipoprotein (HDL), little is known about the long‐term impact of this consumption. This study aims to assess the association between added sugars intake and HDL cholesterol levels during adolescence, and whether this association is modified by obesity.
Methods and Results
We used data from the National Heart Lung and Blood Institute's Growth and Health Study, a 10‐year cohort study of non‐Hispanic Caucasian and African‐American girls (N=2379) aged 9 and 10 years at baseline recruited from 3 sites in 1987‐1988 with biennial plasma lipid measurement and annual assessment of diet using a 3‐day food record. Added sugars consumption was dichotomized into low (0% to <10% of total energy) and high (≥10% of total energy). In a mixed model controlling for obesity, race, physical activity, smoking, maturation stage, age, and nutritional factors, low compared with high added sugar consumption was associated with a 0.26 mg/dL greater annual increase in HDL levels (95% CI 0.48 to 0.04; P=0.02). Over the 10‐year study period, the model predicted a mean increase of 2.2 mg/dL (95% CI 0.09 to 4.32; P=0.04) among low consumers, and a 0.4 mg/dL decrease (95% CI −1.32 to 0.52; P=0.4) among high consumers. Weight category did not modify this association (P=0.45).
Conclusion
Low added sugars consumption is associated with increasing HDL cholesterol levels throughout adolescence.
Keywords: cardiovascular disease risk, diet, dyslipidemia, HDL, lipids, pediatrics
Introduction
Cardiovascular disease is the leading cause of mortality in the United States, accounting for one‐third of deaths in 2010.(2013) Traditional risk factors for cardiovascular disease include low high‐density lipoprotein cholesterol (HDL) levels.(1977)–(2001) These risk factors have been associated with atherosclerotic changes in individuals as young as 11 years of age.(1990)–(1998) Given the early development of atherosclerosis, a life course approach to cardiovascular disease risk management is warranted.(2005) In 2007‐2010, 15% of US youth aged 6 to 19 had low HDL (<40 mg/dL); mean HDL tended to be higher among non‐Hispanic black youth than non‐Hispanic white youth.(2012) Because each cholesterol component tracks from childhood into early adulthood,(1991) identifying and modifying risk factors for dyslipidemia in childhood could change the trajectory of cholesterol levels and thereby improve cardiovascular risk profiles in adulthood.
Sugars added during the processing or preparation of foods and beverages (added sugars)(2003) play a prominent role in the US diet. Adolescents, who are the highest consumers, obtain on average 17% of their total energy intake from added sugars.(2011) Consumption of sugar‐sweetened beverages, the main source of added sugars in the US diet,(2003)–(2011) is associated with reduced satiety and a resulting overconsumption of calories and weight gain.(2007) Added sugars, which in the U.S. includes primarily sucrose and high‐fructose corn syrup (each of which contribute nearly equal amounts of fructose and glucose to the diet), are thought to increase de novo lipogenesis, triglyceride secretion and HDL response due to the rapid metabolism of fructose occurring in the liver.(2010) Although previous cross‐sectional studies have shown an association between added sugars and serum cholesterol, little is known about the long‐term impact of this consumption.(2011)–(2010) As HDL has been shown to be a strong predictor of cardiovascular risk in women,(1977),(2005) an improved understanding of the association between added sugars and HDL among females is particularly important.
The purpose of our study was to investigate the association between added sugars intake and HDL levels in females from early adolescence to early adulthood using the National Lung, Heart and Blood Institute's Growth and Health Study (NGHS) cohort. Further, we examined whether the relationship between added sugars consumption and HDL change is modified by body mass index (BMI).
Methods
Study Design
The National Lung, Heart and Blood Institute's Growth and Health Study (NGHS) was a 10‐year prospective cohort study of non‐Hispanic Caucasian (n=1166) and African‐American (n=1213) girls age 9 or 10 at recruitment. Study participants were recruited between January 1987 and May 1988 at 3 study sites: Richmond, California, Cincinnati, Ohio, and Washington, DC. Full inclusion and exclusion criteria have been published previously.(1992) Briefly, to be included in the NGHS cohort, girls had to be within 2 weeks of age 9 or 10 at the first clinical visit and the girls and their parents had to identify as the same race (black or white). Girls whose parents identified as Hispanic or other races were excluded to reduce the influence of cultural diversity. The original study objective was to understand racial differences in the development of cardiovascular disease risk factors among female adolescents. Plasma lipids were assessed at visits 1, 3, 5, 7, and 10, and thus only these visits were used in the present analysis.
Study Participants
During the 10‐year study, 10 647 study visits occurred in years that lipids were assessed. For the current analysis, observations with missing non‐fasting HDL (n=3471) and nutritional data (n=865) were excluded (Figure 1). Observations with implausible caloric intake of <650 calories or >4000 calories, corresponding to the lowest and highest 1%, respectively, (n=156) or with missing other covariates (n=91) were excluded. All observations subsequent to pregnancy were also excluded (n=474). Girls were censored at the time of pregnancy because HDL is higher in the second and third trimesters of pregnancy but drops below pre‐pregnancy values after a woman gives birth.(1987) The Emory University Institutional Review Board approved this secondary data analysis.
Figure 1.
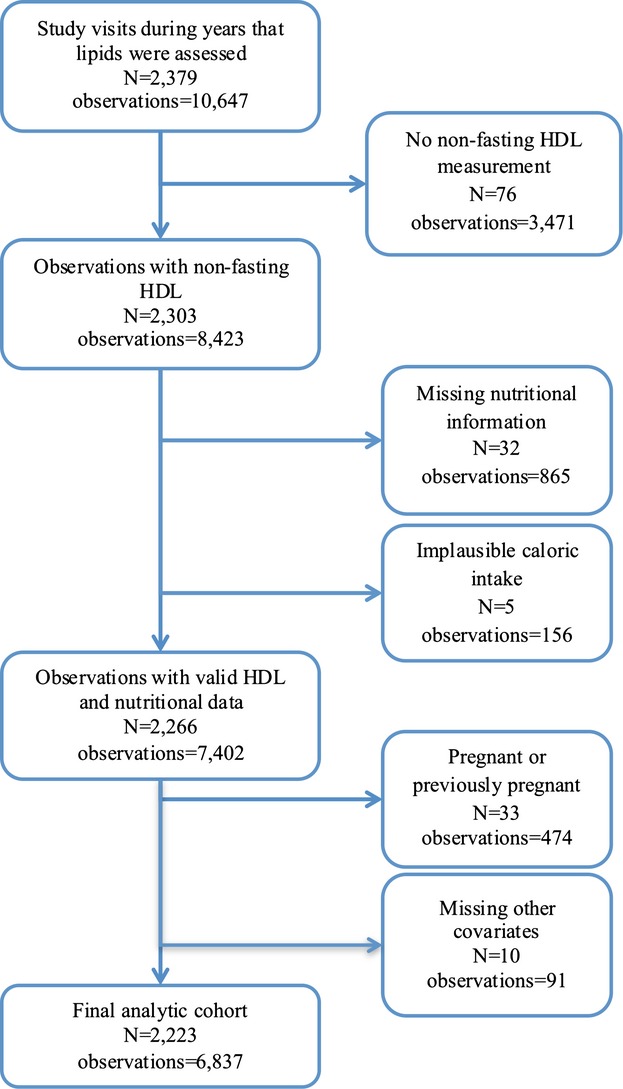
Flow chart of exclusion criteria in the NGHS analysis. HDL indicates high‐density lipoprotein; NGHS, National Lung, Heart and Blood Institute's Growth and Health Study.
Exposure Variable: Added Sugars
Nutrition information was collected annually with a 3‐day food record (2 weekdays and 1 weekend day) using standard protocols.(1994)–(1995) Records were reviewed by nutritionists trained by the University of Minnesota Nutrition Coordinating Center.(1994)–(1995) Added sugars were derived from the dietary records. Specifically, all sugar‐containing foods and beverages were identified and the grams of sugar contained in these items were classified as either natural (whole fruits and vegetables, 100% fruit juice, and unsweetened milk) or added sugars (soda, desserts, and sweetened grain products). For food items without any fruit component but containing a mixture of added and natural sugars, the amount of each type of sugar was estimated as follows: lactose and galactose (found in dairy products) were classified as natural sugars; sucrose (a sugar found only rarely in unprocessed or natural foods) and fructose and glucose (components of high‐fructose corn syrup) were classified as added sugars. For products containing both added sugars and natural fruit sugars (eg, fruit pies), 50% of sucrose, 50% of glucose, and 50% of fructose was estimated to be added and the remaining half of each was estimated to be natural. To test the validity of this assumption, 2 sensitivity analyses were conducted: the estimated added sugars content of products containing a mix of added and natural sugars was: (1) increased to 80% and (2) decreased to 20%. The results of these analyses were compared with those from the original assumption.
Five categories of total added sugars consumption as a percent of total energy consumed were created: 0% to <10%, 10% to <15%, 15% to <20%, 20% to <25%, and ≥25%. The lowest category of consumption represents the limit of consumption recommended by the World Health Organization(2004) and the highest category represents the limit advised by the Institute of Medicine.(2005) In conducting initial analyses, a threshold effect was observed and therefore in further analyses, the added sugars categories were dichotomized into 0% to <10% and ≥10% energy from added sugars. Added sugars consumption was treated as a time‐varying covariate.
Outcome Variable: HDL
Fasting and non‐fasting blood samples were obtained at visits 1, 3, 5, 7, and 10 and analyzed for lipid levels.(1992) Non‐fasting HDL levels were used because there were fewer missing values and non‐fasting HDL levelshave been shown in adults to have similar predictive value for cardiovascular disease risk.(2008) For girls who had both non‐fasting and fasting HDL measurements, the correlation between the 2 values was >0.99.
Covariates
Possible confounding variables were age, BMI category, maturation stage, physical activity, smoking, birth control, alcohol consumption, and other dietary factors. At annual physical examinations, weight and height were measured in accordance with standard protocols.(1992) Each girl's BMI percentile was determined by the CDC's Growth Charts based on her age in months.(2013)–(2013) Due to small numbers (n=165), the underweight category was combined with the normal weight category for modeling. Maturation stage on a scale from 1 to 6 was assessed using areolar stage and Tanner methodology for pubic hair.(1992) A physical activity questionnaire adapted from Ku et al assessed duration, frequency, and intensity of frequent activities, and these components were used to calculate an overall physical activity score.(1981)–(1994) An informal internal validity test of this questionnaire has been reported earlier.(1994) Although survey questions to assess cigarette smoking changed over time, 2 categories of smoking frequency were created from the available data: infrequent/non‐smoker (<7 cigarettes/week), and current smoker (≥7 cigarettes/week). Nutrient residuals, the residual from the regression of each nutrient on total caloric intake, were used to control for the amounts of saturated fat, fiber, and other carbohydrates in the diet. Nutrient residuals are advantageous because they eliminate the natural correlation of nutrients with total caloric intake.(1997) Alcohol consumption was dichotomized because very few girls reported any alcohol use. Information was collected on oral contraception use in the previous year. Alcohol consumption and oral contraception use were not significant and therefore dropped from the final models.
Statistical Analysis
Descriptive characteristics were examined by visit and by category of added sugars consumption at baseline. Means and standard deviations were calculated for continuous variables, and frequencies and percentages were determined for categorical variables. The descriptive statistics are displayed by visit for convenience; age, instead of visit, was used in all regression modeling. To compare baseline characteristics by added sugars category, t tests and chi‐square tests were performed.
To address the primary objective of assessing the impact of added sugars consumption on HDL over time, mixed models were constructed using an unstructured error covariance structure.(2003) Age, physical activity score, nutrient residuals, and total caloric intake were modeled as continuous variables while other demographic variables were modeled as categorical variables. Starting with the basic model of added sugar categories, age, and the interaction of added sugars and age, demographic characteristics and their interaction terms with age were added, followed by nutrition variables and their interactions with age. If an interaction term was not significant, it was removed from the model before the next covariate was added. Nutrition variables known to be associated with HDL levels (total energy, fiber, saturated fat) were left in the model regardless of significance level.(1999)–(1992) Predicted HDL for each category of sugar consumption was calculated for nonsmoking adolescents of normal weight using mean physical activity score and mean caloric intake at each age. The beta coefficients for the interaction terms of added sugars category and age were interpreted as the difference in the annual rate of change of HDL compared with the reference category of <10% energy from added sugars. To evaluate whether the association between added sugars consumption over time and HDL was modified by BMI, appropriate interaction terms were added and their statistical significance was determined. Data analysis was performed using SAS version 9.3 (SAS Institute Inc). Statistical significance was based on 2‐tailed tests, and α=0.05 was used.
Results
Our final analytic cohort contained 6837 observations on 2223 girls. Sixty‐one percent of girls had complete data for at least 3 of their visits; 15% of girls contributed all 5 possible visits, 26% contributed 4 visits, 24% contributed 3 visits, 19% contributed 2 visits, and 15% contributed 1 visit to the analysis. Girls with at least 3 observations in this analysis were significantly more likely to be white, consume more sugar, and have a higher socioeconomic status than girls who had 2 or fewer data points (Table 1).
Table 1.
Baseline Descriptive Statistics Comparing NGHS Girls who had at Least 3 or Less Than 3 Visits Used in Analysis, n=2379
| ≥ 3 Visits (n=1452) | <3 Visits (n=927) | P Value | |||
|---|---|---|---|---|---|
| Mean or Number | (SD) or % | Mean or Number | (SD) or % | ||
| Age, y* | 10.01 | (0.6) | 10.06 | (0.6) | 0.04 |
| Non‐fasting HDL, mg/dL* | 54.0 | (12.7) | 55.1 | (12.6) | 0.08 |
| Physical activity score* | 32.03 | (19.3) | 32.06 | (19.4) | 0.97 |
| BMI** | 18.54 | (3.9) | 18.61 | (3.8) | 0.64 |
| Underweight (<5th percentile) | 54 | 3.7% | 38 | 4.1% | 0.83 |
| Normal (5th to <85th percentile) | 995 | 68.5% | 610 | 65.8% | |
| Overweight (85th to <95th percentile) | 215 | 14.8% | 143 | 15.4% | |
| Obese (95th percentile) | 184 | 12.7% | 120 | 12.9% | |
| Race | 0.002 | ||||
| African‐American | 703 | 48.4% | 510 | 55.0% | |
| Caucasian | 749 | 51.6% | 417 | 45.0% | |
| Smokes ≥7 cigarettes/week | 1 | 0.1% | 8 | 0.9% | 0.003 |
| Parents' annual income (missing) | 72 | 5.0% | 63 | 6.8% | <0.0001 |
| 0 to $9999 | 152 | 10.5% | 252 | 27.2% | |
| $10 000 to $19 999 | 168 | 11.6% | 155 | 16.7% | |
| $20 000 to $39 999 | 447 | 30.8% | 247 | 26.7% | |
| $40 000+ | 613 | 42.2% | 210 | 22.7% | |
| Parents' education (missing) | 0 | 0% | 3 | 0.3% | <0.0001 |
| High school or less | 279 | 19.2% | 338 | 36.5% | |
| 1 to 3 years post high school | 570 | 39.3% | 355 | 38.3% | |
| College graduate or higher | 603 | 41.5% | 231 | 24.9% | |
| Maturation stage (missing) | 10 | 0.7% | 28 | 3.0% | 0.1 |
| 1 (prepubescent) | 735 | 50.6% | 452 | 48.8% | |
| 2 | 417 | 28.7% | 294 | 31.7% | |
| 3 | 190 | 13.1% | 95 | 10.3% | |
| 4 | 51 | 3.5% | 21 | 2.3% | |
| 5 | 46 | 3.2% | 34 | 3.7% | |
| 6 (physically mature) | 3 | 0.2% | 3 | 0.3% | |
| Missing nutrition information | 70 | 4.8% | 189 | 20.4% | |
| Total energy intake | 1822 | (487) | 1832 | (594) | 0.69 |
| % Energy from all carbohydrates | 51.4 | (6.8) | 50.3 | (6.8) | 0.0002 |
| % Energy from added sugar | 17.2 | (6.4) | 16.7 | (6.3) | 0.11 |
| % Energy from fiber | 2.6 | (0.8) | 2.5 | (0.8) | 0.07 |
| % Energy from other carbs | 32.5 | (6.0) | 31.9 | (6.0) | 0.03 |
| % Energy from all fats | 35.5 | (5.4) | 36.5 | (5.4) | <0.0001 |
| % Energy from saturated fat | 13.3 | (2.4) | 13.6 | (2.3) | 0.0001 |
| % Energy from monounsaturated fat | 14.3 | (2.8) | 14.3 | (2.7) | 0.0006 |
| % Energy from polyunsaturated fat | 6.2 | (2.0) | 6.3 | (2.0) | 0.15 |
| % Energy from protein | 13.4 | (2.5) | 13.8 | (2.6) | 0.92 |
| Category of added sugar consumption | <0.0001 | ||||
| <10% | 232 | 16.0% | 284 | 30.6% | |
| 10% to <15% | 366 | 25.2% | 224 | 24.2% | |
| 15% to <20% | 418 | 28.8% | 210 | 22.7% | |
| 20% to <25% | 281 | 19.4% | 140 | 15.1% | |
| ≥25% | 155 | 10.7% | 69 | 7.4% | |
BMI indicates body mass index; HDL, high‐density lipoprotein; NGHS, National Lung, Heart and Blood Institute's Growth and Health Study.
Age was missing for 1 girl, BMI was missing for 20 girls, Physical Activity Score was missing for 92 girls, and HDL was missing for 423 girls.
BMI categories were based on the CDC's Growth Charts.
At baseline (visit 1), mean age was 10.0 years old (SD 0.6) (Table 2). The percent of normal‐weight girls remained stable over time, from 68.8% at baseline to 67.5% at visit 10. The percent of obese girls increased from 12.6% at baseline to 17.0% at visit 10. Mean HDL was similar at baseline and 10 year follow‐up (54.3 versus 54.0 mg/dL, respectively, Ptrend=0.28 (Table 2). Average added sugars consumption increased steadily from 17.0% at baseline to 20.6% at visit 10 (P‐trend=0.005). A total of 210 girls consumed <10% energy as added sugar at visit 1, 169 at visit 5, and 86 at visit 10 (Table 3).
Table 2.
Descriptive Statistics of the NGHS Cohort by Year of Examination
| Visit 1 (n=1709) | Visit 3 (n=1619) | Visit 5 (n=1486) | Visit 7 (n=1205) | Visit 10 (n=818) | P Value for Change Over Age | ||||||
|---|---|---|---|---|---|---|---|---|---|---|---|
| Mean or Number | (SD) or % | Mean or Number | (SD) or % | Mean or Number | (SD) or % | Mean or Number | (SD) or % | Mean or Number | (SD) or % | ||
| Age, y | 10 | (0.6) | 12 | (0.6) | 14 | (0.6) | 16 | (0.6) | 18.9 | (0.6) | — |
| African American | 806 | 47.2% | 828 | 51.1% | 754 | 50.7% | 583 | 48.4% | 376 | 46.0% | — |
| Non‐fasting HDL, mg/dL | 54.3 | (12.6) | 54.4 | (11.9) | 55.8 | (11.4) | 53.6 | (10.8) | 54.0 | (11.8) | 0.28 |
| Physical activity score* | 32.3 | (19.3) | 24.3 | (15.8) | 20.2 | (14.9) | 10.7 | (12.8) | 15.7 | (19.0) | <0.0001 |
| Body mass index* | 18.6 | (3.8) | 20.5 | (4.5) | 22.5 | (5.2) | 23.7 | (5.5) | 25.3 | (6.8) | <0.0001 |
| Underweight (<5th percentile) | 59 | 3.5% | 50 | 3.1% | 20 | 1.3% | 17 | 1.4% | 19 | 2.3% | |
| Normal (5th to <85th percentile) | 1175 | 68.8% | 1087 | 67.1% | 1001 | 67.4% | 844 | 70.0% | 552 | 67.5% | |
| Overweight (85th to <95th percentile) | 257 | 15.0% | 246 | 15.2% | 231 | 15.5% | 172 | 14.3% | 108 | 13.2% | |
| Obese (≥95th percentile) | 218 | 12.8% | 236 | 14.6% | 234 | 15.7% | 172 | 14.3% | 139 | 17.0% | |
| Smoking | |||||||||||
| Infrequent or non‐smoker (<7 cigarettes/week) | 1701 | 99.5% | 1618 | 99.9% | 1466 | 93.3% | 1132 | 90.2% | 685 | 74.9% | |
| Current smoker (≥7 cigarettes/week) | 8 | 0.5% | 1 | 0.1% | 20 | 1.3% | 73 | 6.1% | 133 | 16.3% | |
| Maturation stage* | |||||||||||
| Pre‐pubertal | 1368 | 80.0% | 412 | 25.4% | 21 | 1.4% | |||||
| Pubertal | 337 | 19.7% | 1142 | 70.5% | 1054 | 70.9% | |||||
| Post‐menarchal | 4 | 0.2% | 65 | 4.0% | 411 | 27.7% | |||||
| Average energy intake | 1826 | (488) | 1928 | (591) | 1854 | (598) | 1845 | (573) | 1793 | (537) | 0.03 |
| % Energy from added sugar | 17.0 | (6.4) | 18.3 | (7.3) | 19.0 | (7.5) | 20.0 | (8.0) | 20.6 | (8.8) | <0.0001 |
| % Energy from fiber | 2.6 | (0.8) | 2.5 | (0.9) | 2.4 | (0.9) | 2.5 | (1.0) | 2.8 | (1.3) | 0.0001 |
| % Energy from other carbohydrates | 32.3 | (6.0) | 31.6 | (6.6) | 31.6 | (7.3) | 32.8 | (8.7) | 34.4 | (10.0) | 0.0002 |
| % Energy from saturated fat | 13.5 | (2.6) | 13.1 | (2.7) | 12.7 | (2.9) | 12 | (3.2) | 10.7 | (3.4) | <0.0001 |
| % Energy from monounsaturated fat | 13.4 | (2.4) | 13.4 | (2.6) | 13.2 | (2.6) | 12.3 | (3.1) | 11.2 | (3.4) | <0.0001 |
| % Energy from polyunsaturated fat | 6.2 | (2.0) | 6.3 | (2.1) | 6.5 | (2.2) | 6.6 | (2.4) | 6.3 | (2.5) | 0.0003 |
| % Energy from protein | 14.3 | (2.8) | 14.4 | (3.3) | 14 | (3.2) | 14 | (3.3) | 13.9 | (3.4) | 0.0014 |
HDL indicates high‐density lipoprotein; NGHS, National Lung, Heart and Blood Institute's Growth and Health Study.
Physical Activity Score incorporated frequency, intensity, duration, and type of activity into an overall score that ranged from 0 to 131.
BMI categories were based on the CDC's Growth Charts.
Maturation stage was not collected after year 5; post‐menarchal was imputed for all individuals in years 6 and 9 for modeling.
Table 3.
Baseline Demographic Characteristics by Added Sugar Consumption in the NGHS Cohort in Visits 1, 5, and 10
| Visit 1 | Visit 5 | Visit 10 | ||||||||||
|---|---|---|---|---|---|---|---|---|---|---|---|---|
| <10% Energy From Added Sugar (n=210) | ≥10% Energy From Added Sugar (n=1499) | <10% Energy From Added Sugar (n=169) | ≥10% Energy From Added Sugar (n=1317) | <10% Energy From Added Sugar (n=86) | ≥10% Energy From Added Sugar (n=732) | |||||||
| Mean or Number | (SD) or % | Mean or Number | (SD) or % | Mean or Number | (SD) or % | Mean or Number | (SD) or % | Mean or Number | (SD) or % | Mean or Number | (SD) or % | |
| Age, y | 10.0 | (0.6) | 10.0 | (0.6) | 14.0 | (0.6) | 14.0 | (0.6) | 18.9 | (0.6) | 18.9 | (0.6) |
| Physical activity score | 31.0 | (17.9) | 32.5 | (19.4) | 21.8 | (15.8) | 20.0 | (14.8) | 18.8 | (19.0) | 15.4 | (18.9) |
| BMI | 18.5 | (3.8) | 18.6 | (3.8) | 22.7 | (0.4) | 22.5 | (0.14) | 25.5 | (7.0) | 25.3 | (6.8) |
| Underweight (<5th percentile) | 7 | 3% | 52 | 3% | 3 | 2% | 17 | 1% | 2 | 2% | 17 | 2% |
| Normal (5th to <85th percentile) | 144 | 69% | 1031 | 69% | 109 | 65% | 892 | 68% | 58 | 67% | 494 | 67% |
| Overweight (85th to <95th) | 31 | 15% | 226 | 15% | 31 | 18% | 200 | 15% | 12 | 14% | 96 | 13% |
| Obese (≥95th percentile) | 28 | 13% | 190 | 13% | 26 | 15% | 208 | 16% | 14 | 16% | 125 | 17% |
| Race** | ||||||||||||
| African‐American | 90 | 43% | 716 | 48% | 54 | 32% | 700 | 53% | 26 | 30% | 350 | 48% |
| Caucasian | 120 | 57% | 783 | 52% | 115 | 68% | 617 | 47% | 60 | 70% | 382 | 52% |
| Smoking* | ||||||||||||
| Infrequent or non‐smoker | 209 | 99.5% | 1492 | 99.5% | 166 | 98% | 1300 | 99% | 62 | 72% | 623 | 85% |
| Current smoker (≥7 cigarettes/week) | 1 | 0.5% | 7 | 0.5% | 3 | 2% | 17 | 1% | 24 | 28% | 109 | 15% |
| Maturation stage | ||||||||||||
| Pre‐pubertal | 167 | 80% | 1201 | 80% | 4 | 2% | 17 | 1% | ||||
| Pubertal | 43 | 20% | 294 | 20% | 124 | 73% | 930 | 71% | ||||
| Post‐menarchal | 0 | 0% | 4 | 0% | 41 | 24% | 370 | 28% | ||||
| Parents' annual income** | ||||||||||||
| 0 to $9999 | 24 | 11% | 196 | 13% | 12 | 8% | 180 | 14% | 6 | 7% | 72 | 10% |
| $10 000 to $19 999 | 24 | 11% | 183 | 12% | 22 | 14% | 160 | 13% | 7 | 8% | 92 | 13% |
| $20 000 to $39 999 | 73 | 35% | 455 | 30% | 44 | 28% | 399 | 32% | 20 | 24% | 214 | 31% |
| $40 000+ | 77 | 37% | 590 | 39% | 82 | 51% | 512 | 41% | 51 | 61% | 317 | 45% |
| Parents' education | ||||||||||||
| High school or less | 41 | 20% | 333 | 22% | 26 | 15% | 294 | 22% | 9 | 10% | 139 | 19% |
| 1 to 3 years post high school | 93 | 44% | 577 | 38% | 66 | 39% | 529 | 40% | 30 | 35% | 266 | 36% |
| College graduate or higher | 76 | 36% | 589 | 39% | 77 | 46% | 494 | 37% | 47 | 55% | 326 | 45% |
| HDL by race | ||||||||||||
| Caucasian | 52.6 | (11.8) | 53.3 | (11.6) | 53.5 | (9.6) | 54.0 | (10.7) | 53.5 | (11.1) | 52.2 | (10.6) |
| African‐American | 55.1 | (12.4) | 55.5 | (13.7) | 55.6 | (10.6) | 57.7 | (12.1) | 58.6 | (15.2) | 55.7 | (12.5) |
| HDL by BMI category | ||||||||||||
| Underweight (<5th percentile) | 60.4 | (20.4) | 58.3 | (11.5) | 61.0 | (9.6) | 60.9 | (12.0) | 53.5 | (6.4) | 58.8 | (12.9) |
| Normal (5th to <85th percentile) | 55.3 | (11.5) | 55.8 | (12.4) | 55.7 | (9.2) | 57.3 | (11.5) | 55.9 | (13.4) | 55.5 | (11.6) |
| Overweight (85th to <95th percentile) | 49.2 | (11.0) | 52.0 | (12.4) | 52.6 | (9.6) | 55.1 | (11.0) | 53.5 | (13.5) | 51.6 | (10.5) |
| Obese (≥95th percentile) | 48.9 | (11.5) | 48.4 | (12.2) | 48.7 | (11.4) | 50.5 | (10.8) | 53.0 | (9.3) | 48.7 | (10.8) |
BMI indicates body mass index; HDL, high‐density lipoprotein; NGHS, National Lung, Heart and Blood Institute's Growth and Health Study.
Eighty‐seven girls were missing parents' annual income.
Low and high sugar consumers significantly different at visit 5, P<0.05.
Low and high consumers significantly different at visit 10, P<0.05.
At baseline, there were no significant differences between individuals who consumed <10% energy from added sugars and ≥10% energy from added sugars (Table 3). At visits 5 and 10, low consumers (<10% energy) of added sugars were much more likely to be white than high consumers (≥10% energy) (P<0.01). At visit 5, low consumers were slightly more likely to have well‐educated parents (P=0.049). At visit 10, low consumers of added sugars were more likely to be regular smokers (28% versus 15%, P=0.004). Among both low and high consumers of added sugars, mean HDL was over 2 mg/dL higher in African‐Americans than Caucasians at all visits. Among all participants, mean HDL also differed substantially by weight category, with lower‐weight individuals having higher HDL.
In the preliminary analysis that controlled for race, age, BMI category, smoking, physical activity, puberty stage, nutrient residuals, and total energy intake, with interaction terms for total energy and age, and BMI category and age, predicted HDL was significantly different for all categories of added sugar except for 20% to <25% when compared with the <10% category. Consumption of 10% to <15%, 15% to <20%, and ≥25% energy from added sugar was associated with a significant annual loss of 0.28 (95 CI% −0.53 to −0.03), 0.27 (95% CI −0.52 to −0.03), and 0.31 (95% CI −0.57 to −0.05) mg/dL of HDL, respectively, compared with consumption of <10% energy from added sugar (P=0.03, 0.03, 0.02, respectively) (Table 4). The annual change in HDL among consumers of 20% to <25% energy from added sugars was not significantly different than <10% energy from added sugars (0.18 mg/dL, 95% CI −0.43 to 0.07). Only consumption of <10% added sugars was associated with an overall increase in predicted HDL (Figure 2).
Table 4.
Beta Estimates and 95% Confidence Intervals of Added Sugar on HDL in the NGHS Cohort
| 20/80* | 50/50* | 80/20* | ||||
|---|---|---|---|---|---|---|
| β* | 95% CI | β* | 95% CI | β* | 95% CI | |
| Intercept | 54.254 | (52.40, 56.18) | 54.075 | (52.20, 55.94) | 54.061 | (52.18, 55.94) |
| <10% energy from added sugar | Referent | Referent | Referent | |||
| 10% to 15% energy from added sugar | 0.798 | (−0.36, 1.95) | 1.092 | (−0.09, 2.28) | 1.022 | (−0.18, 2.23) |
| 15% to 20% energy from added sugar | 1.014 | (−0.16, 2.19) | 1.282 | (0.08, 2.48) | 1.336 | (0.12, 2.55) |
| 20% to 25% energy from added sugar | 0.567 | (−0.75, 1.89) | 0.631 | (−0.70, 1.97) | 0.899 | (−0.45, 2.25) |
| ≥25% energy from added sugar | 1.398 | (−0.13, 2.92) | 1.529 | (0.005, 3.05) | 1.410 | (−0.11, 2.93) |
| Total energy, kcals | −0.001 | (−0.0014, −0.0001) | −0.0008 | (−0.001, −0.0001) | −0.0008 | (−0.0014, −0.0001) |
| Age (centered at age 9) | −0.209 | (−0.52, 0.11) | −0.188 | (−0.51, 0.13) | −0.199 | (−0.52, 0.12) |
| Obese | −8.440 | (−9.70, −7.18) | −8.448 | (−9.71, −7.19) | −8.447 | (−9.71, −7.19) |
| Overweight | −4.736 | (−5.82, −3.66) | −4.729 | (−5.81, −3.65) | −4.725 | (−5.81, −3.64) |
| Age×(<10%) | Referent | Referent | Referent | |||
| Age×(10% to 15%) | −0.247 | (−0.49, −0.004) | −0.281 | (−0.53, −0.03) | −0.240 | (−0.49, 0.01) |
| Age×(15% to 20%) | −0.230 | (−0.47, 0.01) | −0.272 | (−0.52, −0.03) | −0.269 | (−0.52, −0.02) |
| Age×(20% to 25%) | −0.185 | (−0.43, 0.06) | −0.179 | (−0.43, 0.07) | −0.220 | (−0.47, 0.03) |
| Age×(≥25%) | −0.301 | (−0.56, −0.04) | −0.309 | (−0.57, −0.05) | −0.280 | (−0.54, −0.02) |
| Age×(total energy) | 0.00025 | (0.00012, 0.00038) | 0.00025 | (0.0001, 0.0004) | 0.00025 | (0.0001, 0.0004) |
| Age×(obese) | 0.199 | (−0.001, 0.40) | 0.199 | (−0.0004, 0.40) | 0.200 | (0.00, 0.40) |
| Age×(overweight) | 0.321 | (0.12, 0.52) | 0.319 | (0.12, 0.52) | 0.319 | (0.12, 0.52) |
All models were adjusted for age, race, smoking, physical activity, puberty stage, BMI category, total energy, nutrient residuals for: fiber, other carbohydrates, saturated fat, monounsaturated fat, polyunsaturated fat, total energy and age, BMI category and age. BMI indicates body mass index; HDL, high‐density lipoprotein; NGHS, National Lung, Heart and Blood Institute's Growth and Health Study.
The numbers designate the classification system used for foods containing a mixture of added and natural sugars. In the first column, 20% of sucrose, fructose, and glucose were classified as added sugars and 80% was classified as natural sugars; in the second column 50% as added and 50% as natural, and in the third column 80% as added and 20% as natural.
For each parameter unit, the beta coefficient represents the increase or decrease in mg/dL of HDL.
Figure 2.
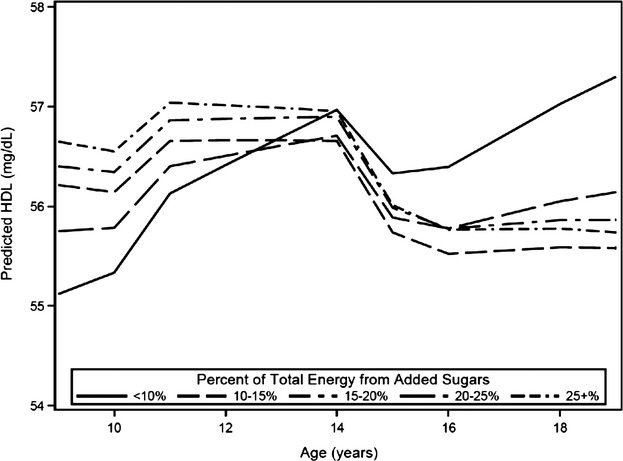
Predicted high‐density lipoprotein (HDL) by category of added sugar intake. Predicted HDL was calculated for non‐smoking, normal weight individuals using the fully adjusted model with mean values of caloric intake and physical activity at each age for continuous variables and modal values for maturation stage.
In the final model adjusted for factors listed above, compared with consumption of <10% energy from added sugars, consumption of ≥10% energy from added sugars was associated with an annual decline of 0.26 mg/dL (95% CI 0.48 to 0.04) HDL. Over the 10‐year study period, low consumption of added sugars was associated with a 2.2 mg/dL increase in HDL, from 55.1 to 57.3 mg/dL (P=0.04) (Figure 3). High consumption of added sugars (≥10%) was not associated with change in HDL (P=0.40). At the end of the 10‐year study period, the 1.5 mg/dL difference in predicted HDL between high and low consumption of added sugars was significant (P=0.045).
Figure 3.
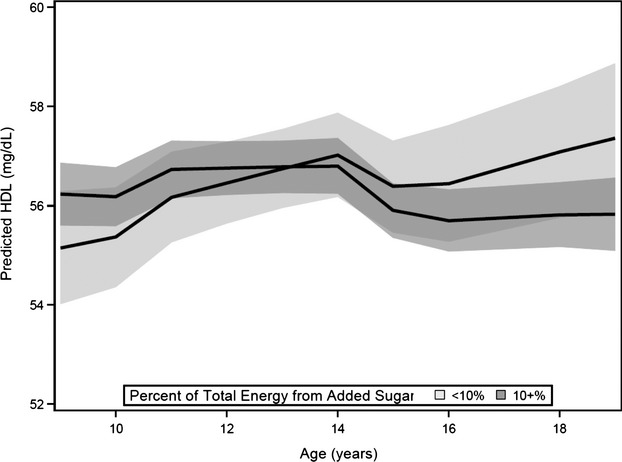
Predicted high‐density lipoprotein (HDL) and 95% confidence bands for low (0% to <10%) and high (≥10%) added sugar consumption. Predicted HDL was calculated for non‐smoking, normal weight individuals using the fully adjusted model with mean values of caloric intake and physical activity at each age for continuous variables and modal values for maturation stage.
Interaction of added sugars with BMI was not significant (P=0.45). The sensitivity analyses assessing the impact of the assumptions used to calculate the amount of added and naturally occurring sugars in foods found no substantial differences in the results (Table 4).
Discussion
In this cohort of adolescent girls, individuals who consumed <10% energy from added sugars experienced a significant annual increase of 0.3 mg/dL HDL compared with individuals who consumed ≥10% energy from added sugars. At age 19, predicted HDL was significantly higher for those with low consumption of added sugars (57.3 mg/dL) compared with high consumption (55.8 mg/dL). The association between added sugars and HDL was not modified by BMI category.
Compared to National Health and Nutrition Examination Survey (NHANES) data from 1999 to 2004 on female adolescents aged 12 to 18, the NGHS cohort had a slightly narrower distribution of added sugars consumption.(2011) In NHANES 1999–2004, ≈13% of female adolescents consumed <10% energy from added sugars compared with 11% of NGHS participants at visits 5 and 10, which was collected from 1990 to 1996. These differences may reflect changing consumption, as added sugars consumption rapidly increased between the 1960s and 2000 but appears to have declined since 2000.(2003)–(2011) Added sugars consumption increased steadily with age in the NGHS cohort, but it cannot be determined whether this is due to the secular trend or due to age. Overall, the estimates of added sugars consumption from NGHS are reasonable given the secular trends that occurred during the 1990s.
Results of previous cross‐sectional studies using NHANES suggest a dose‐response effect between increased added sugars consumption and low HDL, high LDL, and high triglycerides in both adolescents and adults.(2011)–(2010) Similarly, a cross‐sectional analysis of the Coronary Artery Risk Development in Young Adults Study (CARDIA) found an inverse relationship between dietary sucrose, a commonly used form of added sugar, and HDL in young adults.(1998) Efforts to examine the long‐term impact of dietary sucrose in the CARDIA study were limited as the definition of dietary sucrose used at baseline differed from that used at follow‐up: naturally occurring sucrose was excluded at baseline and included at year 7.
HDL percentile growth curves developed from NHANES III and 1999‐2004 show that HDL typically declines slightly from age 9 to age 12 and then rebounds in the late teens.(2006)–(2009) In our study, HDL was modeled as a linear function of age. With the inclusion of maturation stage as a categorical variable, we allowed different linear functions during adolescence. In the final model controlling for all covariates, HDL levels during pre‐ and post‐pubescence were not significantly different, but females around menarche had 0.93 mg/dL higher HDL levels (P=0.003) than post‐pubescent females.
Contrary to expectations, neither smoking nor physical activity were significant in our analysis. Smoking among women typically lowers HDL by 6 to 9 mg/dL(1980)–(1978); the lack of significance in our model could be due to the fact that most girls began smoking late in the study and thus had smoked for only a short time. Underreporting of smoking is unlikely, as the national estimate of cigarette smoking prevalence among high school youth in 1997 was 16.7%, and the prevalence of regular smoking in the NGHS cohort was 16.3% in the same year.(2013) Similarly, physical inactivity has been shown to increase the odds of low HDL in women,(2006) but in this study there was no association between physical activity and HDL in either unadjusted or adjusted models. However, several studies in youth have also found no association between HDL and physical activity.(2002)–(2005) This finding may stem from the difficulty of measuring physical activity using a questionnaire, particularly among children, who have been shown to remember only 50% of the previous week's activities.(1998) In addition, the assumptions inherent in the translation of the intensity and duration of an activity into energy expenditure in METs have not been rigorously examined.(1998)
There are several strengths of our study. The primary strength of this analysis is the use of longitudinal data to explore the relationship between added sugars and HDL. Unlike many studies, this study obtained measurements over 10 years, allowing investigation of the trajectory of HDL across the entire adolescent period. Second, the cohort size of 2379 enrolled girls from 3 study sites was fairly large, with approximately equal numbers of African‐American and Caucasian girls at each site, and different socioeconomic classes represented in both races.(1992) This allowed strong inferences to be made about both racial groups. The distribution of sugar consumption in the older ages of this cohort is close to the distribution of sugar consumption of adolescent females in NHANES, indicating that intake in this cohort reflects national trends. Third, the 3‐day food record with review by a nutritionist has been shown to have the best correlation between observed and reported intakes;(1994) it is the current gold standard for observational cohort studies. Although underreporting intake of both total energy and sugary foods and beverages is probable, especially among overweight or obese girls,(2000) this likely only attenuated the true effects. Finally, the cohort was comprised entirely of females, which is advantageous because the effects of puberty on HDL are likely to be different in males.
There are important limitations to this study. The first limitation is attrition: only 15% of girls had complete information for all 5 HDL and covariate assessments. However, 1452 girls (62%) did have at least 3 observations in this analysis. The primary difference between girls who had 3 or more observations and those that had fewer was socio‐economic status, but in models that included parents' education and income, these variables were not significant. A second limitation was the lack of a direct measure of the added sugar content in foods consumed by participants. While other studies of added sugars used the MyPyramid Equivalents Database or the USDA Database for the Added Sugars Content of Selected Foods,(2011),(2011)–(2010),(2011) in this study added sugars content had to be estimated by the investigators based on the food type and the specific forms of sugar they contained. However, our sensitivity analyses showed the results were robust to different methods for counting added and natural sugars. Finally, we had initially hoped to determine if there were racial differences in the association between added sugars and HDL, but because so few African‐Americans had low added sugar consumption (Table 3), this could not be evaluated.
The findings of this study provide support to the World Health Organization (WHO) Expert Consultation's recommendation that no more than 10% of total energy be from added sugar.(2004) The American Heart Association (AHA) has recommended that adults consume no more than half of the US Department of Agriculture's discretionary calorie allowance as added sugar.(2009) Depending on total caloric intake, this corresponds to 4% to 6% of energy from added sugars. Because so few subjects in the NGHS cohort consumed <6% of energy intake from added sugars, this study is unable to evaluate the AHA's recommendation. The Institute of Medicine, when making recommendations in 2005, determined that there was not enough evidence at that time to evaluate the health effects of added sugars and suggested a maximum of 25% of energy from added sugars.(2005)
Further research is needed to examine whether the effects of added sugar consumed in foods has different health effects than added sugars consumed in beverages. It has been shown that high sugar‐sweetened beverage consumption is associated with lower overall diet quality(2011)–(1999); similar investigations should be conducted for added sugars in foods. Additionally, naturally occurring fructose, glucose, and sucrose are chemically indistinguishable from added sugars, and an important question that remains is whether natural sugars have similar health effects.
Clear guidelines on the safe level of consumption of added sugars are critically needed given the high volume of added sugars in the diets of most American children and adolescents. Unlike most other nutrients, which are required in at least minute amounts for biologic functioning, there is no requirement for added sugar in the diet and high intake is associated with several negative health outcomes. Despite a recent decline, the average American adolescent continues to consume more than 17% of their daily energy intake from added sugars.(2011) These findings support the need for a coordinated public health approach to promote further reductions in consumption of added sugars by children and adolescents.
Acknowledgments
This manuscript was prepared using NGHS Research Materials obtained from the NHLBI Data Repository Information Coordinating Center and does not necessarily reflect the opinions or views of the NGHS or the NHLBI.
Disclosures
Aryeh D. Stein serves a paid member of the Nutrition Advisory Board for Dunkin Brands, Inc. Dr. Miriam B Vos is the author of The No‐Diet Obesity Solution for Kids, for which she receives royalties. The remaining authors report no conflicts.
References
- Centers for Disease Control and Prevention, Division of Vital Statistics Deaths: final data for 2010. Available at: http://www.cdc.gov/nchs/fastats/heart.htm Accessed May 8, 2013 [PubMed]
- Gordon T, Castelli WP, Hjortland MC, Kannel WB, Dawber TR. High density lipoprotein as a protective factor against coronary heart disease. The Framingham Study. Am J Med. 1977; 62:707-714 [DOI] [PubMed] [Google Scholar]
- Hubert HB, Feinleib M, McNamara PM, Castelli WP. Obesity as an independent risk factor for cardiovascular disease: a 26‐year follow‐up of participants in the Framingham Heart Study. Circulation. 1983; 67:968-977 [DOI] [PubMed] [Google Scholar]
- Executive summary of the third report of the National Cholesterol Education Program (NCEP) expert panel on detection, evaluation, and treatment of high blood cholesterol in adults (Adult Treatment Panel III). JAMA. 2001; 285:2486-2497 [DOI] [PubMed] [Google Scholar]
- Relationship of atherosclerosis in young men to serum lipoprotein cholesterol concentrations and smoking. A preliminary report from the Pathobiological Determinants of Atherosclerosis in Youth (PDAY) Research Group. JAMA. 1990; 264:3018-3024 [DOI] [PubMed] [Google Scholar]
- Berenson GS, Srinivasan SR, Bao W, Newman WP, III, Tracy RE, Wattigney WA. Association between multiple cardiovascular risk factors and atherosclerosis in children and young adults. The Bogalusa Heart Study. N Engl J Med. 1998; 338:1650-1656 [DOI] [PubMed] [Google Scholar]
- Lynch J, Smith GD. A life course approach to chronic disease epidemiology. Annu Rev Public Health. 2005; 26:1-35 [DOI] [PubMed] [Google Scholar]
- Kit BK, Carroll MD, Lacher DA, Sorlie PD, DeJesus JM, Ogden C. Trends in serum lipids among US youths aged 6 to 19 years, 1988–2010. JAMA. 2012; 308:591-600 [DOI] [PMC free article] [PubMed] [Google Scholar]
- Webber LS, Srinivasan SR, Wattigney WA, Berenson GS. Tracking of serum lipids and lipoproteins from childhood to adulthood. The Bogalusa Heart Study. Am J Epidemiol. 1991; 133:884-899 [DOI] [PubMed] [Google Scholar]
- Popkin BM, Nielsen SJ. The sweetening of the world's diet. Obes Res. 2003; 11:1325-1332 [DOI] [PubMed] [Google Scholar]
- Welsh JA, Sharma AJ, Grellinger L, Vos MB. Consumption of added sugars is decreasing in the United States. Am J Clin Nutr. 2011; 94:726-734 [DOI] [PMC free article] [PubMed] [Google Scholar]
- Vartanian LR, Schwartz MB, Brownell KD. Effects of soft drink consumption on nutrition and health: a systematic review and meta‐analysis. Am J Public Health. 2007; 97:667-675 [DOI] [PMC free article] [PubMed] [Google Scholar]
- Stanhope KL, Havel PJ. Fructose consumption: recent results and their potential implications. Ann N Y Acad Sci. 2010; 1190:15-24 [DOI] [PMC free article] [PubMed] [Google Scholar]
- Welsh JA, Sharma A, Cunningham SA, Vos MB. Consumption of added sugars and indicators of cardiovascular disease risk among US adolescents. Circulation. 2011; 123:249-257 [DOI] [PMC free article] [PubMed] [Google Scholar]
- Welsh JA, Sharma A, Abramson JL, Vaccarino V, Gillespie C, Vos MB. Caloric sweetener consumption and dyslipidemia among US adults. JAMA. 2010; 303:1490-1497 [DOI] [PMC free article] [PubMed] [Google Scholar]
- Ridker PM, Rifai N, Cook NR, Bradwin G, Buring JE. Non‐HDL cholesterol, apolipoproteins A‐I and B100, standard lipid measures, lipid ratios, and CRP as risk factors for cardiovascular disease in women. JAMA. 2005; 294:326-333 [DOI] [PubMed] [Google Scholar]
- Morrison J, Biro F, Campaigne B. Obesity and cardiovascular disease risk factors in black and white girls: the NHLBI Growth and Health Study. Am J Public Health. 1992; 82:1613-1620 [DOI] [PMC free article] [PubMed] [Google Scholar]
- Van Stiphout W, Hofman A. Serum lipids in young women before, during, and after pregnancy. Am J Epidemiol. 1987; 126:922-928 [DOI] [PubMed] [Google Scholar]
- Crawford PB, Obarzanek E, Morrison J, Sabry Z. Comparative advantage of 3‐day food records over 24‐hour recall and 5‐day food frequency validated by observation of 9‐and 10‐year‐old girls. J Am Diet Assoc. 1994; 94:626-630 [DOI] [PubMed] [Google Scholar]
- Crawford PB, Obarzanek E, Schreiber GB, Barrier P, Goldman S, Frederick MM, Sabry ZI. The effects of race, household income, and parental education on nutrient intakes of 9‐ and 10‐year‐old girls. NHLBI Growth and Health Study. Ann Epidemiol. 1995; 5:360-368 [DOI] [PubMed] [Google Scholar]
- Nishida C, Uauy R, Kumanyika S, Shetty P. The joint WHO/FAO expert consultation on diet, nutrition and the prevention of chronic diseases: process, product and policy implications. Public Health Nutr. 2004; 7:245-250 [DOI] [PubMed] [Google Scholar]
- Institute of Medicine Dietary Reference Intakes for Energy Carbohydrate, Fiber, Fat, Fatty Acids, Cholesterol, Protein, and Amino Acids. 2005Washington, DC: National Academies Press; 2005 [Google Scholar]
- Mora S, Rifai N, Buring JE, Ridker PM. Fasting compared with nonfasting lipids and apolipoproteins for predicting incident cardiovascular events. Circulation. 2008; 118:993-1001 [DOI] [PMC free article] [PubMed] [Google Scholar]
- Centers for Disease Control and Prevention Growth charts: percentile data files with LMS values. Available at: http://www.cdc.gov/growthcharts/percentile_data_files.htm Accessed April 19, 2013
- Centers for Disease Control and Prevention About BMI for children and teens. Available at: http://www.cdc.gov/healthyweight/assessing/bmi/childrens_bmi/about_childrens_bmi.html Accessed April 19, 2013
- Ku L, Shapiro L, Crawford P, Huenemann R. Body composition and physical activity in 8‐year‐old children. Am J Clin Nutr. 1981; 34:2770-2775 [DOI] [PubMed] [Google Scholar]
- Obarzanek E, Schreiber GB, Crawford PB, Goldman SR, Barrier PM, Frederick MM, Lakatos E. Energy intake and physical activity in relation to indexes of body fat: the National Heart, Lung, and Blood Institute Growth and Health Study. Am J Clin Nutr. 1994; 60:15-22 [DOI] [PubMed] [Google Scholar]
- Willett WC, Howe GR, Kushi LH. Adjustment for total energy intake in epidemiologic studies. Am J Clin Nutr. 1997; 65:1220S-1228S [DOI] [PubMed] [Google Scholar]
- Singer JD, Willett JB. Applied Longitudinal Data Analysis: Modeling Change and Event Occurrence. 2003New York City, NY: Oxford University Press; 2003 [Google Scholar]
- Ludwig DS, Pereira MA, Kroenke CH, Hilner JE, Van Horn L, Slattery ML, Jacobs DR., Jr Dietary fiber, weight gain, and cardiovascular disease risk factors in young adults. JAMA. 1999; 282:1539-1546 [DOI] [PubMed] [Google Scholar]
- Mensink RP, Zock PL, Kester AD, Katan MB. Effects of dietary fatty acids and carbohydrates on the ratio of serum total to HDL cholesterol and on serum lipids and apolipoproteins: a meta‐analysis of 60 controlled trials. Am J Clin Nutr. 2003; 77:1146-1155 [DOI] [PubMed] [Google Scholar]
- Dattilo AM, Kris‐Etherton PM. Effects of weight reduction on blood lipids and lipoproteins: a meta‐analysis. Am J Clin Nutr. 1992; 56:320-328 [DOI] [PubMed] [Google Scholar]
- Archer SL, Liu K, Dyer AR, Ruth KJ, Jacobs DR, Jr, Van Horn L, Hilner JE, Savage PJ. Relationship between changes in dietary sucrose and high density lipoprotein cholesterol: the CARDIA study. Coronary Artery Risk Development in Young Adults. Ann Epidemiol. 1998; 8:433-438 [DOI] [PubMed] [Google Scholar]
- Jolliffe CJ, Janssen I. Distribution of lipoproteins by age and gender in adolescents. Circulation. 2006; 114:1056-1062 [DOI] [PubMed] [Google Scholar]
- Cook S, Auinger P, Huang TT‐K. Growth curves for cardio‐metabolic risk factors in children and adolescents. J Pediatr. 2009; 155:S6.e15. [DOI] [PMC free article] [PubMed] [Google Scholar]
- Criqui MH, Wallace RB, Heiss G, Mishkel M, Schonfeld G, Jones GT. Cigarette smoking and plasma high‐density lipoprotein cholesterol. The Lipid Research Clinics Program Prevalence Study. Circulation. 1980; 62:IV70-IV76 [PubMed] [Google Scholar]
- Garrison RJ, Kannel WB, Feinleib M, Castelli WP, McNamara PM, Padgett SJ. Cigarette smoking and HDL cholesterol: the Framingham offspring study. Atherosclerosis. 1978; 30:17-25 [DOI] [PubMed] [Google Scholar]
- Centers for Disease Control and Prevention, Division of Adolescent and School Health Trends in the prevalence of tobacco use National YRBS: 1991–2011. Available at: http://www.cdc.gov/healthyyouth/yrbs/pdf/us_tobacco_trend_yrbs.pdf Accessed June 17, 2013
- Mora S, Lee IM, Buring JE, Ridker PM. Association of physical activity and body mass index with novel and traditional cardiovascular biomarkers in women. JAMA. 2006; 295:1412-1419 [DOI] [PubMed] [Google Scholar]
- Twisk J, Kemper H, Van Mechelen W. The relationship between physical fitness and physical activity during adolescence and cardiovascular disease risk factors at adult age. The Amsterdam Growth and Health Longitudinal Study. Int J Sports Med. 2002; 23:8-14 [DOI] [PubMed] [Google Scholar]
- Twisk J, Van Mechelen W, Kemper H, Post G. The relation between “long‐term exposure” to lifestyle during youth and young adulthood and risk factors for cardiovascular disease at adult age. J Adolesc Health. 1997; 20:309-319 [DOI] [PubMed] [Google Scholar]
- Raitakari OT, Taimela S, Porkka KV, Telama R, Välimäki I, Akerblom H, Viikari JS. Associations between physical activity and risk factors for coronary heart disease: the Cardiovascular Risk in Young Finns Study. Med Sci Sports Exerc. 1997; 29:1055-1061 [DOI] [PubMed] [Google Scholar]
- Strong WB, Malina RM, Blimkie CJ, Daniels SR, Dishman RK, Gutin B, Hergenroeder AC, Must A, Nixon PA, Pivarnik JM. Evidence based physical activity for school‐age youth. J Pediatr. 2005; 146:732-737 [DOI] [PubMed] [Google Scholar]
- Goran MI. Measurement issues related to studies of childhood obesity: assessment of body composition, body fat distribution, physical activity, and food intake. Pediatrics. 1998; 101:505-518 [PubMed] [Google Scholar]
- Krebs‐Smith SM, Graubard BI, Kahle LL, Subar AF, Cleveland LE, Ballard‐Barbash R. Low energy reporters vs others: a comparison of reported food intakes. Eur J Clin Nutr. 2000; 54:281-287 [DOI] [PubMed] [Google Scholar]
- Nicklas TA, O'Neil CE, Liu Y. Intake of added sugars is not associated with weight measures in children 6 to 18 years: National Health and Nutrition Examination Surveys 2003–2006. Nutr Res. 2011; 31:338-346 [DOI] [PubMed] [Google Scholar]
- Johnson RK, Appel LJ, Brands M, Howard BV, Lefevre M, Lustig RH, Sacks F, Steffen LM, Wylie‐Rosett J. Dietary sugars intake and cardiovascular health a scientific statement from the American Heart Association. Circulation. 2009; 120:1011-1020 [DOI] [PubMed] [Google Scholar]
- de Koning L, Malik VS, Rimm EB, Willett WC, Hu FB. Sugar‐sweetened and artificially sweetened beverage consumption and risk of type 2 diabetes in men. Am J Clin Nutr. 2011; 93:1321-1327 [DOI] [PMC free article] [PubMed] [Google Scholar]
- Harnack L, Stang J, Story M. Soft drink consumption among US children and adolescents: nutritional consequences. J Am Diet Assoc. 1999; 99:436-441 [DOI] [PubMed] [Google Scholar]