

Abstract
Background
In‐hospital cardiac arrest (IHCA) is common and often fatal. However, the extent to which hospitals vary in survival outcomes and the degree to which this variation is explained by patient and hospital factors is unknown.
Methods and Results
Within Get with the Guidelines‐Resuscitation, we identified 135 896 index IHCA events at 468 hospitals. Using hierarchical models, we adjusted for demographics comorbidities and arrest characteristics (eg, initial rhythm, etiology, arrest location) to generate risk‐adjusted rates of in‐hospital survival. To quantify the extent of hospital‐level variation in risk‐adjusted rates, we calculated the median odds ratio (OR). Among study hospitals, there was significant variation in unadjusted survival rates. The median unadjusted rate for the bottom decile was 8.3% (range: 0% to 10.7%) and for the top decile was 31.4% (28.6% to 51.7%). After adjusting for 36 predictors of in‐hospital survival, there remained substantial variation in rates of in‐hospital survival across sites: bottom decile (median rate, 12.4% [0% to 15.6%]) versus top decile (median rate, 22.7% [21.0% to 36.2%]). The median OR for risk‐adjusted survival was 1.42 (95% CI: 1.37 to 1.46), which suggests a substantial 42% difference in the odds of survival for patients with similar case‐mix at similar hospitals. Further, significant variation persisted within hospital subgroups (eg, bed size, academic).
Conclusion
Significant variability in IHCA survival exists across hospitals, and this variation persists despite adjustment for measured patient factors and within hospital subgroups. These findings suggest that other hospital factors may account for the observed site‐level variations in IHCA survival.
Keywords: cardiac arrest, cardiopulmonary resuscitation, heart arrest, resuscitation
Introduction
Each year, ≈200 000 in‐hospital cardiac arrests (IHCA) occur in the United States, with overall survival rates of 18% to 20%.1–3 However, the extent to which hospitals vary in survival rates for IHCA remains poorly understood, as prior studies have largely reported aggregate survival rates at the patient level or have had a limited sample of hospitals, and most studies have lacked detailed information on patient factors to ensure adequate case‐mix adjustment.1–2,1–8 Furthermore, the extent of site‐level variation in neurologic status among survivors—an outcome of great importance to many patients, their family members, and providers—remains unknown.
Defining variability in survival rates, and examining the degree to which variation persists even after adjusting for patient case‐mix, would provide important insights into which hospitals could improve resuscitation care and offer opportunities to identify best practices at these hospitals. If significant variability in survival exists even after adjusting for patient case‐mix, this may suggest that resuscitation process factors (eg, time to defibrillation, quality of cardiopulmonary resuscitation) and quality improvement initiatives may be the primary reasons for substantially higher survival rates in top‐performing hospitals.9–11 Moreover, it would suggest a greater urgency to develop appropriate research methodology to identify which factors are associated with “best practices” at hospitals with the highest IHCA survival.
Accordingly, within the American Heart Association's Get With The Guidelines®‐Resuscitation (GWTG‐R), a large national in‐hospital cardiac arrest registry, we examined the extent to which hospitals varied in rates of survival to discharge among patients with IHCA. GWTG‐R is an ideal data source, as it contains IHCA data from over 400 US hospitals and collects detailed information on a number of patient and cardiac arrest characteristics to ensure robust case‐mix adjustment in a specific patient cohort.
Methods
Study Database
This was a multicenter cohort study using data from GWTG‐R to calculate hospital risk‐adjusted survival rates for IHCA. GWTG‐R is sponsored by the American Heart Association (AHA) and is a large, comprehensive, prospective national database of IHCA in the US. This dataset also has information from Outcome, a Quintiles Company which is the data collection and coordination center for the GWTG‐R program. Data are collected from participating acute care hospitals according to standardized Utstein definitions for IHCA.12 Specially trained research coordinators at each facility routinely abstract detailed data from the medical chart about resuscitation events if the event elicits an in‐hospital emergency resuscitation response and a code record is generated. These data include pre‐, intra‐, and postarrest variables, as well as survival at discharge. The AHA provides rigorous quality control and oversight for all GWTG‐R data collection, analysis, reporting, and research studies.
Study Population
The study population included all adult patients 18 years of age or older enrolled within the registry between January 1, 2001 and December 31, 2010. Initially, 163 390 patients from 607 hospitals were identified (Figure 1). We excluded IHCA events in individuals who were not hospital patients, including hospital visitors or employees (n=293). Since patients may have had recurrent IHCA events, we focused on the index IHCA and excluded 26 190 recurrent arrests. As our study objective was to examine hospital variation in survival outcomes, we excluded 872 IHCA events from 94 hospitals with a case volume of fewer than 20 IHCAs. The final study cohort comprised 135 896 IHCAs from 468 hospitals.
Figure 1.
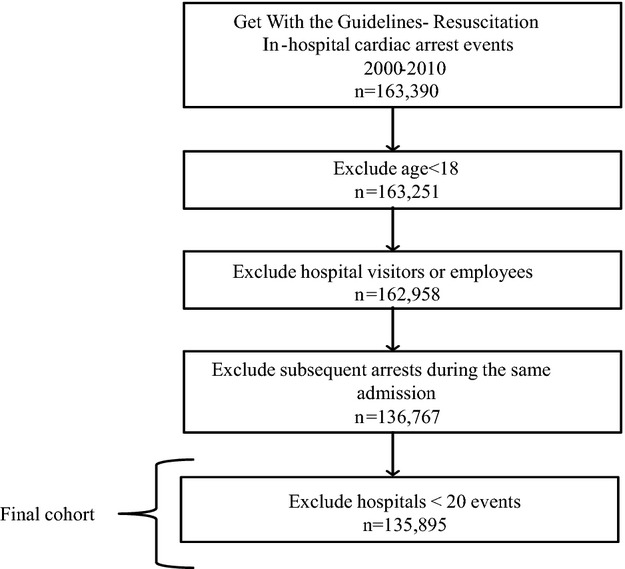
Study cohort exclusion/inclusion criteria. This figure illustrates the exclusion and inclusion criteria applied to the Get With the Guidelines‐Resuscitation dataset.
Study Design and Variables
Valid comparisons of IHCA survival rates across hospitals require statistical adjustment. We first estimated unadjusted survival rates by hospital. We then adjusted these rates for demographics, comorbidities, and intra‐arrest factors.
Patient‐level factors collected within GWTG‐R include demographics and comorbid conditions. These factors are important to control for, as older and sicker patients are known to have worse outcomes after in‐hospital arrest.1,7,13 Therefore, the following patient‐level factors were evaluated for model inclusion: age, sex, race, residence prior to hospitalization, and prearrest comorbidities (neurologic conditions, arrhythmia, myocardial infarction, congestive heart failure, diabetes, pneumonia, respiratory insufficiency, hepatic insufficiency/failure, renal insufficiency/failure, hypotension/hypoperfusion, hematology/oncology conditions, major trauma, and septicemia). Additionally, available arrest characteristics were collected in GWTG‐R and included arrest etiology, presenting rhythm, event location, prearrest in‐place interventions, and time and day of arrest.
Hospital‐Level Factors
Several hospital factors have previously been identified as important predictors of IHCA outcomes14–17 yet these factors are not often accounted for in multicenter studies of IHCA. Modifiable hospital‐level factors that are associated with outcomes are particularly important as they can reveal opportunities for improvement. Structural variables included in our analysis were: bed size (small; 6 to 99 beds, medium; 100 to 400, and large; greater than 400), academic status, and urban compared with rural location. These variables are included in GWTG‐R and are adapted from the American Hospital Association Annual Survey.
Outcomes
The primary outcome measure was survival at hospital discharge. In this study, we calculated risk‐adjusted hospital rates for these outcomes. Moreover, since several hospital factors have previously been identified as important predictors of IHCA outcomes,14–17 we examined how (patient‐level) risk‐adjusted survival rates varied by hospital bed size, academic status, and urban designation.
Statistical Analyses
Summary statistics were used to describe the patients included in the sample. The unadjusted IHCA survival rate for each hospital was calculated, and hospital variation in unadjusted rates of survival was examined by deciles.
We then used multivariable hierarchical regression models to calculate risk‐adjusted hospital rates of survival to discharge. This approach allowed us to control for clustering of patients within sites.18 Factors hypothesized to affect outcomes after IHCA were included as covariates in the model. These included the previously described demographic variables (age, race, gender, residence prior to admission), comorbidities, intraarrest factors (eg, initial rhythm, in‐place interventions), and arrest factors (eg, etiology, location, time). The year of arrest was also included to control for temporal trends in survival. From the model, we used the model coefficients to calculate the predicted survival probability for each patient. These probabilities were summed within each hospital to then produce a hospital survival rate. For illustrative purposes, the survival rates for hospitals in each decile were compared. Moreover, we examined survival rates (risk‐adjusted for patient level factors) across hospital deciles after stratifying the sample by bed size, academic status, and urban designation.
Finally, we quantified the extent of variation in risk‐adjusted survival across hospitals in the registry using the median odds ratio (MOR), which was derived from the hierarchical model after adjusting for patient factors as follows: ![]() 19–21 The MOR is estimated from hierarchical models and includes only patient‐level factors. It does not have an associated confidence interval. The MOR describes the likelihood that patients with similar measured covariates would have different outcomes at randomly chosen hospitals. A MOR of 1 suggests no variation in outcomes across hospitals. A MOR of 1.5 suggests that a patient would have a 50% greater odds of a particular outcome at a randomly identified hospital when compared with a similar patient.
19–21 The MOR is estimated from hierarchical models and includes only patient‐level factors. It does not have an associated confidence interval. The MOR describes the likelihood that patients with similar measured covariates would have different outcomes at randomly chosen hospitals. A MOR of 1 suggests no variation in outcomes across hospitals. A MOR of 1.5 suggests that a patient would have a 50% greater odds of a particular outcome at a randomly identified hospital when compared with a similar patient.
All statistical analyses were performed using SAS version 9.1 (SAS Institute Inc). All analyses were evaluated at a 2‐sided significance level of 0.05. This study was approved by the Institutional Review Board at the University of Pennsylvania.
Results
We evaluated a total of 135 896 in‐hospital cardiac arrest events at 468 hospitals (Figure 1). Of these, 78 787 (58%) were men, 93 945 (74%) were of white race, and 112 877 (83%) were over 50 years of age (Table S1). Two in 5 IHCA events had ventricular tachycardia or ventricular fibrillation (VF/VT) as the presenting rhythm and 86 672 (64%) occurred in an intensive care unit. Half, 52% (245) of all study hospitals were academic teaching hospitals (245), 89% (419) were in urban settings, and 278 (59%) had at least 100 beds.
Variation in Hospital Survival Rates
Unadjusted rates of survival to discharge varied markedly across hospitals, with a median unadjusted rate for the bottom decile of 8.3% (range: 0% to 10.7%) and for the top decile of 31.4% (range: 28.6% to 51.7%) (Figure 2). Using hierarchical regression, we identified 36 predictors of in‐hospital survival to discharge (Table 1). Among the predictors were key demographic factors including age, female sex (OR 1.10; 95% CI: 1.06 to 1.13, P<0.01), and black race (OR 0.93; 95% CI: 0.87 to 0.99, P=0.03), comorbidities such as arrhythmia (OR 1.24; 95% CI: 1.20 to 1.28, P<0.01) and myocardial infarction (OR 1.19; 95% CI: 1.14 to 1.24, P<0.01), and intraarrest factors including cardiac etiology (OR 1.18; 95% CI: 1.14 to 1.23, P<0.01) and initial rhythm of VF or VT (OR 3.14; 95% CI: 3.02 to 3.27).
Figure 2.
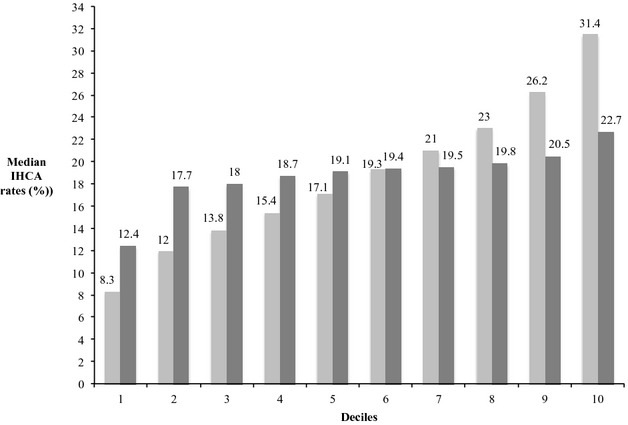
Unadjusted and adjusted median in‐hospital cardiac survival rates by hospital decile. This figure illustrates in‐hospital cardiac arrest (IHCA) rates (y‐axis) across hospitals. Median unadjusted rates are light gray bars and adjusted rates are dark gray bars. Hospital deciles are on the x‐axis. Rates are adjusted for the patient‐level factors identified in Table 1.
Table 1.
Model Predictors for Survival to Discharge
| Survival to Discharge | |||
|---|---|---|---|
| OR | 95% CI | P Value | |
| Age, y (ref >81) | |||
| 18 to 50 | 2.27 | 2.15 to 2.40 | <0.0001 |
| 1 to 60 | 2.25 | 2.14 to 2.37 | <0.0001 |
| 1 to 70 | 2.0 | 1.90 to 2.10 | <0.0001 |
| 71 to 80 | 1.52 | 1.45 to 1.60 | <0.0001 |
| Gender (ref male) | |||
| Female | 1.10 | 1.06 to 1.13 | <0.0001 |
| Race (ref other) | |||
| White | 1.15 | 1.09 to 1.21 | <0.0001 |
| Black | 0.93 | 0.87 to 0.99 | 0.03 |
| Residence pre‐admission (ref other) | |||
| Home | 1.18 | 1.14 to 1.22 | <0.0001 |
| Comorbidities | |||
| Neurologic | 0.89 | 0.84 to 0.94 | <0.0001 |
| Arrhythmia | 1.24 | 1.20 to 1.28 | <0.0001 |
| Myocardial Infarction | 1.19 | 1.14 to 1.24 | <0.0001 |
| Congestive Heart Failure | 0.95 | 0.92 to 0.98 | 0.002 |
| Diabetes | 1.12 | 1.08 to 1.15 | <0.0001 |
| Pneumonia | 0.93 | 0.89 to 0.98 | 0.01 |
| Respiratory insufficiency | 0.96 | 0.93 to 1.0 | 0.04 |
| Hepatic insufficiency/failure | 0.54 | 0.51 to 0.59 | <0.0001 |
| Renal insufficiency/failure | 0.78 | 0.76 to 0.81 | <0.0001 |
| Hypotension/Hypoperfusion | 0.71 | 0.68 to 0.74 | <0.0001 |
| Hematology/Oncology | 0.50 | 0.47 to 0.52 | <0.0001 |
| Major Trauma | 0.79 | 0.73 to 0.87 | <0.0001 |
| Septicemia | 0.70 | 0.66 to 0.73 | <0.0001 |
| Initial rhythm (ref other) | |||
| VF/VT | 3.14 | 3.02 to 3.27 | <0.0001 |
| Pulseless electrical Activity | 1.06 | 1.02 to 1.10 | 0.002 |
| Other | 2.17 | 2.03 to 2.31 | <0.0001 |
| Arrest etiology | |||
| Cardiac cause | 1.18 | 1.14 to 1.23 | <0.0001 |
| Respiratory cause | 0.96 | 0.93 to 0.99 | 0.12 |
| Neurologic cause | 0.83 | 0.72 to 0.97 | 0.02 |
| Metabolic cause | 0.71 | 0.69 to 0.74 | <0.0001 |
| Toxicologic cause | 2.36 | 2.06 to 2.70 | <0.0001 |
| Arrest location (ref unmonitored) | |||
| Intensive care unit | 1.60 | 1.53 to 1.68 | <0.0001 |
| Monitored | 1.72 | 1.64 to 1.81 | <0.0001 |
| Arrest time of day: night (ref day) | 0.74 | 0.72 to 0.76 | <0.0001 |
| Arrest time: weekend (ref weekday) | 0.86 | 0.83 to 0.89 | <0.0001 |
| Pre‐arrest interventions | |||
| Airway | 0.59 | 0.57 to 0.62 | <0.0001 |
| Central line | 1.09 | 1.04 to 1.114 | 0.01 |
| Pacemaker/ICD | 0.99 | 0.93 to 1.05 | 0.72 |
| Anti‐arrhythmic medication | 1.20 | 1.13 to 1.29 | <0.0001 |
| Vasoactive medication | 0.54 | 0.52 to 0.57 | <0.0001 |
| Intra‐aortic balloon pump | 1.03 | 0.91 to 1.16 | 0.67 |
| Dialysis | 0.82 | 0.75 to 0.90 | <0.0001 |
CI indicates confidence interval; ICD, implanted cardioverter defibrillator; OR, odds ratio; VF/VT, ventricular fibrillation/ventricular tachycardia.
After applying the model coefficients to patients in the sample, we calculated risk‐adjusted survival rates for IHCA for each hospital. Rates were adjusted for the patient‐level factors identified in Table 1. The median adjusted rate was 12.4% (range: 0% to 15.6%) for the bottom decile and 22.7% (range: 21.0% to 36.2%) for the top decile. Of note, of the 46 hospitals in the top decile for IHCA survival before risk adjustment, only 24 (52%) remained in the top decile after risk adjustment. To illustrate the extent of hospital variation in rates of survival to discharge, we determined that the median OR was 1.42 (95% CI: 1.37 to 1.46), which suggests that there was a 42% greater odds of patients with identical covariates surviving to hospital discharge at one randomly selected hospital compared with another.
We also examined whether hospital variation in survival rates persisted within hospital subgroups. After multivariable adjustment, the median adjusted survival rate was 11.9% (range: 0% to 14.8%) for the bottom decile of academic hospitals and 22.8% (range: 20.8% to 36.2%) for the top decile. Similar patterns of hospital variation were observed for nonacademic hospitals and by hospital bed size and rural versus urban status (Table 2).
Table 2.
Stratified (Bottom and Top Decile) Survival Rates by Hospital Type
| Median Unadjusted Rates (min, max) | Median Adjusted Rates (min, max) | |
|---|---|---|
| Academic status | ||
| Academic hospitals (n=245) | 18.6% (0% to 51.7%) | 19.3% (0% to 36.2%) |
| Bottom decile (n=25) | 8% (0% to 10.6%) | 11.9% (0% to 14.8%) |
| Top decile (n=24) | 30.1% (28.2% to 51.7%) | 22.8% (20.8% to 36.2%) |
| Non‐academic hospitals (n=223) | 18.2% (0% to 43.3%) | 19.2% (0% to 30.1%) |
| Bottom decile (n=22) | 9% (0% to 10.9%) | 12.9% (0% to 16%) |
| Top decile (n=22) | 32.8% (29.78% to 43.2%) | 22.5% (21.5% to 31%) |
| Hospital bed size | ||
| Small bed size (n=190) | 16.6% (0% to 51.7%) | 18.9% (0% to 36.1%) |
| Bottom decile (n=19) | 7.3% (0% to 9.4%) | 10.4% (0% to 14.1%) |
| Top decile (n=19) | 33% (29.8% to 51.7%) | 24.1% (22% to 36.2%) |
| Medium bed size (n=185) | 18.9% (0% to 43.2%) | 18.8% (0% to 27.7%) |
| Bottom decile (n=18) | 9.4% (0% to 10.6%) | 13% (0% to 16.1%) |
| Top decile (n=18) | 30.8% (28.5% to 43.2%) | 22.2% (21% to 27.7%) |
| Large bed size (n=93) | 19.1% (0% to 42.3%) | 19% (0% to 29.6%) |
| Bottom decile (n=9) | 10.9% (0% to 12.5%) | 16.2% (0% to 17.1%) |
| Top decile (n=9) | 28.7% (27.7% to 42.3%) | 21.9% (20.5% to 29.6%) |
| Location designation | ||
| Urban designation (n=415) | 17.9% (0% to 51.7%) | 19.2% (0% to 36.1%) |
| Bottom decile (n=41) | 8% (0% to 10.6%) | 11.5% (0% to 15.4%) |
| Top decile (n=41) | 31.2% (28.5% to 51.7%) | 22.2% (21% to 36.2%) |
| Rural designation (n=53) | 20.2% (7.9% to 38.4%) | 19.4% (10.9% to 29.9%) |
| Bottom decile (n=5) | 9.4% (7.9% to 10.9%) | 15.9% (10.9% to 16%) |
| Top decile (n=5) | 36.1% (31.8% to 38.5%) | 26.7% (25.7% to 30%) |
Max indicates maximum; min, minimum.
Discussion
In a large national registry of IHCA, we found substantial variation in survival across hospitals. This variability was not explained by differences in patient case‐mix or hospital characteristics. Given that survival outcomes are of immense importance to patients with IHCA, these findings raise questions about the quality of resuscitation care at hospitals in the lower deciles and offer important opportunities to identify best practices at hospitals in the upper deciles.
Our study extends the work of prior studies of IHCA, which largely focused on patient‐level aggregate rates of survival. While important, most of these studies have not examined the influence of the hospital in affecting survival. By employing multilevel hierarchical models to identify patient predictors in this study, we were able to derive robust risk‐adjusted survival rates for each hospital, which allowed us to examine the extent of site‐level variation. Indeed, we found that the hospital at which one is admitted may influence one's odds of survival by 42%, an enormous effect considering that this is a “hard” clinical end points.
However, the reason for these large variations in outcomes across hospitals is less clear. These variations in survival may suggest that significant differences in high‐quality resuscitation care exist among hospitals. Top performing hospitals may have better response times for defibrillation, chest compressions, and initiation of Acute Cardiac Life Support medications (eg, epinephrine, vasopressin), or may provide higher‐quality cardiopulmonary resuscitation (eg, adequate depth, positioning and rate, minimal interruptions). These hospitals may also excel in postresuscitation care (eg, therapeutic hypothermia), which arguably is an equally important determinant of survival after IHCA.22–24 Moreover, top performing hospitals may differ in structural variables (eg, nursing staff ratios), training variables (eg, routine resuscitation simulations, debriefing after IHCA events), and hospital culture (eg, leadership, emphasis on quality improvement, differences in duration of CPR)—all of which may improve IHCA survival outcomes.25–27
A second reason for significant variation in hospital survival may be related to differences in care prior to cardiac arrest. It is possible that top performing hospitals were able to achieve high rates of survival because their prearrest systems of care were able to detect physiological decline in patients earlier rather than later. As a result, their ability to respond and treat patients who developed IHCA was more timely and effective. Presence or absence of rapid response teams and the structure and function of these teams may also be a contributing factor to across‐hospital variation in outcomes. Alternatively, it is plausible that hospitals with the highest rates of IHCA survival do so because they have a high cardiac arrest incidence rate. Therefore, they only “appear” to perform well with cardiac arrest survival because some patients go on to develop IHCA when the event could have been prevented. As the relationship between incidence and outcomes is likely nonlinear, and there are multiple ways that incidence could impact outcomes, this variable was not included in this analyses but could be modeled in future work.
Finally, hospital differences in IHCA survival and may be due to differential application of do‐not‐resuscitate orders for all admitted patients.28–29 Thus, it is possible that the top performing hospitals have higher rates of do‐not‐resuscitate orders—which would be a good “outcome” in the right patient—and therefore would only appear to have better resuscitation outcomes.
In order to better understand the determinants of hospital variation in IHCA outcomes, further studies are needed using nonconventional methodologies, such as mixed‐methods analyses.30 These approaches will require on‐site qualitative interviews with hospital administrators and medical and nursing staff to better understand a given site's resuscitation practices, strategies to monitor and prevent IHCA, and hospital culture and leadership. Moreover, these analyses can provide insights into whether the success of higher performing hospitals is largely due to more liberal use of do‐not‐resuscitate orders. In the past, a mixed‐methods approach was critical in differentiating hospitals with better door‐to‐balloon times for ST‐elevation myocardial infarction and identifying core components of top performing hospitals.31 Needed are clear guidelines and policies that hospitals can implement to measure their performance, provide feedback to providers, and modify hospital‐wide practices. In order to move the field of in‐hospital resuscitation science forward, future studies will need to shift from describing hospital variation to identifying and proscribing best practices at top performing hospitals.
Limitations
Although our risk‐adjusted rates were able to control for multiple confounders, the presence of residual confounding in affecting IHCA outcomes exists. If rates of unmeasured confounders differed markedly across hospitals, this could affect the magnitude of our hospital variation findings. There may also be additional, more granular patient‐level differences32 (eg, laboratory values: prearrest creatinine, prearrest hematocrit, liver function tests) or differences in data collection between hospitals that are not measurable in the GWTG‐R registry but may be important to consider in interpreting our reported results. Patient and family preferences regarding end‐of‐life care were not collected in GWTG‐R, nor did we have rates of do‐not‐resuscitate orders (and timing or reason for these orders) for all hospital admissions. Therefore, some of the observed variation in IHCA survival may be due to systematic differences in how aggressively hospitals offered guidance to patients on end‐of‐life care. Additionally, systematic validated information about neurologic status is not available for all patients in the GWGT‐R dataset. There may be significant variability in hospitals' survival to discharge rates and survival to discharge with favorable neurologic outcomes, which could be identified. A better understanding of this important clinical outcome would be important for future work evaluating hospital variability in IHCA outcomes. Finally, GWTG‐R is a voluntary registry of hospitals; therefore, our findings may not be generalizable to all US hospitals.
Conclusion
Although IHCA is associated with low survival, significant variation in survival exists across hospitals, even after adjustment for patient case‐mix. Further research is needed to investigate additional patient‐level factors and identify best practices at top performing hospitals so that IHCA outcomes can improve at all hospitals.
Sources of Funding
Career Development Grant Awards from the National Heart Lung and Blood Institute. K23‐10714038 (to Dr Merchant) and K23HL102224 (to Dr Chan). None of the above funding sources were involved in the design or conduct of the study, collection, management, analysis, or interpretation of the data, or preparation, review, or approval of the manuscript.
Disclosures
Dr Merchant received grant/research support from the National Institutes of Health (NIH) (K23 Grant 10714038), and pilot funding from Physio‐Control Seattle, WA, Zoll Medical, Boston MA, Cardiac Science, Bothell, WA, and Philips Medical Seattle, WA. Dr Yang reports no conflicts of interest to disclose. Dr Becker reveived speaker honoraria/consultant fees from Philips Healthcare, Seattle, WAand institutional grant/research support from Philips Healthcare, Seattle, WA, Laerdal Medical, Stavanger, Norway, the NIH, Bethesda, MD, and Cardiac Science, Bothell, WA. Dr Berg received institutional grant/research support from the NIH, Bethesda, MD. Drs Groeneveld and Asch are US Government federal employees. Dr Chan received grant/research support from AHA, which sponsors GWTG (Get With the Guidelines)‐Resuscitation.
References
- 1.Ehlenbach WJ, Barnato AE, Curtis JR, Kreuter W, Koepsell TD, Deyo RA, Stapleton RD. Epidemiologic study of in‐hospital cardiopulmonary resuscitation in the elderly. N Engl J Med. 2009; 361:22-31 [DOI] [PMC free article] [PubMed] [Google Scholar]
- 2.Sandroni C, Nolan J, Cavallaro F, Antonelli M. In‐hospital cardiac arrest: incidence, prognosis and possible measures to improve survival. Intensive Care Med. 2007; 33:237-245 [DOI] [PubMed] [Google Scholar]
- 3.Merchant RM, Yang L, Becker LB, Berg RA, Nadkarni V, Nichol G, Carr BG, Mitra N, Bradley SM, Abella BS, Groeneveld PW. Incidence of treated cardiac arrest in hospitalized patients in the United States. Crit Care Med. 2011; 39:2401-2406 [DOI] [PMC free article] [PubMed] [Google Scholar]
- 4.Tunstall‐Pedoe H, Bailey L, Chamberlain DA, Marsden AK, Ward ME, Zideman DA. Survey of 3765 cardiopulmonary resuscitations in British hospitals (the BRESUS Study): methods and overall results. BMJ. 1992; 304:1347-1351 [DOI] [PMC free article] [PubMed] [Google Scholar]
- 5.Gwinnutt CL, Columb M, Harris R. Outcome after cardiac arrest in adults in UK hospitals: effect of the 1997 guidelines. Resuscitation. 2000; 47:125-135 [DOI] [PubMed] [Google Scholar]
- 6.Cooper S, Cade J. Predicting survival, in‐hospital cardiac arrests: resuscitation survival variables and training effectiveness. Resuscitation. 1997; 35:17-22 [DOI] [PubMed] [Google Scholar]
- 7.Ebell MH, Becker LA, Barry HC, Hagen M. Survival after in‐hospital cardiopulmonary resuscitation. A meta‐analysis. J Gen Intern Med. 1998; 13:805-816 [DOI] [PMC free article] [PubMed] [Google Scholar]
- 8.Nadkarni VM, Larkin GL, Peberdy MA, Carey SM, Kaye W, Mancini ME, Nichol G, Lane‐Truitt T, Potts J, Ornato JP, Berg RA. First documented rhythm and clinical outcome from in‐hospital cardiac arrest among children and adults. JAMA. 2006; 295:50-57 [DOI] [PubMed] [Google Scholar]
- 9.Go AS, Mozaffarian D, Roger VL, Benjamin EJ, Berry JD, Borden WB, Bravata DM, Dai S, Ford ES, Fox CS, Franco S, Fullerton HJ, Gillespie C, Hailpern SM, Heit JA, Howard VJ, Huffman MD, Kissela BM, Kittner SJ, Lackland DT, Lichtman JH, Lisabeth LD, Magid D, Marcus GM, Marelli A, Matchar DB, McGuire DK, Mohler ER, Moy CS, Mussolino ME, Nichol G, Paynter NP, Schreiner PJ, Sorlie PD, Stein J, Turan TN, Virani SS, Wong ND, Woo D, Turner MB. Heart disease and stroke statistics—2013 update: a report from the American Heart Association. Circulation. 2013; 127:e6-e245 [DOI] [PMC free article] [PubMed] [Google Scholar]
- 10.Salisbury AC, Amin AP, Harris WS, Chan PS, Gosch KL, Rich MW, O'Keefe JH, Jr, Spertus JA. Predictors of omega‐3 index in patients with acute myocardial infarction. Mayo Clin Proc. 2011; 86:626-632 [DOI] [PMC free article] [PubMed] [Google Scholar]
- 11.Chan PS, Krumholz HM, Nichol G, Nallamothu BKAmerican Heart Association National Registry of Cardiopulmonary Resuscitation I Delayed time to defibrillation after in‐hospital cardiac arrest. N Engl J Med. 2008; 358:9-17 [DOI] [PubMed] [Google Scholar]
- 12.Cummins RO, Chamberlain D, Hazinski MF, Nadkarni V, Kloeck W, Kramer E, Becker L, Robertson C, Koster R, Zaritsky A, Bossaert L, Ornato JP, Callanan V, Allen M, Steen P, Connolly B, Sanders A, Idris A, Cobbe S. Recommended guidelines for reviewing, reporting, and conducting research on in‐hospital resuscitation: the in‐hospital ‘Utstein style.’ American Heart Association. Circulation. 1997; 95:2213-2239 [DOI] [PubMed] [Google Scholar]
- 13.Levy PD, Ye H, Compton S, Chan PS, Larkin GL, Welch RDAmerican Heart Association National Registry of Cardiopulmonary Resuscitation I Factors associated with neurologically intact survival for patients with acute heart failure and in‐hospital cardiac arrest. Circ Heart Fail. 2009; 2:572-581 [DOI] [PubMed] [Google Scholar]
- 14.Carr BG, Goyal M, Band RA, Gaieski DF, Abella BS, Merchant RM, Branas CC, Becker LB, Neumar RW. A national analysis of the relationship between hospital factors and post‐cardiac arrest mortality. Intensive Care Med. 2009; 35:505-511 [DOI] [PubMed] [Google Scholar]
- 15.Carr BG, Kahn JM, Merchant RM, Kramer AA, Neumar RW. Inter‐hospital variability in post‐cardiac arrest mortality. Resuscitation. 2009; 80:30-34 [DOI] [PubMed] [Google Scholar]
- 16.Engdahl J, Abrahamsson P, Bang A, Lindqvist J, Karlsson T, Herlitz J. Is hospital care of major importance for outcome after out‐of‐hospital cardiac arrest? Experience acquired from patients with out‐of‐hospital cardiac arrest resuscitated by the same emergency medical service and admitted to one of two hospitals over a 16‐year period in the municipality of Goteborg. Resuscitation. 2000; 43:201-211 [DOI] [PubMed] [Google Scholar]
- 17.Keenan SP, Dodek P, Martin C, Priestap F, Norena M, Wong H. Variation in length of intensive care unit stay after cardiac arrest: where you are is as important as who you are. Crit Care Med. 2007; 35:836-841 [DOI] [PubMed] [Google Scholar]
- 18.Goldstein H. Multilevel Statistical Models (Third Edition). 1995London and New York: Edward arnold; wiley [Google Scholar]
- 19.Goldstein H, Browne W, Rasbash J. Partitioning variation in multilevel models. Underst Stat. 2002; 1:223-232 [Google Scholar]
- 20.Chan PS, Nichol G, Krumholz HM, Spertus JA, Nallamothu BKAmerican Heart Association National Registry of Cardiopulmonary Resuscitation I Hospital variation in time to defibrillation after in‐hospital cardiac arrest. Arch Intern Med. 2009; 169:1265-1273 [DOI] [PubMed] [Google Scholar]
- 21.Chan PS, Patel MR, Klein LW, Krone RJ, Dehmer GJ, Kennedy K, Nallamothu BK, Weaver WD, Masoudi FA, Rumsfeld JS, Brindis RG, Spertus JA. Appropriateness of percutaneous coronary intervention. JAMA. 2011; 306:53-61 [DOI] [PMC free article] [PubMed] [Google Scholar]
- 22.Sunde K, Pytte M, Jacobsen D, Mangschau A, Jensen LP, Smedsrud C, Draegni T, Steen PA. Implementation of a standardised treatment protocol for post resuscitation care after out‐of‐hospital cardiac arrest. Resuscitation. 2007; 73:29-39 [DOI] [PubMed] [Google Scholar]
- 23.Peberdy MA, Callaway CW, Neumar RW, Geocadin RG, Zimmerman JL, Donnino M, Gabrielli A, Silvers SM, Zaritsky AL, Merchant R, Vanden Hoek TL, Kronick SL. Part 9: post‐cardiac arrest care: 2010 American Heart Association Guidelines for Cardiopulmonary Resuscitation and Emergency Cardiovascular Care. Circulation. 2010; 122:S768-S786 [DOI] [PubMed] [Google Scholar]
- 24.Neumar RW, Nolan JP, Adrie C, Aibiki M, Berg RA, Bottiger BW, Callaway C, Clark RS, Geocadin RG, Jauch EC, Kern KB, Laurent I, Longstreth WT, Jr, Merchant RM, Morley P, Morrison LJ, Nadkarni V, Peberdy MA, Rivers EP, Rodriguez‐Nunez A, Sellke FW, Spaulding C, Sunde K, Vanden Hoek T. Post‐cardiac arrest syndrome: epidemiology, pathophysiology, treatment, and prognostication. A consensus statement from the International Liaison Committee on Resuscitation (American Heart Association, Australian and New Zealand Council on Resuscitation, European Resuscitation Council, Heart and Stroke Foundation of Canada, InterAmerican Heart Foundation, Resuscitation Council of Asia, and the Resuscitation Council Of Southern Africa); the American Heart Association Emergency Cardiovascular Care Committee; the Council on Cardiovascular Surgery and Anesthesia; the Council on Cardiopulmonary, Perioperative, and Critical Care; the Council on Clinical Cardiology; and the Stroke Council. Circulation. 2008; 118:2452-2483 [DOI] [PubMed] [Google Scholar]
- 25.Merchant RM, Yang L, Becker LB, Berg RA, Nadkarni V, Nichol G, Carr BG, Mitra N, Bradley SM, Abella BS, Groeneveld PWAmerican Heart Association Get With the Guideline‐Resuscitation I Variability in case‐mix adjusted in‐hospital cardiac arrest rates. Med Care. 2012; 50:124-130 [DOI] [PMC free article] [PubMed] [Google Scholar]
- 26.Edelson DP, Litzinger B, Arora V, Walsh D, Kim S, Lauderdale DS, Vanden Hoek TL, Becker LB, Abella BS. Improving in‐hospital cardiac arrest process and outcomes with performance debriefing. Arch Intern Med. 2008; 168:1063-1069 [DOI] [PubMed] [Google Scholar]
- 27.Goldberger ZD, Chan PS, Berg RA, Kronick SL, Cooke CR, Lu M, Banerjee M, Hayward RA, Krumholz HM, Nallamothu BKAmerican Heart Association Get With The Guidelines‐Resuscitation I Duration of resuscitation efforts and survival after in‐hospital cardiac arrest: an observational study. Lancet. 2012; 380:1473-1481 [DOI] [PMC free article] [PubMed] [Google Scholar]
- 28.Choudhry NK, Choudhry S, Singer PA. CPR for patients labeled DNR: the role of the limited aggressive therapy order. Ann Intern Med. 2003; 138:65-68 [DOI] [PubMed] [Google Scholar]
- 29.Bristow PJ, Hillman KM, Chey T, Daffurn K, Jacques TC, Norman SL, Bishop GF, Simmons EG. Rates of in‐hospital arrests, deaths and intensive care admissions: the effect of a medical emergency team. Med J Aust. 2000; 173:236-240 [DOI] [PubMed] [Google Scholar]
- 30.Krumholz HM, Curry LA, Bradley EH. Survival after acute myocardial infarction (SAMI) study: the design and implementation of a positive deviance study. Am Heart J. 2011; 162:981-987.e989 [DOI] [PMC free article] [PubMed] [Google Scholar]
- 31.Bradley EH, Herrin J, Mattera JA, Holmboe ES, Wang Y, Frederick P, Roumanis SA, Radford MJ, Krumholz HM. Quality improvement efforts and hospital performance: rates of beta‐blocker prescription after acute myocardial infarction. Med Care. 2005; 43:282-292 [DOI] [PubMed] [Google Scholar]
- 32.Chan PS, Nichol G, Krumholz HM, Spertus JA, Jones PG, Peterson ED, Rathore SS, Nallamothu BKAmerican Heart Association National Registry of Cardiopulmonary Resuscitation I Racial differences in survival after in‐hospital cardiac arrest. JAMA. 2009; 302:1195-1201 [DOI] [PMC free article] [PubMed] [Google Scholar]