

Introduction
Ever since the discovery of small, non‐coding RNAs in circulation, microRNAs have gained significant attention as biomarkers or, in some instances, regulators of disease and/or associated complications. Until now, most articles published use real‐time quantitative PCR (qPCR) for assessment of circulating RNAs as microarray‐based methods have low reproducibility.(2009)–(2011) Real‐time qPCR technology provides us with a simple tool to efficiently determine the amount of a gene transcript in a given sample. However, the simplicity of this methodology can itself be problematic, as one tends to overlook critical factors that make this technique work. Here, we discuss specific factors that must be considered when performing, presenting, and interpreting miRNA quantitative transcript data. Currently, there are 3 main methods of quantifying circulating miRNAs: real time PCR (qPCR), gene arrays, and sequencing. Although they all have individual benefits, qPCR is the favored approach (2010) and will be the focus of this article.
Choice of qPCR Chemistry
There are 2 main camps when selecting the fluorescent PCR amplification marker. The flouorophore you choose is crucial; it will determine the specificity and sensitivity of the assay. SYBR green, an asymmetrical cyanine dye, has been used in PCR‐based application since the mid 1990s.(1995)–(1995) This dye (and most successors) binds to nucleic acids, especially double‐stranded DNA molecules, with high affinity but no specificity. As the PCR reaction generates more amplicons, SYBR green will bind and create a net increase in fluorescence. The primary disadvantage of this dye is its lack of specificity; it may generate false positives through the binding to non‐specific DNA fragments, such as primer dimers, or multiple dye molecules may bind to 1 amplicon, increasing the perceived quantity. As such, qPCR primers must be very carefully designed and a melt curve analysis is imperative. In a heterogenous, yet closely related RNA species such as microRNAs, specificity is a major factor and SYBR‐based chemistries are best avoided.
A fluorophore‐tagged probe‐based chemistry (such as TaqMan™ assays) provides several benefits over SYBR green or dye‐based technologies. First of all, a probe and primer set offer high specificity (specific to target copy accumulation during PCR), reproducibility, and sensitivity (low copy detection). Because the expression of the appropriate fluorescence is regulated and obtained after amplification of a specific complementary DNA, minimal (≈no) background fluorescence is achieved, thus offering a better signal to noise ratio. The use of stem‐loop reverse transcription primers, such as those offered by Life Technologies, allow for reliable detection of the individual mature microRNAs. The high level of specificity and reproducibility of such probe‐based assays make them the superior choice for the quantification of circulating miRNAs. Although this oligonucleotide probe technology was first described in 1991,(1991) until recently, fiscal barriers have precluded many researchers from employing it.
Choice of Technologies
Currently, quantitative estimation of microRNAs can be carried out using multiple platforms/technologies. Some of these include the Light cycler (Roche), ViiA7 or Quant Studio Open Array systems (Life Technologies), dynamic arrays (Fluidigm Corporation), or the nCounter system (Nanostring Technologies Inc). Although the latter technologies are still gaining popularity, the majority of research articles published until now have used the light cycler, ViiA7, or equivalent platforms for real‐time PCR. Other platforms such as low‐density arrays also offer a higher throughput. Considering these different platforms, one of the important concerns is the efficiency of PCR reaction with differences in illumination and detection sources (lasers, halogen lamp, and LEDs for PMTs or CCDs). The inherent differences between such platforms should be understood before comparing 2 or more studies that employ different platforms. Users should also keep in mind the total reaction volumes for their PCR reactions as some of these technologies (eg, dynamic arrays) have very low reaction volumes (15 nL/reaction). The choice of detection platform and the use of pre‐amplification workflows would directly affect the relative levels of a microRNA presented in different studies.
Data Presentation
Data normalization is the first step and a major challenge in data analysis, because there are no universal/well accepted control/“housekeeping” transcripts for normalization of circulating miRNA data. This lack of consensus has resulted in the generation of various normalization strategies. One popular approach is to use a stably expressed transcript as a control. Small nuclear/nucleolar RNAs, such as RNU6‐2 (RNU6B),(2011)–(2009) RNU44,(2011)–(2009) or RNU48,(2009)–(2011) are often chosen. Although these transcripts demonstrate constant expression among different biological replicates, their levels of expression cannot be assured under different experimental conditions. Recently, Chen and colleagues have proposed using a combination of let‐7d, let‐7g, and let‐7i to normalize data.(2013) In our experience, when working with candidate microRNAs, it is essential to screen for multiple “housekeeping” miRs in the sample set before analyzing the data. Another popular method for normalization of microRNA data is “global normalization” and was described by Mestdagh and colleagues in 2009.(2009) This method is highly recommended when dealing with discovery miRNA expression studies where several hundreds of microRNAs are analyzed. As demonstrated by Mestdagh et al, this method of global normalization outperforms the current candidate, small RNA control method. However, global normalization cannot be applied for datasets that assess only a limited set of microRNAs in a sample. It is best recommended to identify miRNAs/ncRNAs that resemble the mean expression value and are predefined for normalization before analysis of smaller datasets.
Once the data is normalized the next part is analyzing this data and presenting it in a graphical form. A common method, as indicated by the boxed outline in the Figure, is the “% expression” method. The Figure presents a hypothetical data set wherein 2 different datasets are presented across panels A and B. The raw data (cycle threshold or Ct values) are presented in the left panel while the common presentation method, seen in several articles, is presented in the center panel for both data sets (A and B). As presented here, data plotted in the center panel looks identical for both the data sets (A and B), although the level of detection is 10 cycles or approximately over 1000‐fold apart. The “fold‐over‐control” method thus fails to bring out the difference in the level of detection and should be avoided. It is difficult to understand if the differences presented (center panel for A and B) are biologically relevant. There are 2 reasons to argue against such data presentation method: (1) as presented in the center panel (Figure), the differences in Control 1 versus Test 1 and Control 2 versus Test 2 are identical. However, these data indicate that there is a 2‐fold difference (≈100% versus 200%). Most methods for quantitating the differences rely on quantitative real‐time PCR, the smallest unit of reliable measurement for which is 2‐fold (at ideal efficiencies, 1 cycle=2‐fold increase in product). Thus, a 2‐fold change is actually the smallest reliable measure that is possible by real‐time PCR. In spite of this, we do see data presented with significance in differences among the groups attributed to insignificant (eg, 100% versus 170%) changes in the levels of miRNA transcripts. A suggested method is to present the data obtained as “fold‐over‐detectable”. Here, the term “detectable” indicates the highest cycle number above which the linear relationship between copy number and cycle‐threshold is lost. This “detectable” Ct value will differ based on the type of platform used for qPCR. We suggest calculating this by performing serial dilution and assessing the Ct‐value above which linear amplification of the gene assessed is not observed. We find that for most TaqMan‐based assays on 96‐well plate platforms with 5 to 10 μL of total reaction volume, a linear relationship is lost by ≈39 cycles. Therefore, a “fold‐over detectable” in this case can be defined as the net fold change over a detectable limit of 39 Ct value. This method of data presentation thus allows the reader to back‐calculate the actual Ct values for the gene transcripts thereby maintaining clarity of information of the data presented and interpret these findings better. (2) The next question that comes to mind is the biological relevance. The data presented in Figure A shows a control sample that is barely detectable (Ct value of ≈36) and a Test sample that shows an increase in abundance by an average of 1 cycle. Thus in reality, we are looking at a couple of microRNA gene transcripts/cell that increase to say 4 transcripts/cell (assuming homogeneous distribution of copies across cells). A major consideration when dealing with such low copy transcripts is the Poisson distribution of transcripts, which predicts that in a large number of replicates containing an average of 1 copy of starting template, approximately 37% should actually have no copies, only 37% should contain 1 copy, and 18% should contain 2 copies. Thus, for reliable detection of low copy gene transcripts in any sample sets, a large number of replicates are critical to assess statistical significance and overcome the limitations of Poisson distribution. On the other hand, the data in Figure B presents a similar 1‐cycle difference between the Control 2 and Test 2 sample sets. However, in this case, we are probably looking at say ≈2000 copies/cell increasing to ≈4000 copies/cell. The latter case (Figure B) presents with a more biologically relevant scenario than the former (Figure A). These differences could only be understood if such a method for presentation of microRNA/transcript data is followed. It does not mean that data presenting with single‐cycle differences in gene transcripts are irrelevant. However, it would help the reader understand the biological significance/relevance of such differences and compare the findings presented with more confidence.
Figure 1.
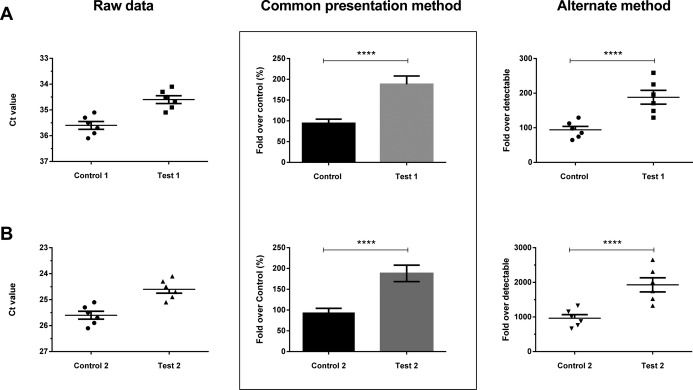
Two theoretical data sets (A and B) plotted as raw data/cycle‐threshold (Ct) values (left panel), fold over control (center panel) and fold over detectable (right panel). See text for details on the Data Presentation methods and flaws in clarity of presentation for the most popular (fold‐over‐control) method.
Conclusion
The measurement of circulating microRNA is an important and exciting area of research. However, such studies should be carried out taking into consideration the factors discussed herein. Proper experimental conditions including a no template control, sufficiently powered biological replicates, no RT control, use of appropriate normalization methodology and transparent data presentation approach must be applied before presenting any scientific data. In order to achieve better performance in evaluation of real‐time PCR data, it is also recommended to carry out serial dilution with 5‐log dilutions to achieve a slope of ≈−3.3, so as to confirm the efficiency of your PCR reaction. It is also recommended to have an SD<0.17 between replicates for better precision and to increase the number of replicates for gene transcripts that are detected at lower copies in the samples. Understanding these limits and incorporating them in studies dealing with circulating microRNAs/ncRNAs would help in achieving a better understanding of biologically relevant data for identifying the potential of microRNAs as biomarkers and/or regulators of disease.
Circulating MicroRNAs: Understanding the Limits for Quantitative Measurement by Real‐Time PCR
The article by Hardikar et al, “Circulating microRNAs: Understanding the Limits for Quantitative Measurement by Real‐Time PCR,” which was published online on February 26, 2014, and appears with the February 2014 issue (J Am Heart Assoc. 2014;3:e000792 doi: 10.1161/JAHA.113.000792), was originally published without the author's corrections.
The corrections have been made to the current online version of the article, which is available at http://jaha.ahajournals.org/content/3/1.toc. The Publisher regrets the error.
Sources of Funding
Hardikar is an Australian Future Fellow funded through the Australian Research Council. Joglekar is a JDRF post‐doctoral researcher supported by the Juvenile Diabetes Research Foundation, USA. Farr is a recipient of the Australian Postgraduate Award. Authors acknowledge infrastructure support from the National Health and Medical Research Council—Clinical Trials Centre and the Rebecca L. Cooper Foundation, Australia.
Disclosures
All authors have no conflicts of interest/relationships with pharmaceutical companies, biomedical device manufacturers, or other corporations whose products or services are related to the subject matter of the article.
References
- Sato F, Tsuchiya S, Terasawa K, Tsujimoto G. Intra‐platform repeatability and inter‐platform comparability of microRNA microarray technology. PLoS One. 2009; 4:e5540. [DOI] [PMC free article] [PubMed] [Google Scholar]
- Jensen SG, Lamy P, Rasmussen MH, Ostenfeld MS, Dyrskjot L, Orntoft TF, Andersen CL. Evaluation of two commercial global miRNA expression profiling platforms for detection of less abundant miRNAs. BMC Genomics. 2011; 12:435. [DOI] [PMC free article] [PubMed] [Google Scholar]
- Git A, Dvinge H, Salmon‐Divon M, Osborne M, Kutter C, Hadfield J, Bertone P, Caldas C. Systematic comparison of microarray profiling, real‐time PCR, and next‐generation sequencing technologies for measuring differential microRNA expression. RNA. 2010; 16:991-1006 [DOI] [PMC free article] [PubMed] [Google Scholar]
- Karlsen F, Steen HB, Nesland JM. SYBR green I DNA staining increases the detection sensitivity of viruses by polymerase chain reaction. J Virol Methods. 1995; 55:153-156 [DOI] [PubMed] [Google Scholar]
- Schneeberger C, Speiser P, Kury F, Zeillinger R. Quantitative detection of reverse transcriptase‐PCR products by means of a novel and sensitive DNA stain. PCR Methods Appl. 1995; 4:234-238 [DOI] [PubMed] [Google Scholar]
- Holland PM, Abramson RD, Watson R, Gelfand DH. Detection of specific polymerase chain reaction product by utilizing the 5′—3′ exonuclease activity of Thermus aquaticus DNA polymerase. Proc Natl Acad Sci USA. 1991; 88:7276-7280 [DOI] [PMC free article] [PubMed] [Google Scholar]
- Ji F, Yang B, Peng X, Ding H, You H, Tien P. Circulating microRNAs in hepatitis B virus‐infected patients. J Viral Hepat. 2011; 18:e242-e251 [DOI] [PubMed] [Google Scholar]
- Ng EK, Chong WW, Jin H, Lam EK, Shin VY, Yu J, Poon TC, Ng SS, Sung JJ. Differential expression of microRNAs in plasma of patients with colorectal cancer: a potential marker for colorectal cancer screening. Gut. 2009; 58:1375-1381 [DOI] [PubMed] [Google Scholar]
- Youssef YM, White NM, Grigull J, Krizova A, Samy C, Mejia‐Guerrero S, Evans A, Yousef GM. Accurate molecular classification of kidney cancer subtypes using microRNA signature. Eur Urol. 2011; 59:721-730 [DOI] [PubMed] [Google Scholar]
- Williams AE, Larner‐Svensson H, Perry MM, Campbell GA, Herrick SE, Adcock IM, Erjefalt JS, Chung KF, Lindsay MA. MicroRNA expression profiling in mild asthmatic human airways and effect of corticosteroid therapy. PLoS One. 2009; 4:e5889. [DOI] [PMC free article] [PubMed] [Google Scholar]
- Clape C, Fritz V, Henriquet C, Apparailly F, Fernandez PL, Iborra F, Avancès C, Villalba M, Culine S, Fajas L. miR‐143 interferes with ERK5 signaling, and abrogates prostate cancer progression in mice. PLoS One. 2009; 4:e7542. [DOI] [PMC free article] [PubMed] [Google Scholar]
- Nohata N, Hanazawa T, Kikkawa N, Mutallip M, Sakurai D, Fujimura L, Kawakami K, Chiyomaru T, Yoshino H, Enokida H, Nakagawa M, Okamoto Y, Seki N. Tumor suppressive microRNA‐375 regulates oncogene AEG‐1/MTDH in head and neck squamous cell carcinoma (HNSCC). J Hum Genet. 2011; 56:595-601 [DOI] [PubMed] [Google Scholar]
- Chen X, Liang H, Guan D, Wang C, Hu X, Cui L, Chen S, Zhang C, Zhang J, Zen K, Zhang CY. A Combination of Let‐7d, Let‐7g and Let‐7i Serves as a Stable Reference for Normalization of Serum microRNAs. PLoS One. 2013; 8:e79652. [DOI] [PMC free article] [PubMed] [Google Scholar]
- Mestdagh P, Vlierberghe P, Weer A, Muth D, Westermann F, Speleman F, Vandesompele J. A novel and universal method for microRNA RT‐qPCR data normalization. Genome Biol. 2009; 10:R64. [DOI] [PMC free article] [PubMed] [Google Scholar]