

Introduction
Myocardial ischemia is commonly associated with coronary artery disease as well as many congenital and acquired heart diseases without obstructed coronary arteries. With brief ischemia ventricular function is impaired but myocytes recover, whereas prolonged ischemia causes necrosis and associated fibrosis. Necrosis may be confluent, as in complete obstruction of a branch coronary artery, or patchy, as with intermittent decreases of regional blood flow, for example in aortic stenosis. These ischemic changes are predominantly subendocardial in either ventricle.1–2 Once assessed by an appropriately designed study, knowledge of whether these ischemic changes are likely might be useful in determining the timing of surgery, for example, deciding when to replace an aortic valve. It seems reasonable to repair the lesion before permanent myocardial damage has occurred.
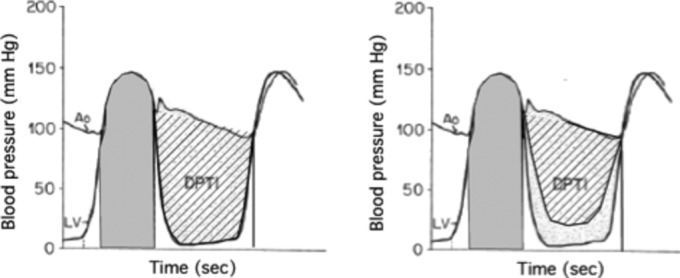
In 1972, Buckberg et al3 showed that an index based on left ventricular and aortic pressures could predict subendocardial ischemia. They argued that the area between the diastolic aortic and left ventricular pressures (DPTI) represented the oxygen supply to the myocardium, and the area under the systolic left ventricular pressure curve (SPTI) represented the oxygen demand by the myocardium (Figure 1). (Strictly speaking, the myocardium does not “demand” oxygen but “needs” it. The term “supply:demand ratio” is, however, firmly established and it would be confusing to change it now.)
Figure 1.
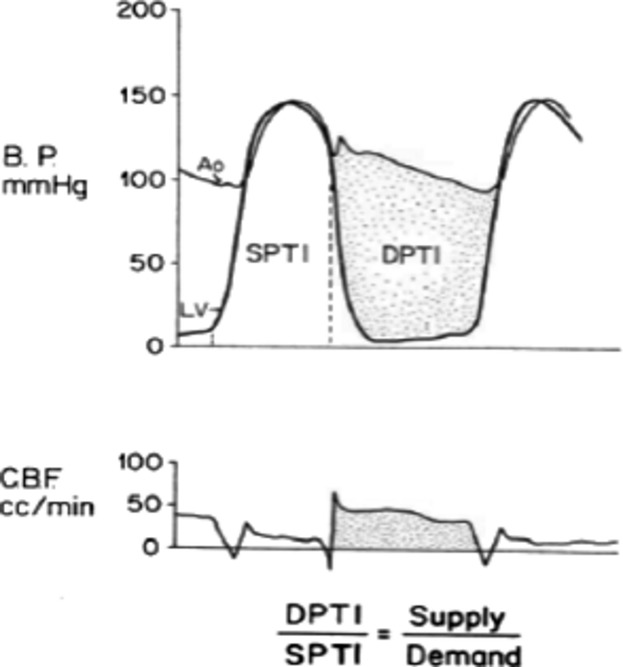
The measurement of diastolic (DPTI) and systolic (SPTI) indexes and their relation to phasic coronary blood flow (CBF) in a dog. B.P. indicates blood pressure; DPTI, diastolic pressure‐time index; SPTI, systolic pressure‐time index. Reproduced from Hoffman and Buckberg.2
Using models of heart disease in anaesthetized dogs, they found that after a critical value of the ratio was reached the ratio of these 2 areas correlated well with decreased subendocardial blood flow relative to subepicardial blood flow as measured by radioactive microspheres (Figure 2). This flow ratio is often termed the endo:epi or the inner:outer flow ratio. (The subendocardial and subepicardial layers were each about one‐third of the free wall thickness.)
Figure 2.
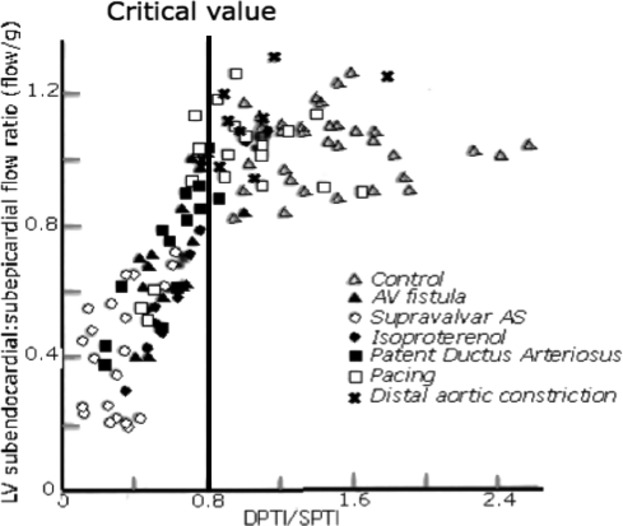
Relative subendocardial blood flow related to the supply:demand ratio (DPTI/SPTI). AS indicates aortic stenosis; AV, arteriovenous; LV, left ventricle; DPTI, diastolic pressure‐time index; SPTI, systolic pressure‐time index. Redrawn from Hoffman and Buckberg.2
The rationale for the relationship shown in Figure 2 is that as perfusion pressure is decreased, autoregulation ceases first in the subendocardial region4–5 (Figure 3). Once autoregulation fails, myocardial blood flow is pressure dependent; a decreased perfusing pressure cannot be compensated for by vasodilatation, with resulting ischemia, or an increased myocardial oxygen need at a given perfusing pressure cannot increase flow, again resulting in ischemia.
Figure 3.
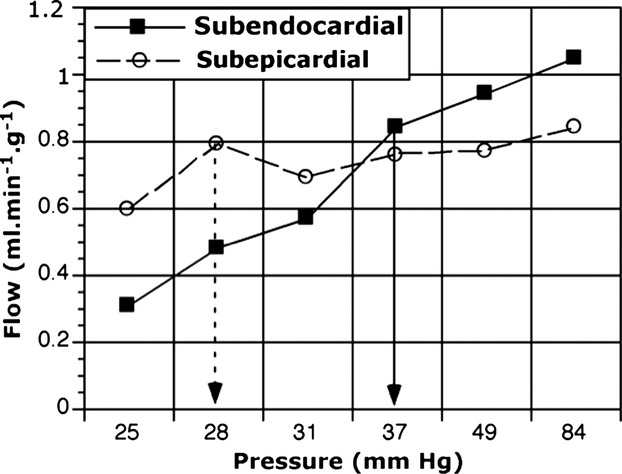
Regional autoregulation in the conscious dog. The failure of autoregulation to maintain subendocardial blood flow occurs below a perfusion pressure of about 38 mm Hg, whereas in the subepicardium flow is maintained down to about 28 mm Hg. Based on data published by Canty.4
Because subepicardial flow is protected until perfusion pressures fall to very low levels, using subepicardial flow as a reference level to show how much flow the muscle requires avoids the need to measure absolute flows. Normally, flow per gram per minute is about 1 to 1.2 times higher in the subendocardium than in the subepicardium.5–6
Although these studies did not provide direct evidence of ischemia, the association of subendocardial hypoperfusion with biochemical changes of ischemia7 and decreased regional function4,8–10 is well established.
Using the supply:demand index to predict subendocardial hypoperfusion (and ischemia) can be considered proof of concept, but there are many barriers to its application in humans. The remainder of this review discusses how to overcome these. The first part considers how the ratio as measured at cardiac catheterization can be modified for greater accuracy. The second part considers whether there are noninvasive techniques that would be useful for serial measurements of the myocardial oxygen supply:demand ratio.
Cardiac Catheterization
Diastolic Pressure‐Time Index
The basis for using DPTI as an index of oxygen supply is the resistance formula:
If the coronary vessels are maximally dilated, then for diastolic flow the formula becomes
where PAo and PLVd are aortic and left ventricular diastolic pressures respectively. There is some evidence that the true pressure drop is from aorta to a waterfall pressure of about 11 mm Hg.11 Given the other errors of measurement, it is doubtful if this correction is warranted.
(All flow from the epicardial coronary arteries into the subendocardium occurs in diastole.12 The systolic flow seen at the origin of the left coronary artery [Figure 1] distends and is stored within the extramural artery, although some flow may nourish the outermost subepicardial myocytes.)
Because diastole is only part of the cycle we must multiply the mean pressure difference by the duration of diastole to determine the area between the left atrial and left ventricular pressure curves.
The equation above yields flow, and what we want is oxygen supply. To derive this, multiply the area (representing flow) by the arterial oxygen content. (Arterial oxygen content [mL.100 mL blood−1]=oxygen carrying capacity [mL.g−1 Hb.100 mL−1]×hemoglobin oxygen saturation [%]=1.36×Hb concentration [g.100 mL−1]×0.99, as long as arterial Po2 is >80 torr. Thus for a hemoglobin concentration of 15 g.100 mL−1 and normal oxygen saturation, the oxygen content is 1.36×15=20.4 mL.100 ml−1 blood, ignoring the tiny amount of dissolved oxygen.) The importance of oxygen capacity was shown by Brazier et al13 who varied the hemoglobin concentration with or without a supravalvar aortic stenosis, and showed that oxygen content had to be incorporated in the index in order to obtain a consistent relationship (Figure 4).
Figure 4.

Left panel relates the myocardial oxygen supply:demand ratio to the endo:epi ratio, and shows poor correlation. Right panel shows a better relationship between the endo:epi ratio and the myocardial oxygen supply:demand ratio multiplied by arterial oxygen content. In this panel the critical value at which the endo:epi ratio begins to decrease is 8 to 10. AS indicates aortic stenosis; LV, left ventricle; DPTI, diastolic pressure‐time index; SPTI, systolic pressure‐time index. Redrawn from Brazier et al.13
Although similar experiments have not been done with hypoxemia, a similar correction should apply.
This correction has changed a measure of flow supply into a measure of oxygen supply, but this is still an index and not a true oxygen supply, because it does not consider the vascular resistance. In normal dogs and humans, the minimal resistance of normal coronary vessels probably lies within narrow limits. In many chronic cardiac diseases, the small intramural arteries are thickened and have narrowed lumens.14–16 Without measuring resistance there is no way to know to how much the minimal resistance is raised; increases up to 40% have been described.15,17 The best we can do is to set an upper limit for the oxygen supply by assuming that the resistance is normal.
We can, however, allow for changes in blood viscosity at different hematocrits. As an approximation, a hematocrit of 20% has a viscosity that is half normal, and a hematocrit of 75% has a viscosity about double normal. If hematocrit is abnormal, we must divide DPTI by the relative viscosity to estimate the maximal flow at that hematocrit.
We conclude that left ventricular myocardial oxygen supply can be represented by
where the constant of proportionality is related to the minimal coronary vascular resistance.
Systolic Pressure‐Time Index
Using SPTI to estimate myocardial oxygen usage stems from the time‐tension index (TTI) of Sarnoff.18 This index is not ideal because myocardial oxygen usage is more closely related to wall stress than to pressure and because it does not take muscle mass or contractility into account.
One of the main determinants of myocardial oxygen usage is peak systolic meridional wall stress; the term tension is also used loosely, although some define stress as tension divided by area. Meridional stress is stress in the long axis of the left ventricular wall. Stress calculation is based on the law of LaPlace for thin‐walled cylinders:
where P=pressure, r=radius, and h=wall thickness. Because of geometric assumptions about the left ventricle, various methods of approximating the average stress have been developed. They all use left ventricular pressure, the radius or diameter of the left ventricular cavity short‐axis cross‐section (and sometimes the long axis dimension), and left ventricular wall thickness (postero‐lateral wall, septum, or an average). Because of methodological differences the absolute values may differ by up to 100%, but relative changes are still usable.
Two of the commonly used formulas are:
 , where h is the wall thickness, r is the internal radius, and P is peak systolic pressure. The factor of 1.33 converts mm Hg to kdynes.cm−2. The normal values in humans are 123 to 179 kdynes.cm−2. This formula is perhaps the one that is best validated in humans.19 Because the different components of the formula may reach their maxima at different times in the cardiac cycle, they are measured repeatedly during the cycle and the maximum stress value is taken.
A variant of the above formula to eliminate the iterative procedure is
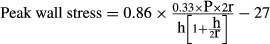 , with the correction factors used to convert peak left ventricular systolic pressure (P) to peak systolic stress which occurs earlier than peak pressure. The normal values are 137 (28 sd) kdynes.cm−2.20
Echocardiography has replaced ventriculography to measure wall thickness and chamber diameter non‐invasively throughout the cardiac cycle, and thus derive the stress measurements. It is also possible to measure left ventricular mass by echocardiography (see below).
Relationship Among LV Mass, Peak Systolic Tension and LV Myocardial Oxygen Consumption
In adult humans, the left ventricular mass index averages 55 to 95 g.m−2.17,19,21 There is much normal variation related to gender, physical fitness, and age. An abnormal increase in LV mass implies hypertrophy that may cause a 2‐ to 3‐fold increase in LV mass.22
Resting myocardial oxygen consumption is normally 8 to 13 mL.100 g−1.min−1.17,23 At rest, it is linearly related to LV mass (Figure 5).
Figure 5.

Relation of resting left ventricular myocardial oxygen consumption (LVO2) to LV mass, based on data from Strauer.17 The regression line has the equation LVO2=0.1036 LV−2.12 mass. The dashed lines show the 95% confidence limits for points, and the standard deviation from regression is 2.22.
Resting LV myocardial oxygen consumption (mL.min−1) is also linearly related to peak meridional wall stress (kdynes.cm−2).17 Doubling wall tension approximately doubles LV oxygen consumption.
Hypertrophy and Myocardial Blood Flow
If hypertrophy is acquired after infancy intramyocardial vessels must at the very least lengthen to maintain flow across the thickened wall. There may also be other changes. In one recent study in mice,24 left ventricular pressure overload increased the number of microvessels early, but subsequently their number decreased. These microvessels were mainly capillaries that play little role in coronary vascular resistance, and there is no or little growth of the resistance vessels.
Therefore with maximal vasodilatation a given perfusion pressure produces about the same total myocardial blood flow in a hypertrophied as in a normal left ventricle. As a result, the maximal flow per unit mass of myocardium decreases.25–28 During autoregulation, though, resting flow is increased by hypertrophy to supply the increased oxygen needs of the myocardium. This produces a decrease in coronary flow reserve29 so that less flow is available to meet increased usage with exercise9–10,9–31 or tachycardia.32
If hypertrophy occurs in utero or at birth, however, there may be an increased growth of intramyocardial resistance vessels so that maximal flow per unit mass is normal. This has been well demonstrated in the right ventricle33–36 but has not been shown for the left ventricle37 except for thyroxine‐induced left ventricular hypertrophy in the rat.38 Therefore, it is not clear if we need to make an allowance for an increased vascular bed in children with severe aortic stenosis in infancy.
Ventricular hypertrophy is an adaptive response to pressure or volume overload that tends to keep wall stress normal, although if the overload persists or increases maladaptation leads to pathological changes. Most patients with concentric hypertrophy due, for example, to aortic stenosis, have an abnormally high systolic ventricular pressure that would increase wall stress except for the fact that compensatory changes in wall thickness and ventricular radius usually prevent this increase in wall stress. With eccentric hypertrophy, as in aortic or mitral regurgitation, the increased ventricular radius would raise wall stress except that its effect is counterbalanced by a modest increase in wall thickness. (Athletes may also have substantial LV hypertrophy, but for unknown reasons have normal ventricular function and no long‐term pathological consequences.) For these reasons, many patients with these lesions have been found to have normal peak systolic meridional wall stress17,19,39–41 so that we do not need to allow for changes in stress‐derived myocardial oxygen consumption. We should, however, allow for the increased muscle mass, and this can be done simply by multiplying SPTI by the relative LV mass as determined by echocardiography, CT, or MRI. On the other hand, there are patients who deteriorate and dilate their ventricles, or who have inappropriate hypertrophy,42 and in these wall stress may be increased, sometimes markedly. It would therefore be safer to estimate wall stress rather than to assume that it is normal.
Some patients decompensate acutely with increasing LV dilatation and decreasing ejection fraction, particularly with added stress from infection or noncardiac illness. The radius (r) increases and the wall thickness (h) decreases, thereby increasing wall stress, sometimes markedly.17,43 It is possible to calculate the increase in wall stress and use this as a multiplier for oxygen consumption.
Determining LV Mass
LV mass can be determined by imaging methods such as echocardiography, angiography, computerized tomography, or magnetic resonance imaging. For accuracy, some type of geometric correction for shape, for example, the trapezoidal (Simpson's) method can be used, but is tedious. A simpler method is based on echocardiographic measurements of LV internal diameter (LVID), and the thickness of the interventricular septum (IVST) and posterior free wall (PWT), measured just below the tips of the mitral valves at end‐diastole.44 Using the Penn convention of excluding endocardial thickness from the wall thickness measurements and including it in the measurement of cavity diameter, a close linear relation was found between anatomic mass and that calculated from a simple cube formula:
(see Figure 6).
Figure 6.

Relation between anatomic and calculated left ventricular mass (LVM).44 IVST indicates interventricular septum; MMT, mean myocardial thickness; PWT, posterior free wall. Reproduced with permission of the publishers.
Effect of Heart Rate
Tachycardia affects the areas that make up the myocardial oxygen supply:demand ratio by shortening the relative duration of diastole,45 and is taken into account when measuring the supply:demand ratio, which is the same whether calculated per beat or per minute. Extreme tachycardia can produce ischemia in normal hearts.3,46–47 but is more likely to do so when there is left ventricular hypertrophy48 or even aortic stenosis without hypertrophy.49 Tachycardia, however, also increases contractility so that it exaggerates the effect of a low supply:demand ratio. Canty et al50 found that doubling the heart rate in conscious dogs increased the threshold at which subendocardial autoregulation failed from 40 to 60 mm Hg (see Figure 3).
Increased Contractility
Increased contractility due to isproterenol infusion was studied by Buckberg and Ross.51 In anesthetized dogs they observed that the critical DPTI:SPTI ratio at which relative subendocardial perfusion occurred was raised from 0.8 to 1–1.1, suggesting that myocardial oxygen consumption was increased by about 25% over and above any mechanical changes to the supply:demand ratio areas. A similar increase in myocardial oxygen consumption relative to TTI was observed in humans.52 Graham et al53 found that when peak developed tension was controlled in the anesthetized dog ventricle, a 42% increase in Vmax produced by infusing norepinephrine produced the same increase in myocardial oxygen consumption as an 83% increase in peak developed tension, and derived the formula:
In practice, correcting for contractility is seldom needed except during maximal inotropic stimulation in the intensive care unit. The best correction method remains to be found.
Heart Disease
There is little information about the value of the supply:demand ratio in humans with heart disease. In 1975 Buckberg et al54 compared 4 patients who had aortic stenosis but normal lactate metabolism before and after isoproterenol administration with 4 other aortic stenosis patients who had reduced lactate extraction or lactate production after isoproterenol was given. The first group had a DPTI:SPTI ratio of 0.55±0.06 at rest and 0.41±0.06 after isoproterenol, whereas the second group had a ratio of 0.34±0.05 at rest and 0.16±0.04 after isoproterenol. Left ventricular mass and hematocrit were not mentioned.
Since that time several studies of patients with aortic valve disease but normal coronary arteries have been reported in which an attempt was made to relate the DPTI/SPTI ratio (corrected or uncorrected) to symptoms or signs of ischemia. They are summarized in Table 1.
Table 1.
Ischemia and DPTI/SPTI Ratio in Humans
| Investigator | Lesion | Number Patients | No Ischemia | Ischemia | Comment | ||
|---|---|---|---|---|---|---|---|
| Test | Index | Test | Index | ||||
| Buckberg et al3 | VAS | 8 | No lactate production | 0.55 0.41(iso) |
Lactate production | 0.34 0.16 (iso) |
|
| Bertrand et al22 | VAS/AR | 46 | No angina: rest exercise | 0.6 to 0.9 0.5 to 0.8 |
Angina: rest exercise | 0.45 to 0.7 0.22 to 0.5 |
LV mass 2 to 3× normal |
| Lewis et al48 | VAS | 80 | Normal T waves | (>8c) | Abnormal T waves | (<10c) | |
| Vincent et al | VAS/SVAS | 1/1 | Abnormal T waves | (<7c) | |||
| Krovetz and Kurlinski | VAS | 45 | No symptoms | 0.43 to 1.68 | Symptoms: mild or severe | <0.9 | |
| Smucker et al | VAS | 9 | Lactate extraction | 0.51 | Lactate production (iso) | 0.37 | Before operation |
| Swanton et al | VAS | 108 | No angina | 0.62 (sd 0.24) | Angina | 0.49 (sd 0.18) | LV mass 362 g with angina, 291 g without |
| Badano et al43 | AR | 53 | No angina | >0.51 | Angina (#6) | <0.51 | |
| Barnard et al55 | Normal | Normal ST segment | >0.45 (or >9c) | Ischemic ST segment | <0.45 or <9c | ||
AR indicates aortic regurgitation; c, corrected for arterial oxygen content; DPTI, diastolic pressure‐time index; iso, after isoproterenol infusion; SPTI, systolic pressure‐time index; SVAS, supravalvar aortic stenosis; VAS, valvar aortic stenosis.
A group of Newfoundland dogs with congenital subaortic stenosis had a left ventricular mass 1.67 times that of the control dogs. If the true critical value of the DPTI/SPTI ratio is 0.45 without hypertrophy, then 0.45×1.67=0.75, close to the critical value of 0.8 below which subendocardial hypoperfusion occurred in these dogs.56
Although none of these studies included left ventricular mass in the formulas, it seems that an uncorrected DPTI/SPTI ratio <0.45 to 0.5 (equivalent to a ratio corrected for arterial oxygen content of 9 to 10) should raise suspicion about subendocardial ischemia. Furthermore, even if absolute numbers are not entirely reliable, a change towards a lower ratio suggests the need for further investigations or intervention.
Indirect Measurement of Supply:Demand Ratio
During cardiac catheterization the 2 areas can be determined easily. It would be preferable, however, to have less invasive methods so that serial measurements could be made. A relatively simple but still invasive method is to obtain a brachial intra‐arterial pressure. This provides systolic and diastolic time intervals as well as pressures throughout the cycle. In the intensive care unit this could be supplemented by estimating left ventricular diastolic pressure from the pulmonary arterial wedge pressure. Nevertheless, the true measurements of DPTI and SPTI as defined by cardiac catheterization will not be obtained (Figure 7).
Figure 7.
Left panel: Using a central arterial tracing underestimates SPTI (shaded area) and overestimates DPTI (cross‐hatched area).46 Right panel: Added effect of raised left ventricular diastolic pressure. DPTI indicates diastolic pressure‐time index; SPTI, systolic pressure‐time index.
Relative prolongation of systole occurs in many patients with heart disease.45,57 The prolongation of systole is associated with a decrease in contractility and prolonged time for left ventricular pressure to fall at the end of systole, both of which tend to increase SPTI and decrease DPTI.
There is also an error in estimating DPTI if we assume a left ventricular diastolic pressure of 10 mm Hg. Many patients with heart disease have mean left ventricular diastolic pressures >10 mm Hg. Chemla et al58 noted in 11 patients with miscellaneous heart disease that a change from 10 to 20 mm Hg in left ventricular end diastolic pressure decreased the supply:demand ratio by about 20%.
SPTI is overestimated by the peripheral augmentation effect that causes peak brachial systolic blood pressure to exceed peak central aortic blood pressure by <21 mm Hg or even more.59–60 This problem can be overcome by using one of the recently developed oscillometric or tonometric methods together with a routine sphygmomanometer blood pressure measurement. Applying certain algorithms allows the central blood pressure curve to be determined with minimal error.59–61 Commercial devices made by SphygmoCor, Mobil‐O‐Graph, CardioMon and Portapres perform these functions.
Application to Normal Humans
A test of the ratio in humans was provided by having healthy firemen perform strenuous exercise on a treadmill either after a warm‐up period or on another occasion without a warm‐up period.55 A brachial artery needle was used to obtain pressures. When exercise was preceded by a warm‐up period the electrocardiogram remained normal except for appropriate tachycardia, but when strenuous exercise started abruptly the electrocardiogram in the first 30 seconds showed prominent ischemic ST depression in the left chest leads. Examples of the brachial arterial pressures are shown in Figure 8.
Figure 8.
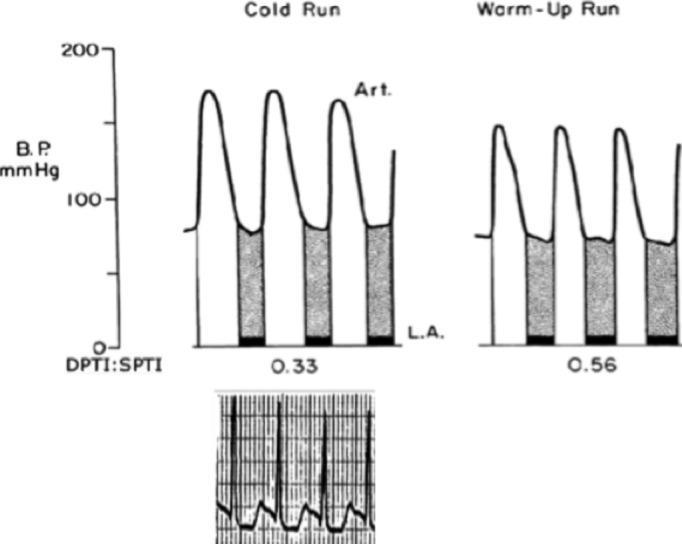
Effect of sudden strenuous exercise (cold run) and similar exercise after a warm‐up period (warm‐up run). In the cold run SPTI was increased by a higher peak pressure and a longer duration of systole, and DPTI was reduced by the shortened diastole. A typical ischemic pattern ECG is shown for the cold run. Adapted from Barnard et al.55 Note the prolonged systole shown during the cold run. DPTI indicates diastolic pressure‐time index; SPTI, systolic pressure‐time index.
When the investigators examined the results, they observed that all subjects with a DPTI:SPTI ratio <0.45 had ischemic changes on the electrocardiogram, whereas the electrocardiogram was normal whenever DPTI:SPTI exceeded 0.45. This is below the critical value of 0.8 found in the dog experiments, and is probably explained by the fact that in the dog subendocardial autoregulation fails at a mean coronary perfusion pressure of 70 mm Hg when anaesthetized but at 38 mm Hg when conscious.4 (This difference implies that at times anesthesia for noncardiac purposes may cause subendocardial ischemia if the resting supply:demand ratio is just above the critical value.)
There is another possible reason why in normal humans the critical DPTI/SPTI ratio was 0.45 but in normal dogs and in aortic stenosis in both dogs and humans was about 0.8. In the initial dog experiments,3 acutely increasing the severity of, for example, supravalvar aortic stenosis, would probably have caused the heart to handle the increased load by means of the Frank‐Starling mechanism, that is, by dilating the left ventricle. This would have thinned the wall and substantially increased wall stress, so that oxygen demand was increased over and above any effect that the procedure had on SPTI. In dogs and humans with aortic stenosis, however, wall tension usually remains normal but left ventricular mass increases, also elevating myocardial oxygen demand more than the increase in SPTI. If the product of wall stress and left ventricular mass was approximately constant in the 2 different sets of studies, that might explain why the critical DPTI/SPTI ratio was similar in normal and pathological hearts, even though left ventricular mass was not allowed for in any of the human studies.
Right Ventricle
Can we apply a SPTI/DPTI index to the right ventricle? In principle the involved factors should be similar in both ventricles, but differences in ventricular geometry and pressures modify the index. Unlike the left ventricle that receives blood from the left coronary artery almost exclusively in diastole, the normal right coronary artery has almost as much flow in systole as in diastole.62–63 As this means that some right ventricular myocardial perfusion occurs during systole, it seems appropriate to regard the supply area as the difference between the aortic and right ventricular pressures throughout the cardiac cycle, as proposed by Cross.64 Cross termed this the right coronary driving pressure, and others have termed it the pressure index (PI).65 As for the left ventricle, correction for arterial oxygen content is preferred. Because of this physiology, any increase in right ventricular systolic pressure not only increases myocardial oxygen usage but also decreases the driving (supply) pressure.
Determining the oxygen needs of the right ventricle is even more difficult than for the left ventricle. Not only are there substantial geometric differences, but there may be differences between the right ventricular free wall and the septum. Because it is difficult to measure all the right ventricular venous drainage, our knowledge of right ventricular myocardial oxygen consumption is limited. Flow.min−1.g−1 is about 60% to 70% of that in the left ventricle.33,66–67 Oxygen extraction is similar in both ventricles,68 so that right ventricular myocardial oxygen consumption min−1.g−1 is about 60% to 70% of that in the left ventricle. The basic mechanisms affecting oxygen usage are probably similar in both ventricles, with pressure work having a greater effect than volume work per se, but there are no detailed studies of the relationship between right ventricular wall stress and right ventricular oxygen usage.
Fixler et al65,69 examined the relationships among right ventricular driving pressure (PI), area under the right ventricular pressure curve in systole (TTI), regional and total right ventricular myocardial blood flow, and reactive hyperemia. They found that the normal PI/TTI ratio was about 10, decreased to 5.6 with mild/moderate right ventricular pressure overload, and with severe pressure overload decreased to 2.4 at which stage reactive hyperemia disappeared. There was no change in the endo:epi ratio of the right ventricle so that ischemia was global. In a later study,70 when the pulmonary artery was constricted until severe congestive heart failure occurred, the endo:epi ratio decreased from 0.94 in control state to 0.75, suggesting preferential subendocardial ischemia. A similar experiment in awake dogs71 found that the control endo:epi ratio of 1.36 decreased to 0.77 during congestive heart failure secondary to acute pressure overload, confirming predominant subendocardial hypoperfusion. In these studies of congestive heart failure secondary to acute marked pulmonary artery narrowing, increasing right ventricular blood flow via a cannula in the right coronary artery,72 partly occluding the descending aorta to raise aortic pressure,71 or raising aortic pressure with neosynephrine,70 reversed the congestive heart failure and restored right ventricular function without removing the pulmonary artery obstruction. Conversely, experimental right ventricular systolic hypertension secondary to pulmonic stenosis in which right ventricular function is well maintained may develop into congestive heart failure if the driving pressure is decreased further by opening systemic to pulmonary artery shunt.73 The clinical conterpart to this is the patient with a tetralogy of Fallot who has too large a Blalock‐Taussig shunt created.
When there is right ventricular hypertrophy, if it had occurred in late childhood or adult life, total right ventricular myocardial blood flow is increased but coronary flow reserve is decreased. The flow pattern in the right coronary artery resembles that in the left coronary artery,62 and it is likely but unproven that the DPTI/SPTI index as used for the left ventricle will predict right ventricular subendocardial ischemia.
Conclusions
Even with its imperfections, the existing DPTI/SPTI ratio suggests the likelihood of subendocardial ischemia in normal hearts if the ratio is <0.45 or, corrected for arterial oxygen content, <9. Subendocardial ischemia probably occurs at higher ratios with large increases in left ventricular mass or dilatation, with critical values of 0.8 (or corrected for oxygen content of about 16) being reasonable. The best current supply:demand index that incorporates all the major variables except for contractility is
Because most patients with compensated left ventricular hypertrophy have normal systolic peak meridional wall stress, the only correction usually needed for SPTI would be to multiply it by relative ventricular mass. Even without this correction, however, changes in the ratio can suggest improvement or deterioration of subendocardial perfusion and oxygen supply.
Disclosures
None.
References
- 1.Hoffman JIE. Heterogeneity of myocardial blood flow. Basic Res Cardiol. 1995; 90:103-111 [DOI] [PubMed] [Google Scholar]
- 2.Hoffman JIE, Buckberg GD. Transmural variations in myocardial perfusion. Prog Cardiol. 1976; 5:37-89 [Google Scholar]
- 3.Buckberg GD, Fixler DE, Archie JP, Hoffman JI. Experimental subendocardial ischemia in dogs with normal coronary arteries. Circ Res. 1972; 30:67-81 [DOI] [PubMed] [Google Scholar]
- 4.Canty JM., Jr Coronary pressure‐function and steady‐state pressure‐flow relations during autoregulation in the unanesthetized dog. Circ Res. 1988; 63:821-836 [DOI] [PubMed] [Google Scholar]
- 5.Feigl EO. Coronary physiology. Physiol Rev. 1983; 63:1-205 [DOI] [PubMed] [Google Scholar]
- 6.Vermeltfoort IA, Raijmakers PG, Lubberink M, Germans T, van Rossum AC, Lammertsma AA, Knaapen P. Feasibility of subendocardial and subepicardial myocardial perfusion measurements in healthy normals with (15)o‐labeled water and positron emission tomography. J Nucl Cardiol. 2011; 18:650-656 [DOI] [PMC free article] [PubMed] [Google Scholar]
- 7.Zhang J, Ugurbil K, From AH, Bache RJ. Myocardial oxygenation and high‐energy phosphate levels during graded coronary hypoperfusion. Am J Physiol Heart Circ Physiol. 2001; 280:H318-H326 [DOI] [PubMed] [Google Scholar]
- 8.Vatner SF. Correlation between acute reductions in myocardial blood flow and function in conscious dogs. Circ Res. 1980; 47:201-207 [DOI] [PubMed] [Google Scholar]
- 9.Hittinger L, Patrick T, Ihara T, Hasebe N, Shen YT, Kalthof B, Shannon RP, Vatner SF. Exercise induces cardiac dysfunction in both moderate, compensated and severe hypertrophy. Circulation. 1994; 89:2219-2231 [DOI] [PubMed] [Google Scholar]
- 10.Hittinger L, Shannon RP, Kohin S, Manders WT, Kelly P, Vatner SF. Exercise‐induced subendocardial dysfunction in dogs with left ventricular hypertrophy. Circ Res. 1990; 66:329-343 [DOI] [PubMed] [Google Scholar]
- 11.Uhlig PN, Baer RW, Vlahakes GJ, Hanley FL, Messina LM, Hoffman JIE. Arterial and venous coronary pressure‐flow relations in anesthetized dogs. Evidence for a vascular waterfall in epicardial coronary veins. Circ Res. 1984; 55:238-248 [DOI] [PubMed] [Google Scholar]
- 12.Flynn AE, Coggins DL, Goto M, Aldea GS, Austin RE, Doucette JW, Husseini W, Hoffman JIE. Does systolic subepicardial perfusion come from retrograde subendocardial flow? Am J Physiol Heart Circ Physiol. 1992; 262:H1759-H1769 [DOI] [PubMed] [Google Scholar]
- 13.Brazier J, Cooper N, Buckberg GD. The adequacy of subendocardial oxygen delivery: the interaction of determinants of flow, arterial oxygen content and myocardial oxygen need. Circulation. 1974; 49:968-977 [DOI] [PubMed] [Google Scholar]
- 14.Schwartzkopff B, Frenzel H, Dieckerhoff J, Betz P, Flasshove M, Schulte HD, Mundhenke M, Motz W, Strauer BE. Morphometric investigation of human myocardium in arterial hypertension and valvular aortic stenosis. Eur Heart J. 1992; 13suppl D:17-23 [DOI] [PubMed] [Google Scholar]
- 15.Schwartzkopff B, Mundhenke M, Strauer BE. Alterations of the architecture of subendocardial arterioles in patients with hypertrophic cardiomyopathy and impaired coronary vasodilator reserve: a possible cause for myocardial ischemia. J Am Coll Cardiol. 1998; 31:1089-1096 [DOI] [PubMed] [Google Scholar]
- 16.Kwon DH, Smedira NG, Rodriguez ER, Tan C, Setser R, Thamilarasan M, Lytle BW, Lever HM, Desai MY. Cardiac magnetic resonance detection of myocardial scarring in hypertrophic cardiomyopathy: correlation with histopathology and prevalence of ventricular tachycardia. J Am Coll Cardiol. 2009; 54:242-249 [DOI] [PubMed] [Google Scholar]
- 17.Strauer B‐E. Myocardial oxygen consumption in chronic heart disease: role of wall stress, hypertrophy and coronary reserve. Am J Cardiol. 1979; 44:730-740 [DOI] [PubMed] [Google Scholar]
- 18.Sarnoff SJ, Braunwald E, Welch GH, Jr, Case RB, Stainsby WN, Macruz R. Hemodynamic determinants of oxygen consumption of the heart with special reference to the tension time index. Am J Physiol. 1958; 192:148-156 [DOI] [PubMed] [Google Scholar]
- 19.Grossman W, Jones D, McLaurin LP. Wall stress and patterns of hypertrophy in the human left ventricle. J Clin Invest. 1975; 56:56-64 [DOI] [PMC free article] [PubMed] [Google Scholar]
- 20.Wilson JR, Reichek N, Hirshfeld J. Noninvasive assessment of load reduction in patients with asymptomatic aortic regurgitation. Am J Med. 1980; 68:664-674 [DOI] [PubMed] [Google Scholar]
- 21.Cain PA, Ahl R, Hedstrom E, Ugander M, Allansdotter‐Johnsson A, Friberg P, Arheden H. Age and gender specific normal values of left ventricular mass, volume and function for gradient echo magnetic resonance imaging: a cross sectional study. BMC Med Imaging. 2009; 9:2. [DOI] [PMC free article] [PubMed] [Google Scholar]
- 22.Bertrand ME, LaBlanche JM, Tilmant PY, Thieuleux FP, Delforge MR, Carre AG. Coronary sinus blood flow at rest and during isometric exercise in patients with aortic valve disease. Mechanism of angina pectoris in presence of normal coronary arteries. Am J Cardiol. 1981; 47:199-205 [DOI] [PubMed] [Google Scholar]
- 23.Kitamura K, Jorgensen CR, Gobel FL, Taylor HL, Wang Y. Hemodynamic correlates of myocardial oxygen consumption during upright exercise. J Appl Physiol. 1972; 32:516-522 [DOI] [PubMed] [Google Scholar]
- 24.Sano M, Minamino T, Toko H, Miyauchi H, Orimo M, Qin Y, Akazawa H, Tateno K, Kayama Y, Harada M, Shimizu I, Asahara T, Hamada H, Tomita S, Molkentin JD, Zou Y, Komuro I. P53‐induced inhibition of HIF‐1 causes cardiac dysfunction during pressure overload. Nature. 2007; 446:444-448 [DOI] [PubMed] [Google Scholar]
- 25.Marchetti GV, Merlo L, Noseda V, Visioli O. Myocardial blood flow in experimental cardiac hypertrophy in dogs. Cardiovasc Res. 1973; 7:519-527 [DOI] [PubMed] [Google Scholar]
- 26.Holtz J, Von Restorff W, Bard P, Bassenge E. Transmural distribution of myocardial blood flow and of coronary reserve in canine left ventricular hypertrophy. Basic Res Cardiol. 1977; 72:286-292 [DOI] [PubMed] [Google Scholar]
- 27.O'Keefe DD, Hoffman JIE, Cheitlin R, O'Neill MJ, Allard JR, Shapkin E. Coronary blood flow in experimental canine left ventricular hypertrophy. Circ Res. 1978; 43:43-51 [DOI] [PubMed] [Google Scholar]
- 28.Mueller TM, Marcus ML, Kerber RE, Young YA, Barnes RW, Abboud FM. Effect of renal hypertension and left ventricular hypertrophy on the coronary circulation in dogs. Circ Res. 1978; 42:543-549 [DOI] [PubMed] [Google Scholar]
- 29.Hoffman JIE. Maximal coronary flow and the concept of coronary vascular reserve. Circulation. 1984; 70:153-159 [DOI] [PubMed] [Google Scholar]
- 30.Bache RJ, Vrobel TR, Ring WS, Emery RW, Anderson RW. Regional myocardial blood flow during exercise in dogs with chronic left ventricular hypertrophy. Circ Res. 1981; 48:76-87 [DOI] [PubMed] [Google Scholar]
- 31.Hittinger L, Shannon RP, Bishop SP, Gelpi RJ, Vatner SF. Subendomyocardial exhaustion of blood flow reserve and increased fibrosis in conscious dogs with heart failure. Circ Res. 1989; 65:971-980 [DOI] [PubMed] [Google Scholar]
- 32.Bache RJ, Arentzen CE, Simon AB, Vrobel TR. Abnormalities in myocardial perfusion during tachycardia in dogs with left ventricular hypertrophy: metabolic evidence for myocardial ischemia. Circulation. 1984; 69:409-417 [DOI] [PubMed] [Google Scholar]
- 33.Archie JP, Fixler DE, Ullyot DJ, Buckberg GD, Hoffman JIE. Regional myocardial blood flow in lambs with concentric right ventricular hypertrophy. Circ Res. 1974; 34:143-154 [DOI] [PubMed] [Google Scholar]
- 34.Vlahakes GJ, Turley K, Uhlig PN, Verrier ED, Hoffman JIE. Experimental model of congenital right ventricular hypertrophy created by pulmonary artery banding in utero. Surg Forum. 1981; 32:233-236 [Google Scholar]
- 35.Manohar M, Parks CM, Busch MA, Tranquilli WJ, Bisgard GE, McPherron TA, Theodorakis MC. Regional myocardial blood flow and coronary vascular reserve in unanesthetized young calves exposed to a simulated altitude of 3500 m for 8‐10 weeks. Circ Res. 1982; 50:714-726 [DOI] [PubMed] [Google Scholar]
- 36.Botham MJ, Lemmer JH, Gerren RA, Long RW, Behrendt DM, Gallagher KP. Coronary vasodilator reserve in young dogs with moderate right ventricular hypertrophy. Ann Thorac Surg. 1984; 38:101-107 [DOI] [PubMed] [Google Scholar]
- 37.Bache RJ, Alonyo D, Sublett E, Dai XZ. Myocardial blood flow in left ventricular hypertrophy developing in young and adult dogs. Am J Physiol. 1986; 251:H949-H956 [DOI] [PubMed] [Google Scholar]
- 38.Chilian WM, Wangler RD, Peters KG, Tomanek RJ, Marcus ML. Thyroxine‐induced left ventricular hypertrophy in the rat. Anatomical and physiological evidence for angiogenesis. Circ Res. 1985; 57:591-598 [DOI] [PubMed] [Google Scholar]
- 39.Hood WP, Rackley CE, Rolett EL. Wall stress in the normal and hypertrophied left ventricle. Am J Cardiol. 1968; 22:550-558 [DOI] [PubMed] [Google Scholar]
- 40.Groundstroem K, Huikuri H, Korhonen U, Ikaheimo M, Heikkila J, Torniainen P, Linnaluoto M, Takkunen J. Isometric exercise testing and echocardiography at rest in aortic valve incompetence. Nucl Med Commun. 1990; 11:279-287 [DOI] [PubMed] [Google Scholar]
- 41.Wagner JA, Stork S, Weidemann F, Strotmann J, Fiedel C, Ertl G, Voelker W. Natriuretic peptides and myocardial oxygen supply‐to‐demand ratio in patients with aortic stenosis. Eur J Clin Invest. 2007; 37:463-471 [DOI] [PubMed] [Google Scholar]
- 42.Kupari M, Turto H, Lommi J. Left ventricular hypertrophy in aortic valve stenosis: preventive or promotive of systolic dysfunction and heart failure? Eur Heart J. 2005; 26:1790-1796 [DOI] [PubMed] [Google Scholar]
- 43.Badano L, Rubartelli P, Giunta L, Della Rovere F, Miccoli F, Lucatti A. Relation between ECG strain pattern and left ventricular morphology, left ventricular function, and DPTI/SPTI ratio in patients with aortic regurgitation. J Electrocardiol. 1994; 27:189-197 [DOI] [PubMed] [Google Scholar]
- 44.Devereux RB, Reichek N. Echocardiographic determination of left ventricular mass in man. Anatomic validation of the method. Circulation. 1977; 55:613-618 [DOI] [PubMed] [Google Scholar]
- 45.Ferro G, Duilio C, Spinelli L, Spadafora M, Guarnaccia F, Condorelli M. Effects of beta blockade on the relation between heart rate and ventricular diastolic perfusion time during exercise in systemic hypertension. Am J Cardiol. 1991; 68:1101-1103 [DOI] [PubMed] [Google Scholar]
- 46.Parks C, Manohar M, Lundeen G. Regional myocardial blood flow and coronary vascular reserve in unanesthetized ponies during pacing induced ventricular tachycardia. J Surg Res. 1983; 35:119-131 [DOI] [PubMed] [Google Scholar]
- 47.Domenech RJ, Goich J. Effect of heart rate on regional coronary blood flow. Cardiovasc Res. 1976; 10:224-231 [DOI] [PubMed] [Google Scholar]
- 48.Lewis AB, Heymann MA, Stanger P, Hoffman JI, Rudolph AM. Evaluation of subendocardial ischemia in valvar aortic stenosis in children. Circulation. 1974; 49:978-984 [DOI] [PubMed] [Google Scholar]
- 49.Brazier JR, Buckberg GD. Effects of tachycardia on the adequacy of subendocardial oxygen delivery in experimental aortic stenosis. Am Heart J. 1975; 90:222-230 [DOI] [PubMed] [Google Scholar]
- 50.Canty JM, Jr, Giglia J, Kandath D. Effect of tachycardia on regional function and transmural myocardial perfusion during graded coronary pressure reduction in conscious dogs. Circulation. 1990; 82:1815-1825 [DOI] [PubMed] [Google Scholar]
- 51.Buckberg GD, Ross G. Effects of isoprenaline on coronary blood flow: its distribution and myocardial performance. Cardiovasc Res. 1973; 7:429-437 [DOI] [PubMed] [Google Scholar]
- 52.Krasnow N, Rolett EL, Yurchak PM, Hood WB, Jr, Gorlin R. Isoproterenol and cardiovascular performance. Am J Med. 1964; 37:514-525 [DOI] [PubMed] [Google Scholar]
- 53.Graham TP, Jr, Covell JW, Sonnenblick EH, Ross J, Jr, Braunwald E. Control of myocardial oxygen consumption: relative influence of contractile state and tension development. J Clin Invest. 1968; 47:375-385 [DOI] [PMC free article] [PubMed] [Google Scholar]
- 54.Buckberg G, Eber L, Herman M, Gorlin R. Ischemia in aortic stenosis: hemodynamic prediction. Am J Cardiol. 1975; 35:778-784 [DOI] [PubMed] [Google Scholar]
- 55.Barnard RJ, MacAlpin R, Kattus AA, Buckberg GD. Ischemic response to sudden strenuous exercise in healthy men. Circulation. 1973; 48:936-942 [DOI] [PubMed] [Google Scholar]
- 56.Borkon AM, Jones M, Bell JH, Pierce JE. Regional myocardial blood flow in left ventricular hypertrophy. An experimental investigation in Newfoundland dogs with congenital aortic stenosis. J Thorac Cardiovasc Surg. 1982; 84:876-885 [PubMed] [Google Scholar]
- 57.Meiler SE, Boudoulas H, Unverferth DV, Leier CV. Diastolic time in congestive heart failure. Am Heart J. 1987; 114:1192-1198 [DOI] [PubMed] [Google Scholar]
- 58.Chemla D, Nitenberg A, Teboul JL, Richard C, Monnet X, le Clesiau H, Valensi P, Brahimi M. Subendocardial viability index is related to the diastolic/systolic time ratio and left ventricular filling pressure, not to aortic pressure: an invasive study in resting humans. Clin Exp Pharmacol Physiol. 2009; 36:413-418 [DOI] [PubMed] [Google Scholar]
- 59.Karamanoglu M, O'Rourke MF, Avolio AP, Kelly RP. An analysis of the relationship between central aortic and peripheral upper limb pressure waves in man. Eur Heart J. 1993; 14:160-167 [DOI] [PubMed] [Google Scholar]
- 60.Reitan JA, Martucci RW, Levine NA. A computer evaluation of the ratio of the diastolic pressure‐time index to the time‐tension index from three arterial sites in dogs. J Clin Monit. 1986; 2:95-99 [DOI] [PubMed] [Google Scholar]
- 61.Wassertheurer S, Kropf J, Weber T, van der Giet M, Baulmann J, Ammer M, Hametner B, Mayer CC, Eber B, Magometschnigg D. A new oscillometric method for pulse wave analysis: comparison with a common tonometric method. J Hum Hypertens. 2010; 24:498-504 [DOI] [PMC free article] [PubMed] [Google Scholar]
- 62.Lowensohn HS, Khouri EM, Gregg DE, Pyle RL, Patterson RE. Phasic right coronary artery blood flow in conscious dogs with normal and elevated right ventricular pressures. Circ Res. 1976; 39:760-766 [DOI] [PubMed] [Google Scholar]
- 63.Bellamy RF, Lowensohn HS. Effect of systole on coronary pressure‐flow relations in the right ventricle of the dog. Am J Physiol Heart Circ Physiol. 1980; 238:H481-H486 [DOI] [PubMed] [Google Scholar]
- 64.Cross CE. Right ventricular pressure and coronary flow. Am J Physiol. 1962; 202:12-16 [DOI] [PubMed] [Google Scholar]
- 65.Fixler DE, Archie JP, Ullyot DJ, Buckberg GD, Hoffman JI. Effects of acute right ventricular systolic hypertension on regional myocardial blood flow in anesthetized dogs. Am Heart J. 1973; 85:491-500 [DOI] [PubMed] [Google Scholar]
- 66.Domenech RJ, Hoffman JIE, Noble MIM, Saunders KB, Henson JR, Subijanto S. Total and regional coronary blood flow measured by radioactive microspheres in conscious and anesthetized dogs. Circ Res. 1969; 22:581-596 [DOI] [PubMed] [Google Scholar]
- 67.Hess DS, Bache RJ. Transmural right ventricular blood flow during systole in the awake dog. Circ Res. 1979; 45:88-94 [DOI] [PubMed] [Google Scholar]
- 68.Weiss HR, Sinha AK. Regional oxygen saturation of small arteries and veins in the canine myocardium. Circ Res. 1978; 42:119-126 [DOI] [PubMed] [Google Scholar]
- 69.Fixler DE, Archie JP, Jr, Ullyot DJ, Hoffman JI. Regional coronary flow with increased right ventricular output in anesthetized dogs. Am Heart J. 1973; 86:788-797 [DOI] [PubMed] [Google Scholar]
- 70.Vlahakes GJ, Turley K, Hoffman JIE. The pathophysiology of failure in acute right ventricular hypertension: hemodynamic and biochemical correlations. Circulation. 1981; 63:87-95 [DOI] [PubMed] [Google Scholar]
- 71.Gold FL, Bache RJ. Transmural right ventricular blood flow during acute pulmonary artery hypertension in the awake dog: evidence for subendocardial ischemia during right ventricular failure despite residual vasodilator reserve. Circ Res. 1982; 51:196-204 [DOI] [PubMed] [Google Scholar]
- 72.Brooks H, Kirk ES, Vokonas PS, Urschel CW, Sonnenblick EH. Performance of the right ventricle under stress: relation to right coronary flow. J Clin Invest. 1971; 50:2176-2183 [DOI] [PMC free article] [PubMed] [Google Scholar]
- 73.Cooper N, Brazier J, Buckberg G. Effects of systemic‐pulmonary shunts on regional myocardial blood flow in experimental pulmonary stenosis. J Thorac Cardiovasc Surg. 1975; 70:166-176 [PubMed] [Google Scholar]