

Abstract
Background
The NADPH oxidase family (Nox) produces reactive oxygen species by adding the electron donated by NADPH to oxygen. Excessive reactive oxygen species production under a variety of pathological conditions has been attributed to increased Nox activity. Here, we aimed at investigating the role of Nox in cardiac ischemic injury through gain‐ and loss‐of‐function approaches.
Methods and Results
We modulated Nox activity in the heart by cardiac‐specific expression of Nox4 and dominant negative Nox4. Modulation of Nox activity drastically changes the cellular redox status. Increasing Nox activity by cardiac‐specific overexpression of Nox4 imposed oxidative stress on the myocardium [increased NAD(P)+/NAD(P)H and decreased glutathione/glutathione disulfide ratio] and worsened cardiac energetics and contractile function after ischemia‐reperfusion. Overexpression of the dominant negative Nox4 (DN), which abolished the Nox function, led to a markedly reduced state [decreased NAD(P)+/NAD(P)H and increased glutathione/glutathione disulfide ratio] at baseline and paradoxically promoted mitochondrial reactive oxygen species production during ischemia resulting in no recovery of heart function after reperfusion. Limiting the generation of reducing equivalent through modulating carbon substrates availability partially restored the NAD+/NADH ratio and protected dominant negative Nox4 hearts from ischemic injury.
Conclusions
This study reveals an important role of Nox in cardiac redox regulation and highlights the complexity of developing therapies that affect the intricately connected redox states.
Keywords: cardiac ischemic injury, NADPH oxidase, oxidative stress, reductive stress
Introduction
The roles of reactive oxygen species (ROS) as physiological signaling mechanisms as well as pathological stresses have been demonstrated repeatedly in the cardiovascular system.1–4 The NADPH oxidase family (Nox) is a major and dedicated cellular ROS generation system in cardiac myocytes and many other cell types, including neurons.5–6 Nox2 and Nox4 are the major catalytic subunits expressed in cardiac myocytes. The binding of p22phox to the catalytic subunit is required for the Nox enzyme activity. Unlike Nox2, Nox4 enzyme activity is readily regulated via transcription without agonist stimulation.7–8 Many studies have demonstrated the detrimental role of Nox2/4‐mediated ROS generation in a variety of cardiac stresses.9–12 However, recent studies also suggested that Nox could play important protective roles in the cardiac response to chronic stresses.13 The physiological role of Nox―specifically, the function of the Nox in the regulation of cellular redox state―has not been investigated.
Cellular and mitochondrial redox homeostasis is intricately connected and regulated by several redox‐sensitive couples, such as glutathione (GSH)/glutathione disulfide (GSSG), NADP+/NADPH, and NAD+/NADH, as well as by ROS.14 NADH is generated by glycolysis in the cytosol or via the tricarboxylic acid cycle in the mitochondria. The mitochondrial and cytosolic NAD+/NADH pools are linked by malate/aspartate shuttle. Being the major substrate for oxidative phosphorylation, the majority of NADH produced in cardiac myocytes enters the electron transport chain to drive the generation of ATP. NADPH can be produced in both cytosol and mitochondria.15 The NADH pool in mitochondria communicates with the NADPH pool through multiple mitochondrial enzymes such as the isocitrate dehydrogenase reaction coupled to the nicotinamide nucleotide transhydrogenase reaction.15–17 NADPH plays an important role in redox regulation as it is used by glutathione reductase and thioredoxin reductase to convert GSSG to GSH and to catalyze the reduction of thioredoxin, respectively. On the other hand, both NADH and NADPH can be electron donors for ROS generation via mitochondrial respiratory chain and Nox.5 Because the reactions involved with the redox pairs are interconnected, disturbances of the redox couples in a specific subcellular compartment will ultimately affect the whole cell redox homeostasis and ROS generation/scavenging.
Here, we investigated the mouse heart overexpressing wild‐type (WT) Nox4 (TG) or dominant‐negative mutant (Pro437His) of Nox4 (DN) and determined the role of NADPH oxidase in cardiac ischemia/reperfusion (I/R) injury. We found that the increased NADPH oxidase activity in TG is associated with a highly oxidative state, while eliminating its activity in DN resulted in excessively reduced state. Interestingly, both oxidative and reductive stresses exacerbated I/R injury in the heart. The TG hearts generated more ROS during reperfusion and showed poor recovery in cardiac function and energetics. Unexpectedly, the DN hearts exhibited severe mitochondrial damage via paradoxical ROS generation during ischemia and no recovery of contractile function on reperfusion. These observations raise caution against targeting NADPH oxidases as antioxidant therapies.
Materials and Methods
Animal Models
We used 3‐month‐old mice with cardiac‐specific overexpression of TG or DN, which has a Phe437His mutation within the NADPH binding site as described previously.11 Age‐ and sex‐matched WT littermates on the FVB background were used as controls. All procedures were approved by the Institutional Animal Care and Use Committee of the University of Washington.
Isolated Perfused Heart Experiment and 31P Nuclear Magnetic Resonance Spectroscopy
Mice were heparinized (100 U intraperitoneally) and anesthetized with sodium pentobarbital (150 mg/kg intraperitoneally). The hearts were excised and perfused in a Langendorff mode at 37°C with oxygenated perfusate (pH 7.4) as previously described.18 Hearts were perfused with phosphate‐free Krebs–Henseleit buffer containing (in mmol/L): NaCl 118, NaHCO3 25, KCl 5.3, CaCl2 2, MgSO4 1.2, and EDTA 0.5 and 1 of the following 2 different combinations of substrates: “mixed‐substrate buffer” (containing glucose 5.5 mmol/L, mixed long‐chain fatty acids 0.4 mmol/L, bound to 1% albumin); dl‐β‐hydroxybutyrate 0.38 mmol/L, lactate 1.0 mmol/L, and insulin 50 μU/mL; or “glucose+pyruvate buffer” (containing glucose 10 mmol/L and pyruvate 0.5 mmol/L). A water‐filled balloon was inserted into the left ventricle (LV) to record ventricular pressure and heart rate. Isovolumic contractile function was estimated by the product of LV developed pressure and heart rate (rate‐pressure product). All hearts were stabilized for 20 minutes at a constant perfusion pressure of 80 mm Hg and then subjected to low‐flow global ischemia (3% of baseline) for 25 minutes and reperfused for 60 minutes.
All hearts were placed in a 10‐mm nuclear magnetic resonance (NMR) sample tube and inserted into a 1H/31P double‐tuned probe situated in an 89‐mm‐bore, 14‐T superconducting magnet (Bruker Avance III).19 Dynamic changes in cardiac high‐energy phosphate content and intracellular pH were monitored by 31P NMR spectroscopy, simultaneously with the continuous LV functional recording. Spectra were collected at 60° flip angle, 22.8‐μs pulse, and 2.14‐second delay and analyzed with an ACD/1D NMR Processor (Advanced Chemistry Development, Inc). Two consecutive 5‐minute baseline 31P NMR spectra (120 scans) were collected after stabilization, followed by 10 consecutive 2 minute–30 second spectra (60 scans) during ischemia and twelve 5‐minute spectra (120 scans) during reperfusion. The 31P NMR resonance areas corresponding to ATP, phosphocreatine (PCr), and inorganic phosphate (Pi) were fit to Lorentzian function and, by comparing the peak areas of fully relaxed (recycle time of 20.4 seconds) and those of partially saturated spectra (recycle time of 2.54 seconds), the correction factors for saturation were calculated for ATP (1.0), PCr (1.33), and Pi (1.3). The mean value of ATP concentration of WT hearts previously measured with HPLC was used to calibrate the ATP peak area of the baseline 31P NMR spectrum for the respective groups.20 Concentrations of other metabolites were calculated using the ratio of their peak area to the average of β‐ and γ‐ATP peak areas, and intracellular pH (pHi) was determined by the chemical shift of Pi relative to PCr. At the end of the experiments, hearts were either processed for infarct size measurement or freeze‐clamped and stored in −80°C for further analysis.
Myocardial Infarct Size Measurement
Reperfused hearts were first frozen at −20°C and then cut manually into 6 transverse slices of approximately equal thickness (≈0.8 mm). Tissue sections were weighed and incubated in 1% triphenyl tetrazolium chloride (TTC) for 15 minutes at 37°C and then fixed in 10% formaldehyde for 12 hours at room temperature, followed by digital photography. The areas of the infarct and ventricle in each slice were measured with computer planimetry. The weight of the infarct tissue in each section is calculated as (infarct area/LV area) ×LV weight, as described previously.21 The infarct size was expressed as (total infarct weight/total LV weight)×100%.
ROS and Mitochondrial Membrane Potential Measurements of Perfused Hearts
ROS production and mitochondrial membrane potential of the perfused heart were measured during baseline perfusion and early reperfusion, respectively, by adapting a method of fluorescent labeling and confocal microscopy as previously described.22 2′,7′‐Dichlorofluorescein diacetate (DCFH‐DA, 50 μmol/L), tetramethylrhodamine ethyl ester (TMRE, 5 μmol/L), and DAPI (1 μg/mL) (Molecular Probes) were added to the perfusate as indicators of cellular hydrogen peroxide, mitochondrial membrane potential, and nuclei, respectively. This combination of fluorescent dyes was infused for 5 minutes through a single syringe pump at a controlled speed, started after 20 minutes of baseline stabilization. The heart was immediately removed, placed into ice‐cold perfusion buffer, and cut into ≈1.0‐mm transverse slices. Confocal imaging used a Zeiss LSM 510 confocal microscope equipped with a 63×, 1.3‐NA oil immersion objective. Triwavelength excitation imaging of DCFH‐DA, TMRE, and DAPI was achieved by tandem excitation at 488, 543, and 405 nm, and the emissions were collected at 505 to 530, 550 to 583, and 420 to 480 nm, respectively. To ensure the signals between the groups are comparable, we first used the “z‐scan” function of the confocal microscope to identify the optimal focal plane, and we used the same focal plane for all channels. We also adjusted the “color palette” settings to avoid signal saturation at any point. Further, in a parallel experiment, we determined the maximal fluorescence increase of DCF by H2O2 (200 μmol/L), which dramatically increased the DCF/DAPI ratio to 6 (data not shown), well above the signal we had obtained in our experimental groups (e.g., 1 to 2). Thus, the DCF signal detected in the tissue slice is not saturated under these conditions and can reflect the relative changes in cytosolic oxidation. All the image acquisition settings were kept constant among each group and under each condition.
Mitosox red (2.5 μmol/L), Mitotracker green (0.5 μmol/L), and Vybrant Ruby (2.5 μmol/L) (Molecular Probes) were combined in a separate cohort as indicators of mitochondrial superoxide, mitochondrial mass, and nuclei, respectively. Fluorescent indicators were infused at the onset of reperfusion and continued for 5 minutes. Then hearts were removed and placed into ice‐cold perfusate, and ventricles were cut into ≈1.0‐mm transverse slices for immediate confocal imaging. Confocal imaging was performed using a Zeiss LSM 510 confocal microscope equipped with a 63×, 1.3‐NA oil immersion objective. Dual excitation imaging of Mitosox Red was achieved by alternating excitation at 405 and 514 nm and collecting emissions between 560 and 615 nm, and the signal ratio of Mitosox Red at 405‐nm and 514‐nm excitation was used to indicate specific mitochondrial O2− production. Similarly, simultaneous imaging of Mitosox Red (ex: 405, 514 nm; em: 560 to 615 nm), Mitotracker Green (ex: 488 nm; em: 505 to 530 nm), and Vybrant Ruby (ex: 633 nm; em: 657 to 700 nm) was performed by tandem excitation.
Lactate Output Measurement
Coronary effluents were collected before and during I/R, and the flow rate, volume of coronary effluents, and heart weight were recorded so as to calculate the rate of total lactate output from the hearts. Total lactate content in the coronary effluent was measured with a Sigma assay kit. Total lactate output was measured from the start of ischemia to the first 5 minutes of reperfusion; it was calculated through subtraction of the lactate content in the perfusate and normalized to coronary flow rate and heart weight.
NAD+/NADH and NADP+/NADPH Measurements
Myocardial levels of NAD+ and NADH were measured using tissue homogenates with the EnzyChrom NAD+/NADH Assay Kit, according to the manufacturer's protocol (Bioassay Systems). NADP+ and NADPH levels were measured with EnzyChrom NADP+/NADPH Assay Kit (Bioassay Systems). The NAD+, NADH, NADP+, and NADPH concentrations in the sample were determined by colorimetric measurement at 565 nm and the NAD+ and NADP+ standard curves.
Glutathione Levels
Total (GS), reduced (GSH), and oxidized (GSSG) glutathione concentrations were measured by using the Calbiochem Glutathione Assay Kit II, based on a 5,5′‐dithiobis‐2‐nitrobenzoic acid (DTNB)–glutathione reductase recycling system. Kinetic measurement of the absorbance of a yellow DTNB‐reduced product at 405 nm measured the total GS in the sample. Detection of GSSG was performed on duplicate samples with an extra reaction with 2‐vinylpyridine.
Measurements of Enzyme Activities and Metabolites
Aconitase activities were measured spectrometrically with the use of an assay kit from Cayman. Malate/aspartate shuttle was reconstituted by adding cytosolic components of heart homogenates in saturating concentrations to intact cardiac mitochondria, and the shuttle capacity was calculated by measuring the rate of oxidation of NADH monitored at 340 nm at 37°C as previously described.23–24 The rate of the change in absorbance with and without added substrates for the shuttle was normalized to the amount of added mitochondrial protein. The lactate content in the coronary effluent was measured with the use of a Sigma assay kit. Lactate output was calculated by subtracting the lactate content in the perfusion buffer and normalized to coronary flow rate and heart weight. The total lactate production during ischemia was estimated by summing the lactate output during ischemia and at the onset of reperfusion as previously described.20
Mitochondria Isolation and Respiration Assay
Mitochondria from WT, DN, and TG hearts were isolated as described by Boehm et al.25 Briefly, freshly isolated hearts were rinsed with sucrose‐containing mitochondrial isolation buffer. Heart tissue was chopped into pieces, trypsinized, and homogenized with a homogenizer. Mitochondria were purified through centrifugations. Mitochondria respiration assay was performed using Oxytherm (Hansatech) with pyruvate, malate, and succinate as substrates.
ROS Measurements in Cultured Cardiomyocytes
Adult cardiac myocytes were isolated from WT, TG, or DN mouse heart (3 to 6 months old) following the standard enzymatic protocol as reported previously.26 Freshly isolated myocytes were plated at a density of 0.5 to 1×10⁴/cm2 on coverslips precoated with 20 μg/mL laminin (Invitrogen) for 2 hours. Adenoviruses containing mitochondria‐targeted Hyper (mt‐Hyper) or nontargeted Hyper (cyto‐Hyper) were added on the attached myocytes at a multiplicity of infection of 100. The Hyper is a newly developed and genetically encoded fluorescent indicator for intracellular hydrogen peroxide.27 Myocytes were cultured in M199 medium (Sigma) containing 10 μmol/L blebbistatin for up to 72 hours. Hyper fluorescence with adequate intracellular localization can be observed 48 hours after gene transfer.
For confocal imaging, we used a Zeiss LSM 510 Meta confocal microscope equipped with a 40×, 1.3‐NA oil immersion objective. For Hyper imaging, we used dual excitation by alternating excitation at 405 and 488 nm and collecting emissions at >505 nm. The ratio of emission fluorescence at 488‐nm and 405‐nm excitation was used to indicate the intracellular or intramitochondrial hydrogen peroxide level. Real‐time monitoring of Hyper fluorescence during I/R was achieved through serial 2‐D imaging at a sampling rate of 30 s/frame. Cellular ischemia was achieved by perfusing the cells with oxygen‐deprived solution28 containing (in mmol/L) NaCl 137, KCl 4.9, CaCl2 1, MgSO4 1.2, NaH2PO4 1.2, HEPES 20, and NaS2O4 2, pH 7.4. Reperfusion was achieved with perfusion with the same solution without NaS2O4 and with 15 mmol/L glucose. Solution oxygen level was monitored with an oxygen probe (microelectrode). For measurements of mitochondrial membrane potential, cells were loaded with TMRM (20 nmol/L) and images were taken with a Zeiss LSM 510 confocal microscope.
To monitor mitochondrial NADH level, we used an Olympus FV1000 2‐photon microscope with a ×25 water immersion objective. Serial 2‐dimensional scanning images were taken with 710‐nm excitation and at a sampling rate of 30 s/frame during cellular I/R treatment.
Western Blot Analysis
Heart tissues were lysed with RIPA buffer with a protease inhibitor cocktail. Protein samples were denatured with Lammeli buffer with the use of β‐mercaptoethanol, separated via SDS‐PAGE, and transferred to PVDF membranes according to standard procedures. The blots were probed with specified antibodies according to the manufacturer's instructions. Anti‐GADPH and anti–hypoxia inducible factor 1α (HIF1α) antibodies were obtained from Cell Signaling, and anti‐PPARa antibodies were from Cayman.
RNA Isolation and Real‐Time PCR
Total RNA was isolated from frozen LV tissue using the RNeasy Kit (Qiagen), and cDNA was synthesized using Omniscript reverse synthase and random hexamers according to manufacturers' guidelines. Real‐time PCR was performed using SYBR green (Bio‐Rad). mRNA levels of peroxisome proliferator‐activated receptor ‐α (Pparα), medium‐chain acyl‐coenzyme A dehydrogenase (Mcad), pyruvate dehydrogenase kinase isoform 4 (Pdk4), and glucose transporter‐1 (Glut1) were detected using primers described in the Table. The real‐time PCR results for the mRNA levels of each gene were normalized to 18S rRNA levels.
Table 1.
The Primer Sequences for Real‐Time PCR
| Gene | Forward (5′ to 3′) | Reverse (5′ to 3′) |
|---|---|---|
| PPARα | GCGTACGGCAATGGCTTTATCACA | GCAGCCACAAACAGGGAAATGTCA |
| MCAD | TGGCGATGAAGGTTGAACTCGCTA | GCTGATTGGCAATGTCTCCAGCAA |
| PDK4 | TTGCTGCTTCGTGAATGTGTGTGG | ATCCAACCAAGCTCTGTCCCTCAT |
| GLUT1 | CATCGTGGCCATCTTTGGCTTTGT | GGAAGCACATGCCCACAATGAAGT |
GLUT1 indicates glucose transporter‐1; MCAD, medium‐chain acyl‐coenzyme A dehydrogenase; PCR, polymerase chain reaction; PDK4, pyruvate dehydrogenase kinase isoform 4; PPARα, peroxisome proliferator‐activated receptor‐α.
Statistical Analyses
All data are presented as mean±SEM. One‐way ANOVA with Newman–Keuls post‐test is used. Two‐way repeated‐measures ANOVA was used to compare the responses to I/R. Nonparametric analysis was performed for data not shown to be normally distributed. Comparisons among the groups at all time points during the ischemia or reperfusion period were made by using Friedman's 2‐way ANOVA. Analyses were performed with GraphPad Prism (GraphPad Software), and a value of P<0.05 was considered statistically significant.
Results
Gain‐ or Loss‐of‐Function of Nox Altered Redox States in the Heart With No Significant Changes in Myocardial Contractile Function and Energetics
We compared oxidative stress and redox state in WT and TG or DN mouse hearts at 3 months of age. We first examined the cellular ROS levels and mitochondrial membrane potential (ΔΨ) in isolated hearts under normal perfusion conditions by using fluorescent indicators (DCFH‐DA and TMRE) and confocal imaging. No significant difference in cellular ROS level or ΔΨ was observed in either TG or DN hearts under baseline conditions (Figure 1A through 1C). It is known that the DCFH fluorescent method is not specific and is inadequate for quantitation.29 Therefore, we also examined the basal mitochondrial or cytosolic H2O2 levels with another indicator, Hyper, in cultured adult cardiac myocytes isolated from the 3 groups of mice. We found no difference in H2O2 levels among the 3 genotypes in either cellular compartment (Figure 1D through 1F). Interestingly, the aconitase activity was decreased by ≈30% in TG hearts (Figure 1G), suggesting that mild oxidative damage might have accumulated in TG hearts despite the undetectable changes of the basal ROS levels.
Figure 1.

Overexpression of Nox4 (TG) promoted oxidative stress, while overexpression of dominant‐negative Nox4 (DN) increased reductive stress in mixed‐substrate perfused hearts at baseline, without significant changes in cellular ROS levels. (A and B) Cellular ROS levels and mitochondrial membrane potential were quantified by the fluorescent intensities of DCFH‐DA and TMRE normalized against DAPI. (C) Representative confocal micrographs of WT, TG, and DN heart sections stained with DAPI, DCFH‐DA, and TMRE. (D) Confocal images of cultured adult cardiac myocytes from WT, TG, and DN mice loaded with mitochondrial membrane potential indicator (TMRM) or expressing the hydrogen peroxide indicator in mitochondria (mt‐Hyper) or cytosol (cyto‐Hyper). Baseline fluorescence (488/405 ratio) of (E and F) mt‐Hyper or cyto‐Hyper in cultured adult cardiac myocytes from WT, TG, or DN mouse (n=5 to 11 cells from 3 hearts). (G) Aconitase activities, (H) GSH/GSSG ratio, (I) NAD+/NADH, and (J) NADP+/NADPH ratio were measured in tissue homogenates. (K) NAD+ and (L) NADP+ pools in the WT, TG, double knockout (DKO), and DN hearts under baseline perfusion were measured. (M) Malate/aspartate shuttle was reconstituted by adding cytosolic components of heart homogenates in saturating concentrations to intact cardiac mitochondria, and the shuttle capacity was estimated by measuring the rate of oxidation of NADH monitored at 340 nm at 37°C (n=3 to 7 hearts/group for A through C and G through L). *P<0.05, vs WT. DAPI indicates 4′,6‐diamidino‐2‐phenylindole; DCFH‐DA, 2′7′‐dichlorofluorescein diacetate; DKO, double knockout; DN, dominant negative; GSH, glutathione; GSSG, glutathione disulfide; ROS, reactive oxygen species; TG, transgenic; TMRE, tetramethylrhodamine ethyl ester; TMRM, tetramethylrhodamine methyl ester; WT, wild‐type.
We then determined the intracellular redox pairs in the TG and DN hearts. In DN hearts, a marked decline in NAD(P)+/NAD(P)H and an increase in GSH/GSSG were observed, indicating a significantly reduced state (Figure 1H through 1J). Noticeably, similar changes were observed in the hearts with Nox2/4 double deletion (DKO, Figure 1I and 1J), suggesting DN inhibits both Nox2 and Nox4. This is consistent with the observation that the dominant‐negative Nox4 mutant competes with the endogenous Nox for the interaction with p22phox and that overexpression of DN inhibits activities of both Nox2 and Nox4 by sequestering the p22phox.30 On the other hand, TG hearts exhibited a remarkable increase in NAD(P)+/NAD(P)H and a decrease in GSH/GSSG, indicating significant oxidative stress (Figure 1H through 1J). In addition, the total NAD(P)+/NAD(P)H pool was increased in the TG hearts (Figure 1K and 1L), likely due to a chronic adaptive response in attempt to restore the NAD(P)+/NAD(P)H ratio. Furthermore, the malate/aspartate shuttle capacity increased by nearly 2‐fold in TG and DN hearts, suggesting an increased exchange of cytosolic and mitochondrial NADH pools (Figure 1M).
To elucidate the functional consequences, we evaluated cardiac contractile function and myocardial energetics in isolated perfused heart using 31P NMR spectroscopy as previously described.31 All hearts were supplied with a mixture of substrates containing fatty acids, glucose, lactate, and a physiological level of insulin (50 μU/mL) to mimic in vivo conditions. Both TG and DN hearts showed comparable heart weights (Figure 2A) and normal contractile function at 3 months of age (Figure 2B). Moreover, myocardial ATP content in DN and TG hearts was not different from that of the WT hearts (Figure 2C). Interestingly, TG hearts displayed a small but significant reduction in PCr content reflected as a lower PCr/ATP ratio (Figure 2D), suggesting a moderate decrease of energy reserve. This is consistent with the lower NADH level and a trend of lower mitochondrial respiration rate in this group of hearts (Figures 1I and 2E).
Figure 2.
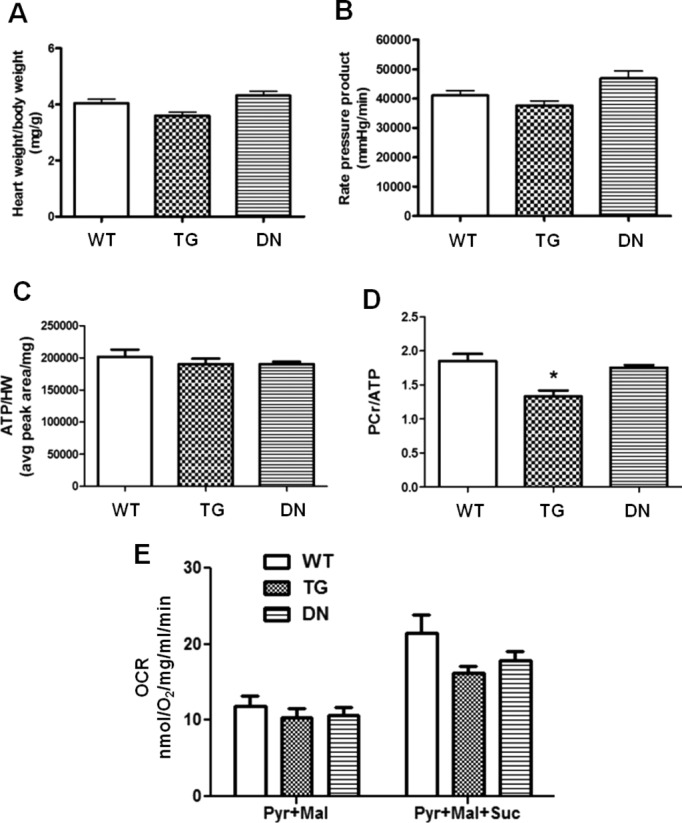
Cardiac function and energetics in WT, TG, and DN hearts. (A) Heart weight–to–body weight ratio and (B) rate‐pressure product (RPP) of hearts perfused with mixed substrates were measured as described in Materials and Methods. (C) Ratio of baseline ATP content to heart weight and (D) ratio of baseline PCr to ATP content in hearts perfused with mixed substrates were measured by 31P NMR spectroscopy. (E) Mitochondrial respiration of WT, TG, and DN hearts were measured using pyruvate and malate (Pyr+Mal) as substrates or pyruvate, malate, and succinate (Pyr+Mal+Suc) as substrates (n=3 to 10 per group). *P<0.05 vs WT. DN indicates dominant negative; HW, heart weight; NMR, nuclear magnetic resonance; OCR, oxygen consumption rate; PCr, phosphocreatine; TG, transgenic; WT, wild‐type.
I/R Injury Was Exacerbated in Both TG and DN Hearts
We next examined the functional outcome of TG and DN hearts in response to I/R by subjecting the isolated perfused hearts to low‐flow ischemia for 25 minutes (3% of normal coronary flow) followed by 1‐hour reperfusion. The contractile function of both transgenic hearts was identical to that of the WT hearts at baseline. However, TG hearts showed significantly impaired postischemic contractile performance, as evidenced by increases in LV end‐diastolic pressure, decreases in LV developed pressure, and heart rate after reperfusion (Figure 3A through 3C). The overall functional recovery, estimated by rate‐pressure product, was 17% of the baseline in TG compared with 69% in WT hearts (Figure 3D). Unexpectedly and contrary to our prediction of increased resistance to I/R injury, the DN hearts displayed the poorest recovery among the 3 groups (Figure 3A through 3D). All DN hearts failed to resume beating during the entire period of reperfusion (Figure 3C). Consistent with the functional response, TTC staining at the end of reperfusion revealed infarct size/LV area in the order of DN>TG>WT hearts (Figure 3E and 3F).
Figure 3.
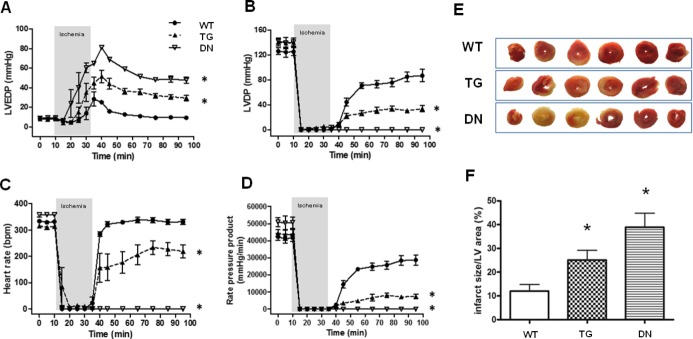
TG and DN hearts showed impaired functional recovery and larger infarcts after I/R. (A) Left ventricular end‐diastolic pressure (LVEDP), (B) left ventricular developed pressure (LVDP), (C) heart rate, and (D) rate‐pressure product (RPP) were continuously measured in hearts perfused in Langendorff mode during I/R. *P<0.05 vs WT during the reperfusion period. (E) Representative photographs of heart sections in TTC staining after I/R with either mixed‐substrate or glucose+pyruvate buffer. (F) Quantification of myocardial infarction in reperfused hearts. *P<0.05 vs WT (n=5 to 6/group). DN indicates dominant negative; LV, left ventricle; TG, transgenic; TTC, triphenyl tetrazolium chloride; WT, wild‐type.
Poor Recovery of the DN Hearts After Ischemia Was Associated With Severe Impairment of Myocardial Energetics
To determine whether changes in cardiac bioenergetics contribute to the differential functional responses during I/R, we measured the content of high‐energy phosphates and pHi by 31P NMR spectroscopy simultaneously with the recording of contractile function in all 3 groups of hearts. Adequate perfusion before ischemia was evidenced by normal levels of PCr, ATP, Pi, and pHi in all 3 groups of hearts (Figure 4). During ischemia, PCr was depleted and ATP declined in all groups, whereas Pi increased substantially (Figure 4A, 4B, and 4D). The TG hearts displayed a similar decline in energetic profile as that of the WT hearts during ischemia, but the recovery of PCr during reperfusion was significantly impaired (Figure 4A through 4C). In contrast, the DN hearts showed a rapid and substantial decline of ATP and a greater accumulation of Pi during ischemia compared with WT and TG hearts (Figure 4B and 4D). During reperfusion, the recovery of PCr, ATP, and pHi in the DN hearts were also attenuated and failed to reach the level of WT or TG hearts (Figure 4A through 4C). The data collectively suggested that DN hearts developed an earlier and greater impairment of myocardial energetics during the ischemia period. These findings corroborated with the failure to resume beating on reperfusion and the greater infarct size in the DN hearts (Figure 3) and suggested that the DN hearts suffered substantial injury during ischemia.
Figure 4.
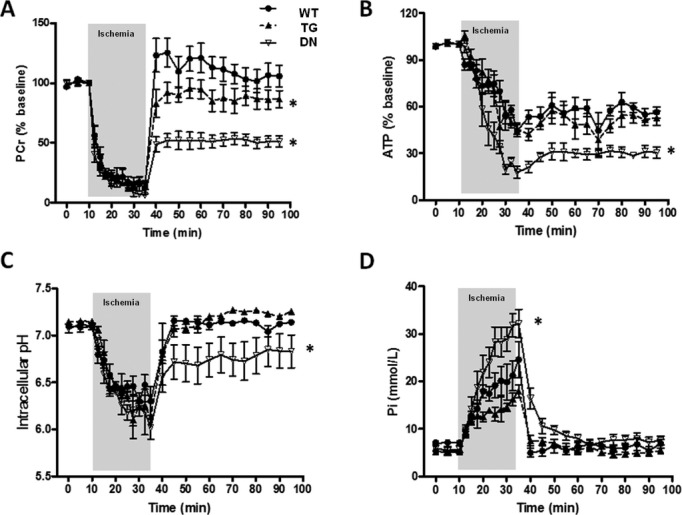
DN hearts displayed most severe energetic defects during I/R. Dynamic changes of PCr (A), ATP (B), intracellular pH (C), and inorganic phosphate (Pi) content (D) in isolated hearts perfused with mixed substrate buffer and subjected to 25 minutes of low‐flow ischemia (3% of baseline) followed by 1‐hour reperfusion as monitored by 31P NMR spectroscopy (n=5 to 6/group). *P<0.05 vs WT during the reperfusion period (A through C) and vs WT during the ischemic period (D). DN indicates dominant negative; NMR, nuclear magnetic resonance; PCr, phosphocreatine; TG, transgenic; WT, wild‐type.
Mitochondrial Dysfunction and ROS Production in TG and DN During I/R
It is well recognized that increased ROS production during I/R may lead to mitochondrial dysfunction and energetic defects.32 To determine whether oxidative stress underlies excessive I/R injury in TG and DN hearts, we monitored ROS levels in perfused hearts and isolated cardiac myocytes subjected to simulated I/R. Isolated perfused hearts were loaded with ROS indicators (Mitosox Red and DCFH‐DA) at the onset of reperfusion, and ROS levels were assessed by using confocal imaging. DN hearts, which presented a more reduced redox state at baseline [low NAD(P)+/NAD(P)H ratio], paradoxically generated the highest levels of mitochondrial O2− and cellular ROS (Figure 5A through 5D), which was accompanied by a marked decrease in mitochondrial membrane potential on reperfusion (Figure 5B and 5E). On the contrary, the TG hearts showed increased cellular ROS but not mitochondrial O2− production, and the mitochondrial membrane potential was only modestly decreased on reperfusion (Figure 5A through 5D).
Figure 5.

DN hearts showed a greater ROS formation during I/R. (A) Representative confocal micrographs of WT, TG, and DN heart sections stained with Vybrant ruby/Mitotracker green and Mitosox red during early reperfusion with mixed substrate buffer. (B) Representative confocal micrographs of WT, TG, and DN heart sections stained with DAPI, DCF‐DA, and TMRE during early reperfusion with mixed substrate buffer. (C) Mitochondrial O2− production was quantified as fluorescent signal ratio of Mitosox red at 405‐nm and 514‐nm excitation. (D) Cellular ROS production and (E) mitochondrial membrane potential were quantified as fluorescent intensities of DCFH‐DA and TMRE normalized to DAPI signal, respectively (n=3 to 5/group). *P<0.05 vs WT. (F through H) Representative traces showing the real‐time changes of single‐cell NADH autofluorescence, mt‐Hyper, or cyto‐Hyper signals during I/R treatment in DN (F), TG (G), and WT (H) myocytes. For each trace, data are normalized to its own baseline (F/F0). Similar results were obtained from 2 experiments. DCFH‐DA indicates 2′,7′‐dichlorofluorescein diacetate; DN, dominant negative; ROS, reactive oxygen species; TG, transgenic; TMRE, tetramethylrhodamine ethyl ester; WT, wild‐type.
To further determine the mechanism of ROS production in TG and DN groups during ischemia, we monitored the dynamic changes of mitochondrial and cytosolic H2O2 levels as well as NADH autofluorescence in cultured adult cardiac myocytes isolated from the 3 groups during I/R treatment (Figure 5F through 5H). As expected, the lack of oxygen supply and decreased oxidative phosphorylation during ischemia led to persistent elevation of NADH autofluorescence in cardiac myocytes from WT accompanied by decreased mitochondrial and cytosolic H2O2 (Figure 5H). Cardiac myocytes from TG mice also accumulated NADH during ischemia and produced more H2O2 in the cytosol but not mitochondria (Figure 5G). This is consistent with the data from perfused heart, suggesting that TG myocytes experienced increased oxidative stress primarily in the cytosol during ischemia.
Interestingly, cardiac myocytes from DN mice presented robust increases in both mitochondrial and cytosolic H2O2 levels while demonstrating a small decline of the NADH level during ischemia (Figure 5F). Since the preischemic NADH level was twice as high in the DN compared with WT and TG groups (Figure 1K), the DN myocytes remained in a highly reduced state despite the small decline of NADH level. The decline rather than further accumulation of NADH in DN myocytes is highly suggestive of NADH consumption for excessive ROS production in the mitochondria during ischemia.
Collectively, the TG hearts demonstrated increased oxidative burden throughout the protocol and a greater cardiac dysfunction after I/R compared with the WT hearts. The DN hearts presented the most reduced state under normal perfusion but robust mitochondrial ROS production during ischemia. Thus, both oxidative and reductive stresses could sensitize the hearts to I/R injury through increased ROS production.
Increasing the NAD+/NADH Ratio Rescued Cardiac Dysfunction in the DN Hearts Subjected to I/R
To test if the elevated NADH level observed in DN hearts underlies the greater ROS generation and cardiac dysfunction when subjected to ischemic injury, we sought to lower the NADH production through substrate metabolism. We removed fatty acids, lactate, ketone, and insulin from the perfusate and supplied the hearts with glucose (10 mmol/L) supplemented with a low concentration of pyruvate (0.5 mmol/L). Mouse hearts perfused with 10 mmol/L glucose in the absence of insulin were energetically unstable. The addition of 0.5 mmol/L pyruvate is essential to meet the minimum requirement of substrate supply. Indeed, DN hearts perfused with glucose/pyruvate buffer had a lower NADH level and a higher NAD+/NADH ratio compared with hearts perfused with mixed substrate buffer at baseline and end‐ischemia (Figure 6A through 6C). Similar changes in GSH/GSSG were observed (Figure 6D and 6E). We next assessed ROS production at early reperfusion by using Mitosox Red and DCFH‐DA. Mitochondrial O2− production was not affected in WT or TG hearts by switching the substrates but was significantly lowered in DN hearts perfused with glucose/pyruvate (Figure 6F). The cellular ROS production was significantly reduced in both TG and DN hearts with glucose/pyruvate perfusate (Figure 6G).
Figure 6.

Glucose+pyruvate buffer perfusion elevated NAD+/NADH ratio and decreased ROS production in TG and DN hearts, compared with mixed substrate buffer. NAD+/NADH ratio of (A) DN, (B) TG, and (C) WT hearts perfused with the 2 types of buffers were measured at BL, end of ischemia, and end of reperfusion. #P<0.05 glucose+pyruvate vs mixed‐substrate perfused hearts. GSH and GSSG levels were measured in the 3 groups of hearts perfused with (D) mixed substrate or (E) glucose+pyruvate buffer, which were harvested at baseline, end‐ischemia, and end‐reperfusion. *P<0.05 vs WT under the same condition. (F) Mitochondrial O2− and (G) cellular ROS production of hearts perfused with the mixed‐substrate or glucose+pyruvate buffers after I/R were measured as described in Methods. *P<0.05 vs WT perfused with mixed substrates; #P<0.05 glucose+pyruvate vs mixed‐substrate perfused hearts of the same genotype. For all experiments, n=5 to 6/group. BL indicates baseline; DCFH‐DA, 2′,7′‐dichlorofluorescein diacetate; DN, dominant negative; GSH, glutathione; GSSG, glutathione disulfide; ROS, reactive oxygen species; TG, transgenic; WT, wild‐type.
Although switching the substrates did not affect myocardial energetics or contractile function in any of the 3 groups at baseline (data not shown), functional recovery after I/R was dramatically improved in TG and DN hearts (Figure 7A). Consistently, the infarct sizes of TG and DN hearts perfused with glucose/pyruvate buffer were also significantly reduced (Figure 7B) compared with those perfused with mixed substrates. The lactate production of perfused hearts was similar for the 2 substrates (Figure 7C), suggesting that the beneficial effect of glucose/pyruvate perfusion is unlikely due to altered glycolysis or uncoupling of glycolysis to oxidation. 31P NMR analysis showed that glucose/pyruvate perfusate markedly improved the recovery of high‐energy phosphate content and pHi in DN hearts (Figure 7D through 7F). The PCr level in these hearts at the end of the reperfusion period reached the preischemic levels, albeit still lower than that of WT hearts (Figure 7D). The accelerated depletion of ATP during ischemia in DN hearts perfused with mixed substrates was eliminated (Figures 4B and 7E). Collectively, the data showed that lowering NADH production at baseline by limiting carbon substrate supply reduced mitochondrial ROS production and rescued cardiac dysfunction during I/R in TG and DN hearts.
Figure 7.

Glucose+pyruvate perfusion rescued cardiac dysfunction in TG and DN hearts after I/R. (A) Functional recovery of hearts (RPP %) perfused with mixed substrate or glucose+pyruvate buffers after I/R. (B) Infarct sizes of hearts perfused with the 2 buffers after I/R were measured as described in Materials and Methods. (C) Total lactate outputs during ischemia in hearts perfused with either substrate buffer. *P<0.05 vs mixed‐substrate perfused WT hearts. #P<0.05 vs corresponding mixed‐substrate perfused hearts. Dynamic changes in (D) PCr, (E) ATP, and (F) intracellular pH were monitored by 31P NMR spectroscopy during the I/R with glucose+pyruvate buffers. *P<0.05 vs WT during the reperfusion period (n=6 to 8/group). DN indicates dominant negative; LV, left ventricle; NMR, nuclear magnetic resonance; PCr, phosphocreatine; RPP, rate‐pressure product; TG, transgenic; TMRE, tetramethylrhodamine ethyl ester; WT, wild‐type.
It has been suggested that cellular ROS level regulates the accumulation of HIF1α, which in turn promotes glucose metabolism and enhances the resistance to ischemic/hypoxia damages. We therefore examined whether the loss of NADPH oxidase activity in DN hearts affected HIF1α level. Under baseline conditions, HIF1α is undetectable in the nuclear fraction of the cardiac tissue of any genotypes (Figure 8A). We also observed no difference in the expression of PPARα, an HIF1α‐responsive gene, or its downstream targets at baseline in the 3 groups of hearts (Figure 8B and 8C). At the end of ischemia, accumulation of HIF1α in the nucleus was observed in all genotypes but at a reduced level in DN (Figure 8A). However, the lower HIF1α was not associated with impaired glycolysis as the lactate production during ischemia was not decreased in DN hearts, suggesting that it might be too soon for the HIF1α accumulated during ischemia to affect glucose metabolism via transcriptional mechanisms in our experimental setting. It is possible that HIF1α‐mediated changes become effective during a longer reperfusion period in vivo as we have recently shown.30
Figure 8.
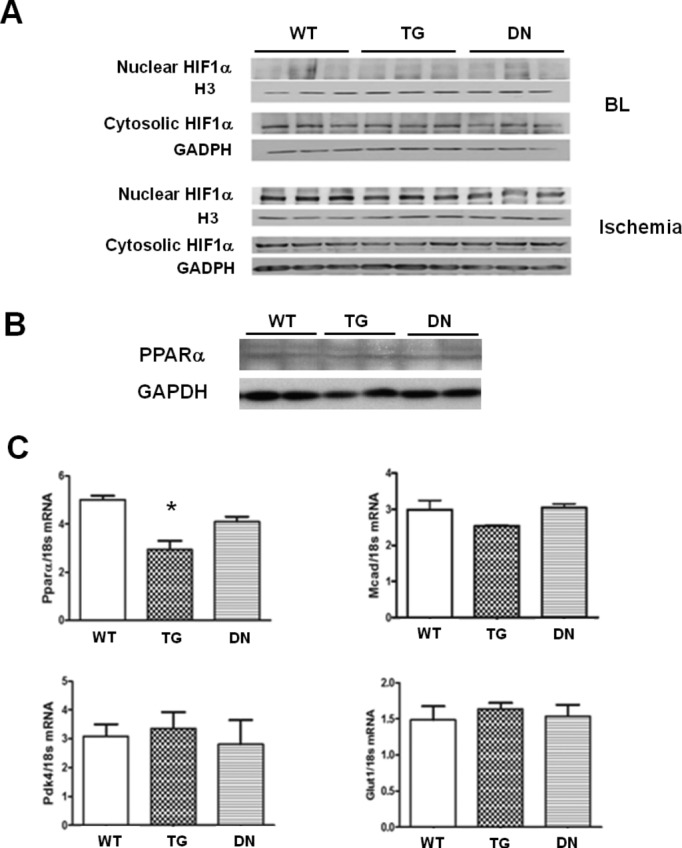
(A) Protein levels of HIF1α in the nuclear and cytosolic fractions of heart tissues harvested at baseline (BL) and end‐ischemia. (B) Protein levels of PPARα in the tissue homogenate of WT, TG, and DN hearts were analyzed by Western blot. (C) The mRNA expression levels of PPARα, MCAD, PDK4, and GLUT1 in WT, TG, and DN hearts harvested at baseline were determined by real‐time PCR (n=4 to 6/group). *P<0.05 vs WT. DN indicates dominant negative; GLUT1, glucose transporter‐1; HIF1α, hypoxia inducible factor 1α; MCAD, medium‐chain acyl‐coenzyme A dehydrogenase; PCR, polymerase chain reaction; PDK4, pyruvate dehydrogenase kinase isoform 4; PPARα, peroxisome proliferator‐activated receptor‐α; TG, transgenic; WT, wild‐type.
Discussion
Using mouse models with cardiac‐specific overexpression of NADPH oxidase Nox4 in the WT (TG) and dominant‐negative (DN) mutant forms, we have observed novel roles of Nox in cellular redox regulation and in acute responses to I/R. Overexpression of Nox4 or dominant negative Nox4 markedly impacted the redox states of the heart under normal perfusion conditions. TG showed oxidative stress [low GSH/GSSG, high NAD(P)+/NAD(P)H], while DN displayed reductive stress [high GSH/GSSG, low NAD(P)+/NADPH]. As expected, the elevated oxidative stress in TG was associated with a moderate increase in I/R injury. It was unexpected, though, that the DN, which presented a highly reduced state due to broad inhibition of Nox, sustained even greater damage by I/R. We have further shown that the I/R injury in the DN was attributable to increased mitochondrial ROS production during ischemia, loss of mitochondrial membrane potential, and exacerbated impairment of myocardial energetics. These defects could be rescued by lowering the NADH production in the DN hearts. Our results, therefore, revealed a critical role of reductive stress in promoting oxidative I/R injury.
Although increased Nox4 activity has been associated with increased oxidative stress, we did not detect significant increases of the ROS levels in the TG hearts from the young mice and under normal perfusion. However, the aconitase activity was decreased in the TG hearts, suggesting that cumulative oxidative damage had occurred despite the modest changes of the ROS level. We also found marked decreases in NAD(P)H and GSH levels in TG hearts. The total NAD(P)+/NAD(P)H pool was also increased with enhanced exchange between the mitochondria and cytosolic pools. These changes collectively reflect that chronically increased Nox activity altered metabolism and induced a rigorous antioxidative response at the expense of redox balance. Previous studies have shown that the NADH and NADPH levels can be linked through multiple reactions in the mitochondrial and cytosolic compartments, including reactions catalyzed by nicotinamide nucleotide transhydrogenase, isocitrate dehydrogenase, tricarboxylate carrier, and malate/aspartate shuttle.15–16,15–35 Increased NADPH consumption in TG may therefore shift the redox equilibrium toward a higher NAD(P)+/NAD(P)H ratio. These changes have also promoted the communication of cytosolic and mitochondrial NADH pool, as evidenced by the doubling of the malate/aspartate shuttle capacity, leading to a global change of cellular redox state. Our study did not address the potential effects of Nox activity on other pathways for NADH production and consumption, but we previously reported that Nox4 was localized on mitochondria and consumes NADH.11 Unlike the TG mice, overexpression of a dominant negative Nox4 protein (DN) resulted in a highly reduced state. We recently showed that the DN robustly bound to p22phox and that transgenic expression of DN exhausted endogenous p22phox in cardiac myocytes, indicating that DN competes not only with endogenous Nox4 but also with Nox2 for p22phox. Consistent with the notion, increases in NAD(P)H level in the DN are greater than those with single deletion of Nox2 or Nox4 but comparable to those with double deletion of Nox2/4.30 Therefore, the DN heart models a general elimination of Nox activity rather than specific loss of function of the Nox4.
The TG hearts demonstrated an increased sensitivity to I/R injury, which was associated with a greater cellular but not mitochondrial ROS production during ischemia and at early reperfusion. This finding is consistent with the detrimental role of Nox4 previously observed in cerebral ischemia36 and supports the notion that activation of Nox4 contributes to I/R injury. Surprisingly, elimination of Nox activity in the DN hearts leads to even more severe I/R damage, raising the possibility of reductive stress. The reductive stress describes an abnormally high reducing environment in the cells with high GSH/GSSG, low NADP+/NADPH,37–38 or low NAD+/NADH ratio.39 It has been suggested that decreases in NAD+/NADH ratio, which have been observed in mitochondrial diseases or metabolic diseases such as diabetes, promote reductive stress.40–41 Increased NADPH level facilitates the reduction of GSSG to GSH, which serves as an important antioxidant mechanism. However, it has been shown that excessive increases in GSH/GSSG ratio paradoxically elevate mitochondrial oxidation and cytotoxicity in cultured cells and cause cardiomyopathy in mice.42–44 Our data also raise a cautionary note in targeting the NADPH oxidase activity for cardioprotection as the reductive stress resulting from the excessive suppression of the system leads to greater I/R injury than activation of the system.
The DN hearts show a unique increase in mitochondrial ROS production during ischemia compared with the TG hearts, which produce more ROS in the cytosol during I/R. The greater mitochondrial ROS production is accompanied by the loss of mitochondrial membrane potential, accelerated ATP depletion, and a stable NADH level during ischemia, suggesting that the ROS generation and mitochondrial function are reciprocally linked under this condition. It has been hypothesized that very low NAD+/NADH ratio associated with severely reduced state in combination with slow electron flow through the electron transport chain can facilitate the direct transfer of the electrons to oxygen (leaking) to produce superoxide.45–47 Although this notion is largely based on in vitro experiments using isolated mitochondria, our data suggest that such a scenario is the case for the DN heart subjected to ischemia in which excessive NADH level meets the slow electron transport chain flow. It should be mentioned that ischemia elevates NADH level (NAD+/NADH ratio declines) in WT and TG hearts, as we do detect increased NADH autofluorescence and decreased NAD+/NADH ratio, but does not cause electron leak in these hearts during ischemia. Therefore, a threshold of the NAD+/NADH ratio (or NADH level) may exist above which significant electron leaks can happen. The high level of NADH in DN hearts during normal perfusion likely renders it close to the threshold, which allows NADH to donate electrons for robust ROS production during slowed electron transport chain flow. Damages caused by the ROS may lead to further electron leak and form a vicious circle of mitochondrial injury leading to the severe insult as we have observed in DN but not in WT and TG during ischemia.
If the reductive stress worsens ischemic injury, approaches that restore the redox balance would be protective. Indeed, we were able to improve the postischemic recovery in the DN by partially restoring the NAD+/NADH ratio through modulating substrate supply in the perfused hearts. It has been shown that the mitochondrial NADH level can be modulated by altering substrate supply in isolated perfused hearts without affecting MVO2 or contractile function.24,48 By removing fatty acids, lactate, ketone, and insulin from the perfusate, we aim to restrict substrate availability to the tricarboxylic acid cycle, hence reducing the NADH production. This approach has successfully increased NAD+/NADH ratio in DN hearts before ischemia and lowered their vulnerability to I/R injury. We have recently demonstrated that decreased NAD+/NADH ratio leads to an increase in protein acetylation and sensitization of the mitochondrial permeability pore transition.49 Therefore, restoration of the NAD+/NADH ratio may improve post I/R recovery by stabilizing mitochondrial permeability pore during reperfusion.
It has been suggested that the lack of Nox‐mediated ROS generation will prevent the accumulation of HIF1α and consequently impair the switch of fatty acid to glucose utilization during ischemia, thus causing more severe damage. This is unlikely in our experimental setting, because we did not observe any downregulation of glycolytic activity in DN hearts during ischemia or a heightened uncoupling of glycolysis and glucose oxidation, which occurs during excessive fatty acid oxidation. Furthermore, the lactate production during ischemia is similar in each genotype with either set of substrates despite the dramatic differences in the functional phenotype. These observations, however, do not rule out the possibility that fatty acid oxidation could promote more mitochondrial ROS formation. Fatty acids generate not only reducing equivalent NADH but also FADH2 that enters the electron transport system through electron transfer flavoproteins. The FADH2 flux to the electron transport system in mixed substrate perfused hearts could compete for the electron transfer at coenzyme Q with NADH, further enhancing reverse electron flow and O2− generation.14,50–51
In summary, the present study provides strong evidence that elimination of Nox activity causes reductive stress and renders the heart vulnerable to ischemic injury through paradoxical oxidative damage of the mitochondria. On the other hand, overexpression of Nox4 leads to oxidative stress and contractile dysfunction after I/R, suggesting that the imbalance of redox status toward either extreme in the heart deteriorates the outcome of I/R injury. Studies using genetic models are for proof‐of concept rather than defining quantitative relationships. Nevertheless, the findings highlight the complexity of developing therapeutic strategies by modulating the cellular redox states. Antioxidant therapies or specific NADPH oxidase inhibitors have been developed to treat diseases attributed to oxidative stress. Our study has demonstrated that redox couples are intricately linked to maintain the delicate balance of cellular redox status. Any substantial disturbance of the redox status, including excessively reduced state, will ultimately lead to oxidative damage. This warrants caution, especially for pathological conditions such as metabolic diseases and mitochondrial dysfunction, in which both redox imbalance and oxidative stress are observed.
Sources of Funding
This study is supported by National Institutes of Health grants HL110349 and HL059246 to R.T., HL114760 to W.W., and HL102738, HL67724, HL69020, HL91469, AG23039, and AG27211 to J.S. J.S. is also supported by Foundation Leducq Transatlantic Networks of Excellence. Q.Y. is a recipient of the State Scholarship Fund of China (No. 2008659008), C.F.L. is supported by a postdoctoral fellowship from the American Heart Association (AHA), and W.W. is a recipient of an AHA Scientist Development Award.
Disclosures
None.
Acknowledgments
We would like to thank Peter Rabinovitch for his advice and Simon Johnson for his help in performing perfusion staining of the tissue ROS levels in the heart.
References
- 1.Brandes RP, Weissmann N, Schroder K. NADPH oxidases in cardiovascular disease. Free Radical Biol Med. 2010; 49:687-706 [DOI] [PubMed] [Google Scholar]
- 2.Maejima Y, Kuroda J, Matsushima S, Ago T, Sadoshima J. Regulation of myocardial growth and death by NADPH oxidase. J Mol Cell Cardiol. 2011; 50:408-416 [DOI] [PMC free article] [PubMed] [Google Scholar]
- 3.Murphy E, Steenbergen C. Mechanisms underlying acute protection from cardiac ischemia‐reperfusion injury. Physiol Rev. 2008; 88:581-609 [DOI] [PMC free article] [PubMed] [Google Scholar]
- 4.Penna C, Mancardi D, Rastaldo R, Pagliaro P. Cardioprotection: a radical view free radicals in pre and postconditioning. Biochim Biophys Acta. 2009; 1787:781-793 [DOI] [PubMed] [Google Scholar]
- 5.Bedard K, Krause KH. The NOX family of ROS‐generating NADPH oxidases: physiology and pathophysiology. Physiol Rev. 2007; 87:245-313 [DOI] [PubMed] [Google Scholar]
- 6.Lambeth JD. NOX enzymes and the biology of reactive oxygen. Nat Rev Immunol. 2004; 4:181-189 [DOI] [PubMed] [Google Scholar]
- 7.Lassegue B, San Martin A, Griendling KK. Biochemistry, physiology, and pathophysiology of NADPH oxidases in the cardiovascular system. Circ Res. 2012; 110:1364-1390 [DOI] [PMC free article] [PubMed] [Google Scholar]
- 8.Serrander L, Cartier L, Bedard K, Banfi B, Lardy B, Plastre O, Sienkiewicz A, Forro L, Schlegel W, Krause KH. NOX4 activity is determined by mRNA levels and reveals a unique pattern of ROS generation. Biochem J. 2007; 406:105-114 [DOI] [PMC free article] [PubMed] [Google Scholar]
- 9.Bell RM, Cave AC, Johar S, Hearse DJ, Shah AM, Shattock MJ. Pivotal role of NOX‐2‐containing NADPH oxidase in early ischemic preconditioning. FASEB J. 2005; 19:2037-2039 [DOI] [PubMed] [Google Scholar]
- 10.Hoffmeyer MR, Jones SP, Ross CR, Sharp B, Grisham MB, Laroux FS, Stalker TJ, Scalia R, Lefer DJ. Myocardial ischemia/reperfusion injury in NADPH oxidase‐deficient mice. Circ Res. 2000; 87:812-817 [DOI] [PubMed] [Google Scholar]
- 11.Ago T, Kuroda J, Pain J, Fu C, Li H, Sadoshima J. Upregulation of Nox4 by hypertrophic stimuli promotes apoptosis and mitochondrial dysfunction in cardiac myocytes. Circ Res. 2010; 106:1253-1264 [DOI] [PMC free article] [PubMed] [Google Scholar]
- 12.Kuroda J, Ago T, Matsushima S, Zhai P, Schneider MD, Sadoshima J. NADPH oxidase 4 (Nox4) is a major source of oxidative stress in the failing heart. Proc Natl Acad Sci USA. 2010; 107:15565-15570 [DOI] [PMC free article] [PubMed] [Google Scholar]
- 13.Zhang M, Brewer AC, Schroder K, Santos CX, Grieve DJ, Wang M, Anilkumar N, Yu B, Dong X, Walker SJ, Brandes RP, Shah AM. NADPH oxidase‐4 mediates protection against chronic load‐induced stress in mouse hearts by enhancing angiogenesis. Proc Natl Acad Sci USA. 2010; 107:18121-18126 [DOI] [PMC free article] [PubMed] [Google Scholar]
- 14.Aon MA, Cortassa S, O'Rourke B. Redox‐optimized ROS balance: a unifying hypothesis. Biochim Biophys Acta. 2010; 1797:865-877 [DOI] [PMC free article] [PubMed] [Google Scholar]
- 15.Rydstrom J. Mitochondrial NADPH, transhydrogenase and disease. Biochim Biophys Acta. 2006; 1757:721-726 [DOI] [PubMed] [Google Scholar]
- 16.Sazanov LA, Jackson JB. Proton‐translocating transhydrogenase and NAD‐ and NADP‐linked isocitrate dehydrogenases operate in a substrate cycle which contributes to fine regulation of the tricarboxylic acid cycle activity in mitochondria. FEBS Lett. 1994; 344:109-116 [DOI] [PubMed] [Google Scholar]
- 17.Comte B, Vincent G, Bouchard B, Benderdour M, Des Rosiers C. Reverse flux through cardiac NADP(+)‐isocitrate dehydrogenase under normoxia and ischemia. Am J Physiol Heart Circ Physiol. 2002; 283:H1505-H1514 [DOI] [PubMed] [Google Scholar]
- 18.Yan J, Young ME, Cui L, Lopaschuk GD, Liao R, Tian R. Increased glucose uptake and oxidation in mouse hearts prevent high fatty acid oxidation but cause cardiac dysfunction in diet‐induced obesity. Circulation. 2009; 119:2818-2828 [DOI] [PMC free article] [PubMed] [Google Scholar]
- 19.Kolwicz SC, Jr, Tian R. Assessment of cardiac function and energetics in isolated mouse hearts using 31P NMR spectroscopy. J Vis Exp. 2010; 42:2069. [DOI] [PMC free article] [PubMed] [Google Scholar]
- 20.Luptak I, Yan J, Cui L, Jain M, Liao R, Tian R. Long‐term effects of increased glucose entry on mouse hearts during normal aging and ischemic stress. Circulation. 2007; 116:901-909 [DOI] [PubMed] [Google Scholar]
- 21.Naryzhnaia NV, Neckar J, Maslov LN, Lishmanov Iu B, Kolar F, Lasukova TV. [The role of sarcolemmal and mitochondrial K(ATP)‐channels in realization of the cardioprotection and antiarrhythmic effect of different regimens of hypobaric adaptation]. Ross Fiziol Zh Im I M Sechenova. 2009; 95:837-849 [PubMed] [Google Scholar]
- 22.Johnson S, Rabinovitch P. Ex vivo imaging of excised tissue using vital dyes and confocal microscopy. Curr Protoc Cytom. 2012 [DOI] [PMC free article] [PubMed] [Google Scholar]
- 23.Ralphe JC, Bedell K, Segar JL, Scholz TD. Correlation between myocardial malate/aspartate shuttle activity and EAAT1 protein expression in hyper‐ and hypothyroidism. Am J Physiol Heart Circ Physiol. 2005; 288:H2521-H2526 [DOI] [PubMed] [Google Scholar]
- 24.Scholz TD, Koppenhafer SL. Reducing equivalent shuttles in developing porcine myocardium: enhanced capacity in the newborn heart. Pediatr Res. 1995; 38:221-227 [DOI] [PubMed] [Google Scholar]
- 25.Boehm EA, Jones BE, Radda GK, Veech RL, Clarke K. Increased uncoupling proteins and decreased efficiency in palmitate‐perfused hyperthyroid rat heart. Am J Physiol Heart Circ Physiol. 2001; 280:H977-H983 [DOI] [PubMed] [Google Scholar]
- 26.Kabaeva Z, Zhao M, Michele DE. Blebbistatin extends culture life of adult mouse cardiac myocytes and allows efficient and stable transgene expression. Am J Physiol Heart Circ Physiol. 2008; 294:H1667-H1674 [DOI] [PubMed] [Google Scholar]
- 27.Belousov VV, Fradkov AF, Lukyanov KA, Staroverov DB, Shakhbazov KS, Terskikh AV, Lukyanov S. Genetically encoded fluorescent indicator for intracellular hydrogen peroxide. Nat Methods. 2006; 3:281-286 [DOI] [PubMed] [Google Scholar]
- 28.Huang Z, Zhang W, Fang H, Zheng M, Wang X, Xu J, Cheng H, Gong G, Wang W, Dirksen RT, Sheu SS. Response to “A critical evaluation of cpYFP as a probe for superoxide”. Free Radical Biol Med. 2011; 51:1937-1940 [DOI] [PubMed] [Google Scholar]
- 29.Dikalov S, Griendling KK, Harrison DG. Measurement of reactive oxygen species in cardiovascular studies. Hypertension. 2007; 49:717-727 [DOI] [PMC free article] [PubMed] [Google Scholar]
- 30.Matsushima SK, Kuroda J, Ago T, Zhai P, Ikeda Y, Oka S, Fong GH, Tian R, Sadoshima J. Broad suppression of NADPH oxidase activity exacerbates ischemia/reperfusion injury through inadvertent downregulation of HIF‐1 and upregulation of PPARα. Circ Res. 2013; 112:1135-1149 [DOI] [PMC free article] [PubMed] [Google Scholar]
- 31.Luptak I, Balschi JA, Xing Y, Leone TC, Kelly DP, Tian R. Decreased contractile and metabolic reserve in peroxisome proliferator‐activated receptor‐alpha‐null hearts can be rescued by increasing glucose transport and utilization. Circulation. 2005; 112:2339-2346 [DOI] [PubMed] [Google Scholar]
- 32.Brookes PS, Yoon Y, Robotham JL, Anders MW, Sheu SS. ATP, and ROS: a mitochondrial love‐hate triangle. Am J Physiol Cell Physiol. 2004; 287:C817-C833 [DOI] [PubMed] [Google Scholar]
- 33.Bakker BM, Overkamp KM, van Maris AJ, Kotter P, Luttik MA, van Dijken JP, Pronk JT. Stoichiometry and compartmentation of NADH metabolism in Saccharomyces cerevisiae. FEMS Microbiol Rev. 2001; 25:15-37 [DOI] [PubMed] [Google Scholar]
- 34.Houtkooper RH, Canto C, Wanders RJ, Auwerx J. The secret life of NAD+: an old metabolite controlling new metabolic signaling pathways. Endocr Rev. 2010; 31:194-223 [DOI] [PMC free article] [PubMed] [Google Scholar]
- 35.Hoek JB, Rydstrom J. Physiological roles of nicotinamide nucleotide transhydrogenase. Biochem J. 1988; 254:1-10 [DOI] [PMC free article] [PubMed] [Google Scholar]
- 36.Kleinschnitz C, Grund H, Wingler K, Armitage ME, Jones E, Mittal M, Barit D, Schwarz T, Geis C, Kraft P, Barthel K, Schuhmann MK, Herrmann AM, Meuth SG, Stoll G, Meurer S, Schrewe A, Becker L, Gailus‐Durner V, Fuchs H, Klopstock T, de Angelis MH, Jandeleit‐Dahm K, Shah AM, Weissmann N, Schmidt HH. Post‐stroke inhibition of induced NADPH oxidase type 4 prevents oxidative stress and neurodegeneration. PLoS Biol. 2010; 8:e1000479. [DOI] [PMC free article] [PubMed] [Google Scholar]
- 37.Gupte SA, Levine RJ, Gupte RS, Young ME, Lionetti V, Labinskyy V, Floyd BC, Ojaimi C, Bellomo M, Wolin MS, Recchia FA. Glucose‐6‐phosphate dehydrogenase‐derived NADPH fuels superoxide production in the failing heart. J Mol Cell Cardiol. 2006; 41:340-349 [DOI] [PubMed] [Google Scholar]
- 38.Wingler K, Hermans JJ, Schiffers P, Moens A, Paul M, Schmidt HH. NOX1, 2, 4, 5: counting out oxidative stress. Br J Pharmacol. 2011; 164:866-883 [DOI] [PMC free article] [PubMed] [Google Scholar]
- 39.Ido Y, Chang K, Williamson JR. NADH augments blood flow in physiologically activated retina and visual cortex. Proc Natl Acad Sci USA. 2004; 101:653-658 [DOI] [PMC free article] [PubMed] [Google Scholar]
- 40.Ido Y. Pyridine nucleotide redox abnormalities in diabetes. Antioxid Redox Signal. 2007; 9:931-942 [DOI] [PubMed] [Google Scholar]
- 41.Ying W. NAD+/NADH and NADP+/NADPH in cellular functions and cell death: regulation and biological consequences. Antioxid Redox Signal. 2008; 10:179-206 [DOI] [PubMed] [Google Scholar]
- 42.Rajasekaran NS, Connell P, Christians ES, Yan LJ, Taylor RP, Orosz A, Zhang XQ, Stevenson TJ, Peshock RM, Leopold JA, Barry WH, Loscalzo J, Odelberg SJ, Benjamin IJ. Human alpha B‐crystallin mutation causes oxido‐reductive stress and protein aggregation cardiomyopathy in mice. Cell. 2007; 130:427-439 [DOI] [PMC free article] [PubMed] [Google Scholar]
- 43.Zhang H, Limphong P, Pieper J, Liu Q, Rodesch CK, Christians E, Benjamin IJ. Glutathione‐dependent reductive stress triggers mitochondrial oxidation and cytotoxicity. FASEB J. 2012; 26:1442-1451 [DOI] [PMC free article] [PubMed] [Google Scholar]
- 44.Zhang X, Min X, Li C, Benjamin IJ, Qian B, Ding Z, Gao X, Yao Y, Ma Y, Cheng Y, Liu L. Involvement of reductive stress in the cardiomyopathy in transgenic mice with cardiac‐specific overexpression of heat shock protein 27. Hypertension. 2010; 55:1412-1417 [DOI] [PubMed] [Google Scholar]
- 45.Kushnareva Y, Murphy AN, Andreyev A. Complex I‐mediated reactive oxygen species generation: modulation by cytochrome c and NAD(P)+ oxidation‐reduction state. Biochem J. 2002; 368:545-553 [DOI] [PMC free article] [PubMed] [Google Scholar]
- 46.Kussmaul L, Hirst J. The mechanism of superoxide production by NADH: ubiquinone oxidoreductase (complex I) from bovine heart mitochondria. Proc Natl Acad Sci USA. 2006; 103:7607-7612 [DOI] [PMC free article] [PubMed] [Google Scholar]
- 47.Murphy MP. How mitochondria produce reactive oxygen species. Biochem J. 2009; 417:1-13 [DOI] [PMC free article] [PubMed] [Google Scholar]
- 48.Kim DK, Heineman FW, Balaban RS. Effects of beta‐hydroxybutyrate on oxidative metabolism and phosphorylation potential in canine heart in vivo. Am J Physiol. 1991; 260:H1767-H1773 [DOI] [PubMed] [Google Scholar]
- 49.Karamanlidis G, Lee CF, Garcia‐Menendez L, Kolwicz SC, Jr, Suthammarak W, Gong G, Sedensky MM, Morgan PG, Wang W, Tian R. Mitochondrial complex I deficiency increases protein acetylation and accelerates heart failure. Cell Metab. 2013; 18:239-250 [DOI] [PMC free article] [PubMed] [Google Scholar]
- 50.Votyakova TV, Reynolds IJ. DeltaPsi(m)‐dependent and ‐independent production of reactive oxygen species by rat brain mitochondria. J Neurochem. 2001; 79:266-277 [DOI] [PubMed] [Google Scholar]
- 51.St‐Pierre J, Buckingham JA, Roebuck SJ, Brand MD. Topology of superoxide production from different sites in the mitochondrial electron transport chain. J Biol Chem. 2002; 277:44784-44790 [DOI] [PubMed] [Google Scholar]