

Abstract
Background
Patients with unprovoked venous thromboembolism (VTE) can be stratified according to their recurrence risk based on their sex, the VTE location, and d‐dimer measured 3 weeks after anticoagulation by the Vienna Prediction Model. We aimed to expand the model to also assess the recurrence risk from later points on.
Methods and Results
Five hundred and fifty‐three patients with a first VTE were followed for a median of 68 months. We excluded patients with VTE provoked by a transient risk factor or female hormone intake, with a natural inhibitor deficiency, the lupus anticoagulant, or cancer. The study end point was recurrent VTE, which occurred in 150 patients. d‐Dimer levels did not substantially increase over time. Subdistribution hazard ratios (95% confidence intervals) dynamically changed from 2.43 (1.57 to 3.77) at 3 weeks to 2.27 (1.48 to 3.48), 1.98 (1.30 to 3.02) , and 1.73 (1.11 to 2.69) at 3, 9, and 15 months in men versus women, from 1.84 (1.00 to 3.43) to 1.68 (0.91 to 3.10), 1.49 (0.79 to 2.81) , and 1.44 (0.76 to 2.72) in patients with proximal deep vein thrombosis or pulmonary embolism compared with calf vein thrombosis, and from 1.30 (1.07 to 1.58) to 1.27 (1.06 to 1.51), 1.20 (1.02 to 1.41), and 1.13 (0.95 to 1.36) per doubling d‐dimer. Using a dynamic landmark competing risks regression approach, we generated nomograms and a web‐based calculator to calculate risk scores and recurrence rates from multiple times after anticoagulation.
Conclusions
Risk of recurrent VTE after discontinuation of anticoagulation can be predicted from multiple random time points by integrating the patient's sex, location of first VTE, and serial d‐dimer measurements.
Keywords: d‐dimer, recurrence, venous thrombosis, Vienna Prediction Model
Introduction
Patients with venous thromboembolism (VTE) that occurs in the absence of a transient risk factor including surgery, trauma, immobilization, or pregnancy have a high risk of recurrence.1 These patients are candidates for extended anticoagulation already after a first event provided that risk factors of bleeding are modest and that good anticoagulant control can be achieved. However, the majority of these patients stays recurrence free and, if anticoagulated, are unnecessarily exposed to a bleeding risk. For vitamin K antagonists the annual risk of bleeding ranges between 1% and 3%2–4 and is not substantially lower with the new oral anticoagulants.5–7 Some patients also dislike anticoagulation because of the prospect of a long‐time medical treatment or inconveniences in professional life.8
Over the last years, attempts have been made to more precisely estimate the risk of recurrence after an unprovoked VTE to improve the identification of patients who clearly benefit from extended anticoagulation. Palareti and colleagues were the first to show an association between levels of d‐dimer and the risk of recurrence.9 In confirmation of these data, we found that patients with unprovoked VTE and a d‐dimer <250 ng/mL 3 weeks after discontinuation of anticoagulation have a risk of recurrence as low as 3.7% after 2 years.10 According to another Italian study, the high risk of recurrence of patients with abnormal d‐dimer after discontinuation of anticoagulation can be substantially reduced by extending anticoagulation.11
To further improve risk assessment of recurrent VTE, clinical risk factors were combined with d‐dimer measurement with the intention to create prediction rules. In a prospective study from Canada, signs of postthrombotic syndrome, high d‐dimer while taking warfarin, obesity, and advanced age were predictive of an increased recurrence risk in women.12 In an individual patient data meta‐analysis of 7 prospective studies enrolling patients with a first objectively diagnosed VTE, abnormal d‐dimer after stopping anticoagulation, younger age, male sex, and VTE not associated with female hormonal therapy were the main predictors of recurrence.13 We recently presented the Vienna Prediction Model, which allows prediction of recurrent VTE in patients with unprovoked deep vein thrombosis (DVT) and/or pulmonary embolism (PE).14 Of 7 variables including age, sex, thrombus location, body mass index, factor V Leiden, prothrombin mutation, and d‐dimer (which were preselected as relevant risk factors), only the patient's sex, thrombus location, and d‐dimer were relevant predictors of the recurrence risk. On the basis of these variables, we developed a nomogram and a web‐based risk calculator (http://cemsiis.meduniwien.ac.at/en/kb/science-research/software/clinical-software/recurrent-vte/) to calculate risk scores and to estimate the cumulative probability of recurrence in an individual patient.
Our original model allows prediction of recurrence at a single point, that is, 3 weeks after anticoagulation. The main aim of this analysis was to also expand the model to assess the recurrence risk from later points. For this purpose we integrated d‐dimer levels measured at several times after anticoagulation with the patient's sex and location of VTE. In addition, we updated our risk model on the basis of a larger number of recurrent events and a longer observation time.
Methods
Study Population
This analysis was part of the Austrian Study on Recurrent Venous Thromboembolism, which is a prospective cohort study recruiting patients from 4 thrombosis centers in Vienna, Austria.15 Patients with a first VTE seen between January 2000 and August 2008 who had been treated with oral anticoagulants for ≥3 months were included. Patients with VTE provoked by surgery, trauma, pregnancy, or female hormone intake, with a natural inhibitor deficiency, the lupus anticoagulant, or cancer were excluded.
Diagnosis of DVT was established by a positive finding on venography or color duplex sonography. The diagnosis of PE was confirmed by spiral computed tomography or ventilation–perfusion scanning. Patients with both symptomatic PE and DVT were classified as having a PE.
The end point of the study was recurrent symptomatic DVT confirmed by venography or color duplex sonography (in case of proximal thrombosis of the contralateral leg) or recurrent symptomatic PE, confirmed by ventilation–perfusion scanning and/or spiral computed tomography. The ethics committee of the Medical University of Vienna approved the study, and all patients provided written informed consent.
Blood Sampling and Laboratory Analyses
Venous blood was collected into 1/10 volume of trisodium citrate 0.11 mmol/L and was immediately centrifuged for 20 minutes at 2000g. The plasma was stored at −80°C. At baseline, that is, 3 weeks after discontinuation of vitamin K antagonists at the time when the prothrombin time had normalized, determination of antithrombin, protein C, and protein S, diagnosis of a lupus anticoagulant, and screening for factor V Leiden and for prothrombin G20210A were performed according to standard protocols. d‐Dimer was determined by ELISA (Asserachrom d‐Dimer, Boehringer Mannheim, Germany). Patients were seen 3 weeks (baseline) and 3, 9, 15, and 24 months after discontinuation of vitamin K antagonists. At these times blood for d‐dimer measurement was obtained. If patients could not adhere to their prescheduled appointments, blood samples were taken between the times.
Statistical Analysis
We used a cause‐specific cumulative incidence curve to describe the time to recurrence of VTE. d‐Dimer values were log‐base‐2‐transformed before further statistical analysis because of their skewed distribution. The effect of time since anticoagulation on the longitudinal d‐dimer values was assessed using a linear mixed random coefficients model including time since end of anticoagulation as fixed effect and patient‐specific random coefficients for the effect of time (intercept and slope).
We estimated a dynamic prediction model based on a stratified Fine–Gray regression model to incorporate the longitudinal d‐dimer values into our previously published prediction model, including sex, location of primary VTE and d‐dimer as predictors.16–17 The Fine–Gray model is a modification of the Cox model, enabling the estimation of cumulative recurrence via covariates in the presence of competing risks and thus accounting for the finding that in some patients recurrence can never be observed because of mortality after reinitiating anticoagulation. Effects of covariates on the cumulative recurrence rate are quantified as subdistribution hazard ratios. The dynamic prediction model not only allows making predictions of the cumulative recurrence risk at baseline, but also at later times conditional on being recurrence free up to those later times and using updated d‐dimer values. Technically, the analysis is carried out in 2 steps. In the first step, multiple modified copies of the original data set are constructed, each with a different so‐called landmark time, which in our case was defined as ranging from 0 to 24 months. Each modified copy of the original data set includes only those patients who are still at risk for recurrence at time of the landmark. In the second step, the copies are combined into 1 “stacked” data set and analyzed using a stratified Fine–Gray regression model, in which the landmark time is used as a stratification factor. To avoid underestimation of the variance because of the artificial multiple appearance of many patients in the analysis, the sandwich estimator of the covariance is used.18 Furthermore, interaction (product) terms of the covariates with the landmark time were included. Based on graphical examinations, we assumed linear interaction with landmark time for the effects of sex and log d‐dimer, and a quadratic (U‐shaped) interaction with landmark time for location. In our study, we were interested in predicting the cumulative recurrence risk up to 5 years from baseline. Thus, the prediction horizon was set to 5 years from the landmark time, implying that events after the prediction horizon were censored.
Landmark‐specific global shrinkage (calibration) factors were computed using leave‐one‐out resampling19 and, based on graphical examination, were assumed to follow a quadratic relationship with the landmark time. The coefficients of the dynamic prediction model estimated on the original data were multiplied by the respective shrinkage factors. Performance of the recalibrated model was assessed by cross‐validated discrimination indices (c‐indices) for predicting the cumulative recurrence risk 60 months after the landmark time modified for the competing risk situation.20 Calibration of the dynamic prediction model was assessed by comparing the predicted and the observed 60 months of cumulative recurrence rates in quartiles defined by the linear predictor, showing mean observed and predicted cumulative recurrence rates and standard deviation of the predicted rates. We used the leave‐one‐out cross‐validation approach for assessing discrimination and calibration of the model, and discrimination and calibration of the dynamic prediction model was assessed separately for prediction from landmark times of 0, 3, 9, 15, and 24 months. All analyses were carried out using SAS Version 9.3 (2011 SAS Institute Inc, Cary, NC) and R version 2.12.2 (http://www.r-project.org). The dynamic prediction model was fit using the PSHREG SAS macro.21
Results
Patients
The study population comprised 553 patients with a first unprovoked VTE (Table 1). Patients were on average 53 years old, and 40% were female. The initial VTE was a distal DVT of the leg in 16.1%, a proximal DVT of the leg in 38.5%, and a PE with or without DVT in 45.4%. Twenty‐three percent were heterozygous carriers of the factor V Leiden mutation and 5% of the prothrombin mutation. The median duration of anticoagulation was 6.7 months. Patients were followed in median for almost 6 years.
Table 1.
Characteristics of 553 Patients With Unprovoked Venous Thromboembolism
| Characteristic | Value |
|---|---|
| Age (y), median (25th, 75th percentiles) | 53.4 (42.5, 62.4) |
| Female sex, n (%) | 219 (39.6) |
| Location of first VTE, n (%) | |
| Distal deep vein thrombosis | 89 (16.1) |
| Proximal deep vein thrombosis | 213 (38.5) |
| Pulmonary embolism | 251 (45.4) |
| Body mass index (kg/m2), median (25th, 75th percentiles) | 27.2 (24.4, 30.0) |
| Factor V Leiden mutation, n (%) | 126 (22.8) |
| Prothrombin mutation, n (%) | 27 (4.9) |
| Duration of anticoagulation (mo), median (25th, 75th percentiles) | 6.7 (6.2, 8.5) |
| Observation time (mo), median (25th, 75th percentiles) | 68 (46, 98) |
VTE indicates venous thromboembolism.
One hundred and fifty patients had recurrent VTE (DVT in 78 patients and PE in 72 patients). Recurrence was unprovoked in 129 patients (86%). During follow‐up 73 patients (13.2%) started antithrombotic treatment for reasons other than VTE, and 7 patients (1.2%) died. These events were counted as competing events. The cumulative probability of recurrence was 7.2% (95% CI, 5.0% to 9.3%) after 1 year and 23.0% (95% CI, 19.2% to 26.6%) after 5 years (Figure 1).
Figure 1.
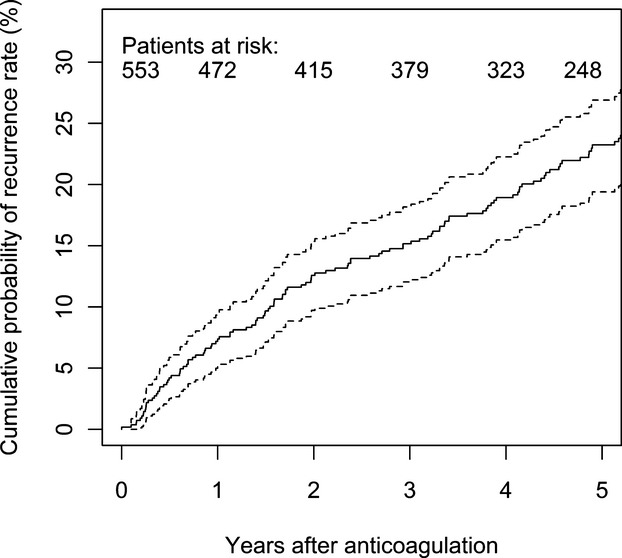
Overall cumulative recurrence rate in 553 patients with a first unprovoked venous thromboembolism estimated by the nonparametric cumulative incidence estimation method,22 with 95% confidence intervals (dotted lines).
d‐Dimer Levels After Discontinuation of Anticoagulation
d‐Dimer levels at baseline (3 weeks after discontinuation of anticoagulation) varied considerably between patients and did not substantially—albeit statistical significantly (P<0.001)—increase over 2 years (Table 2). d‐Dimer levels were positively correlated with age (r=0.53, P<0.001), and women had higher levels than men (median [25th to 75th percentiles], 381.7 [274.5 to 661.7] versus 298.3 [204.4 to 460.1], respectively; P<0.001).
Table 2.
d‐Dimer Levels Over Time After Discontinuation of Anticoagulation
| Time* | Patients, n | d‐Dimer (ng/mL), Median (25th, 75th Percentiles) |
|---|---|---|
| Baseline | 553 | 338 (226, 551) |
| 3 Months | 534 | 339 (227, 551) |
| 9 Months | 494 | 356 (239, 557) |
| 15 Months | 457 | 363 (237, 572) |
For each patient still at risk for recurrence, the most recent measurement was considered.
Updated Prediction Model
We estimated the effects of sex, location of first VTE, and d‐dimer on recurrence risk using a multivariable dynamic prediction model (Table 3). Hazard ratios of recurrence from baseline and 3, 9 and 15 months after the initial event were calculated.
Table 3.
Subdistribution Hazard Ratios for Recurrent Venous Thromboembolism From the Multivariable Dynamic Prediction Model
| Variable | Point From Which Risk Was Calculated | SHR (95% CI) |
|---|---|---|
| Male vs female sex | Baseline* | 2.43 (1.57 to 3.77) |
| 3 Months | 2.27 (1.48 to 3.48) | |
| 9 Months | 1.98 (1.30 to 3.02) | |
| 15 Months | 1.73 (1.11 to 2.69) | |
| Proximal DVT or PE vs distal DVT | Baseline* | 1.84 (1.00 to 3.43) |
| 3 Months | 1.68 (0.91 to 3.10) | |
| 9 Months | 1.49 (0.79 to 2.81) | |
| 15 Months | 1.44 (0.76 to 2.72) | |
| d‐Dimer (per doubling) | Baseline* | 1.30 (1.07 to 1.58) |
| 3 Months | 1.27 (1.06 to 1.51) | |
| 9 Months | 1.20 (1.02 to 1.41) | |
| 15 Months | 1.13 (0.95 to 1.36) |
CI indicates confidence interval; DVT, deep vein thrombosis; PE, pulmonary embolism; SHR, subdistribution hazard ratio.
Three weeks after discontinuation of anticoagulation.
The effect of male sex on recurrence risk decreased over time. The risk of recurrence in patients with PE or proximal DVT was higher than in those with distal DVT from all time points or from all times and first decreased slightly over time, remained stable later but never reached the level of statistical significance. The association between d‐dimer levels and recurrence also showed a decrease over time.
To improve routine clinical application of our model, we adapted the model for recurrence prediction from any point between baseline and 15 months rather than from fixed (3 or 9 months) times. Furthermore, we calibrated the model by estimating and applying shrinkage (calibration) factors, using leave‐one‐out resampling, which were 0.830, 0.791, 0.817, and 0.705 for prediction from baseline, 3, 9, and 15 months, respectively. The formula and exact specification for the final dynamic prediction model, estimating the cumulative recurrence probability 60 months after the landmark time, can be found in the supplemental material. To facilitate application of this model in routine clinical care, a web‐based calculator is provided at http://www.meduniwien.ac.at/user/georg.heinze/dvpm/.
We also updated the nomogram that was presented in our previous publication. In contrast to the web‐based calculator, which allows prediction of recurrence from any points between baseline and 15 months, the nomogram can only be used to predict recurrence from specific times (baseline, 3, 9, and 15 months; Figures 2 through 5).
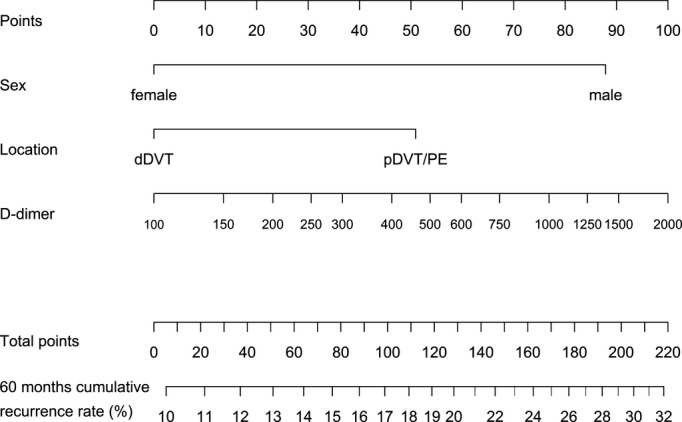
Figure 2.
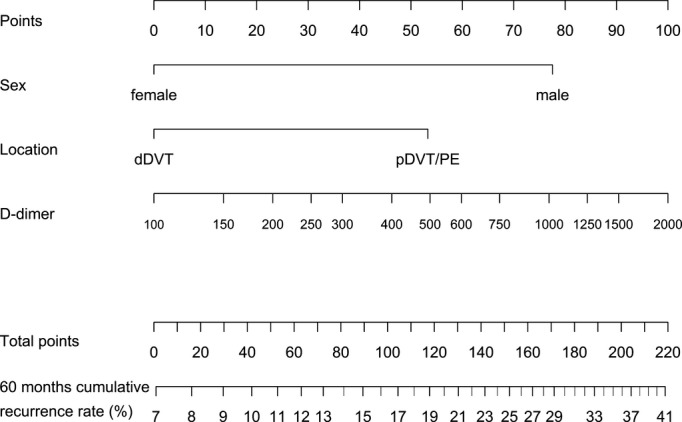
Nomogram to calculate the 60‐month cumulative recurrence rate from 3 weeks after end of anticoagulation (baseline) by use of sex, location of venous thromboembolism, and d‐dimer. How to use the nomogram: for each value of sex, location of venous thromboembolism, and d‐dimer, read the “points” at the very top of the nomogram. Add up the points assigned to each variable to obtain total points. Finally, map total points to expected cumulative proportion recurrence free at 60 months. dDVT indicates distal deep vein thrombosis; pDVT, proximal deep vein thrombosis; PE, pulmonary embolism.
Figure 5.
Nomogram to calculate the 60‐month cumulative recurrence rate from 15 months after end of anticoagulation. How to use the nomogram: refer to Figure 2. dDVT indicates distal deep vein thrombosis; pDVT, proximal deep vein thrombosis; PE, pulmonary embolism.
Figure 3.
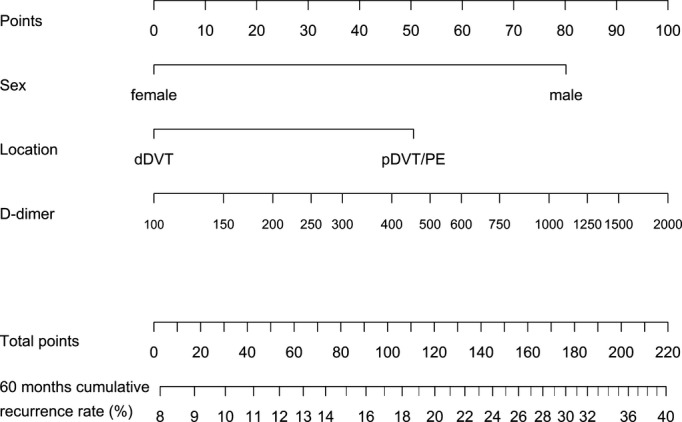
Nomogram to calculate the 60‐month cumulative recurrence rate from 3 months after end of anticoagulation. How to use the nomogram: refer to Figure 2. dDVT indicates distal deep vein thrombosis; pDVT, proximal deep vein thrombosis; PE, pulmonary embolism.
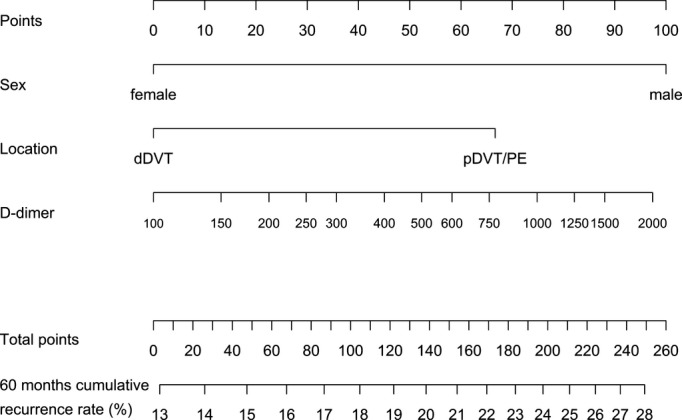
Figure 4.
Nomogram to calculate the 60‐month cumulative recurrence rate from 9 months after end of anticoagulation. How to use the nomogram: refer to Figure 2. dDVT indicates distal deep vein thrombosis; pDVT, proximal deep vein thrombosis; PE, pulmonary embolism.
Internal Validation of the Model
Using resampling techniques, we validated the predictions obtained from our model against the actually observed outcome. The area under the receiver operating characteristic curves (cross‐validated discrimination indices) for prediction of the cumulative recurrence risk after 5 years calculated from baseline, 3, 9, and 15 months were 0.63, 0.61, 0.61, and 0.58, respectively. Figure 6 demonstrates the good agreement of observed and cross‐validated predicted 60‐month cumulative recurrence rates, grouped by quartiles of the respective predicted cumulative recurrence rates. The miscalibration coefficients after shrinkage (deviation from a calibration slope of 1) for prediction from baseline, 3, 9, and 15 months were 0.036 (P=0.846), −0.029 (P=0.886), 0.030 (P=0.909) and 0.059 (P=0.857), respectively.
Figure 6.
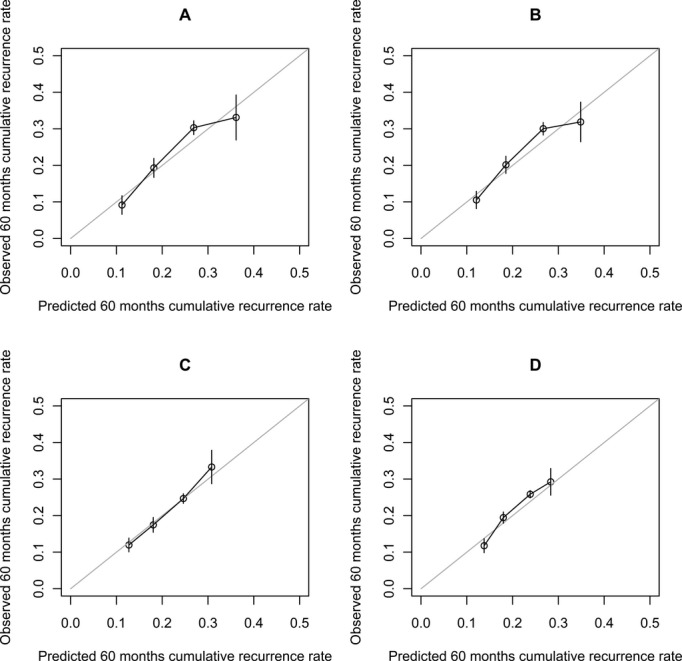
Calibration plots comparing observed and mean predicted cumulative recurrence rate at 60 months, obtained by leave‐one‐out cross‐validation. Vertical bars denote standard deviations. A, Prediction from baseline (3 weeks after end of therapy); B, 3 months; C, 9 months; D, 15 months.
Discussion
To better estimate the recurrence risk in patients with unprovoked VTE, prediction models that integrate clinical and laboratory risk factors have been developed. The rationale behind this approach is to more precisely discriminate between patients with a low and high recurrence risk to facilitate decision making regarding duration of anticoagulation. We recently presented the Vienna Prediction Model, which estimates the risk of recurrence from 3 weeks after discontinuation of anticoagulation based on the patient's sex, location of VTE, and d‐dimer measured at that specific time.14 A special feature of this model is that d‐dimer values are used as a continuous rather than a dichotomized variable. Data for this model come from the Austrian Study on Recurrent Venous Thromboembolism, which is a prospective observational study in patients with a first unprovoked VTE. The present analysis is an update as well as a further development of the original Vienna Prediction Model. First, in the updated version the longer observation time and the larger number of recurrent events improve the precision of the risk estimates. Second, by integrating patient's sex, location of VTE, and serial d‐dimer measurements after VTE, the risk of recurrence can now be assessed from any time between 3 weeks and 15 months after discontinuation of anticoagulation, rather than from only one, that is, 3 weeks after anticoagulation. Third, we generated nomograms that can be used to calculate individual risk scores and cumulative recurrence rates from 3 weeks, as well as from 3, 9, and 15 months after discontinuation of anticoagulation (Figures 2 through 5). For ease of use in routine care, we provide a web‐based calculator that allows risk assessment from any times between 3 weeks and 15 months after anticoagulation. Fourth, we applied a statistical methodology for the occurrence of “competing events” during follow‐up including start of antithrombotic therapy or death.17
The risk of recurrent VTE is low during anticoagulant treatment.5–7 Once anticoagulation is stopped, the recurrence risk increases depending on the number and strength of risk factors present in an individual patient.23 It is less evident but highly likely that the risk of recurrence fluctuates over time. Indeed, our study showed that the effect of both male sex and location of first VTE on the recurrence risk weakens over time, whereas the association with d‐dimer levels remains stable. Until now decisions on the duration of anticoagulation have been based on the risk assessment performed only once at a certain time (during or shortly after anticoagulation). This model, which allows prediction of risk recurrence from various later times, provides greater flexibility in counseling patients regarding their own recurrence risk and optimal anticoagulation.
d‐Dimer is an integral component of our prediction model. Complementing our previous model, d‐dimer levels were measured not only at baseline but repeatedly over 2 years after anticoagulation. Overall, d‐dimer levels did not substantially change during this observation period. Repeated d‐dimer measurements after stopping anticoagulation were also performed in an Italian study.24 In that study, patients who had abnormal d‐dimer levels both 3 months after discontinuation of anticoagulation and later had a higher risk of recurrence than patients in whom d‐dimer remained normal. Our analysis differs from that of Cosmi and colleagues as we evaluated the predictive value of d‐dimer on recurrence risk from various times after anticoagulation rather than the effect of d‐dimer fluctuations in an individual patient. Thus, a direct comparison between the 2 studies is not appropriate, but results can be seen as complementary.
Our prediction model differs from those presented by other investigators. The Canadian prediction rule includes obesity and signs and symptoms of postthrombotic syndrome and uses d‐dimer levels measured during anticoagulation.12 This model is predictive in women, but not in men. Tosetto and colleagues performed a patient‐level data analysis of 7 cohorts of patients with VTE.13 Oral contraceptive use conferred a lower risk of recurrence, and young rather than old age was a risk factor. Both models estimate the risk for recurrence from a single point either during12 or shortly after13 anticoagulation. In contrast to the aforementioned studies, we excluded women with VTE during female hormone intake, because of their low risk of recurrence. Age was found not to be predictive for recurrence in our model and thus was not integrated in the model.
Our study has some limitations that deserve further comment. Patients with a natural inhibitor deficiency, with a lupus anticoagulant, or who were double heterozygous or homozygous carriers of factor V Leiden or the prothrombin mutation were excluded, because they could be seen as candidates for extended or even indefinite anticoagulant treatment. We also excluded patients with VTE provoked by a transient risk factor, as their recurrence risk is low and extended anticoagulation is not justified. Therefore, our model cannot be applied to these patients. However, we did not exclude patients with distal DVT, because in this population recurrence rates as high as 25% after 6 years have been reported,25–26 and, thus, at least some patients with calf vein thrombosis may benefit from extended anticoagulation. Our model does not allow estimating the risk of recurrence between withdrawal of anticoagulants and 3 weeks as well as beyond 15 months. The model has undergone extensive internal validation. However, before widespread application in routine clinical care, external validation is needed to also evaluate its generalizability to other populations with different characteristics such as race or geographic location.
In conclusion, the updated Vienna Prediction Model integrates patient's sex, location of first VTE, and serial d‐dimer measurements and allows prediction of recurrent VTE from multiple random times after discontinuation of oral anticoagulation.
Sources of Funding
This study was supported by the Oesterreichische Nationalbank (Jubiläumsfonds) and the Medizinisch‐Wissenschaftlicher Fonds des Bürgermeisters der Bundeshauptstadt Wien. The sponsors had no role in the design and conduct of the study; in the collection, management, analysis, or interpretation of the data; or in the preparation, review, or approval of the manuscript.
Disclosures
None.
References
- 1.Kyrle PA, Rosendaal FR, Eichinger S. Risk assessment for recurrent venous thrombosis. Lancet. 2010; 376:2032-2039 [DOI] [PubMed] [Google Scholar]
- 2.Linkins LA, Choi PT, Douketis JD. Clinical impact of bleeding in patients taking oral anticoagulant therapy for venous thromboembolism. Ann Intern Med. 2003; 139:893-900 [DOI] [PubMed] [Google Scholar]
- 3.Fanikos J, Grasso‐Correnti N, Shah R, Kucher N, Goldhaber SZ. Major bleeding complications in a specialized anticoagulation service. Am J Cardiol. 2005; 96:595-598 [DOI] [PubMed] [Google Scholar]
- 4.Carrier M, Le Gal G, Wells PS, Rodger MA. Systematic review: case‐fatality rates of recurrent venous thromboembolism and major bleeding events among patients treated for venous thromboembolism. Ann Intern Med. 2010; 152:578-589 [DOI] [PubMed] [Google Scholar]
- 5.EINSTEIN Investigators Oral rivaroxaban for symptomatic venous thromboembolism. N Engl J Med. 2010; 363:2499-2510 [DOI] [PubMed] [Google Scholar]
- 6.Agnelli G, Buller HR, Cohen A, Curto M, Gallus AS, Johnson M, Porcari A, Raskob GE, Weitz JIAMPLIFY‐EXT Investigators Apixaban for extended treatment of venous thromboembolism. N Engl J Med. 2013; 368:699-708 [DOI] [PubMed] [Google Scholar]
- 7.Schulman S, Kearon C, Kakkar AJ, Schellong S, Eriksson H, Baanstra D, Kvamme AM, Friedman J, Mismetti P, Goldhaber SZRE‐MEDY and the RE‐SONATE Trials Investigators Extended use of dabigatran, warfarin, or placebo in venous thromboembolism. N Engl J Med. 2013; 368:709-718 [DOI] [PubMed] [Google Scholar]
- 8.MacLean S, Mulla S, Akl EA, Jankowski M, Vandvik PO, Ebrahim S, McLeod S, Bhatnagar N, Guyatt GH. Patient values and preferences for decision making in antithrombotic therapy: antithrombotic therapy and prevention of thrombosis, 9th ed: American College of Chest Physicians evidence‐based clinical practice guidelines. Chest. 2012; 141:e1S-e23S [DOI] [PMC free article] [PubMed] [Google Scholar]
- 9.Palareti G, Legnani C, Cosmi B, Guazzaloca G, Pancani C, Coccheri S. Risk of venous thromboembolism recurrence: high negative predictive value of d‐dimer performed after oral anticoagulation is stopped. Thromb Haemost. 2002; 87:7-12 [PubMed] [Google Scholar]
- 10.Eichinger S, Minar E, Bialonczyk C, Hirschl M, Quehenberger P, Schneider B, Weltermann A, Wagner O, Kyrle PA. d‐Dimer levels and risk of recurrent venous thromboembolism. JAMA. 2003; 290:1071-1074 [DOI] [PubMed] [Google Scholar]
- 11.Palareti G, Cosmi B, Legnani C, Tosetto A, Brusi C, Iorio A, Pengo V, Ghirarduzzi A, Pattacini C, Testa S, Lensing AW, Tripodi APROLONG Investigators d‐Dimer testing to determine the duration of anticoagulation therapy. N Engl J Med. 2006; 355:1780-1789 [DOI] [PubMed] [Google Scholar]
- 12.Rodger MA, Kahn SR, Wells PS, Anderson DA, Chagnon I, Le Gal G, Solymoss S, Crowther M, Perrier A, White R, Vickars L, Ramsay T, Betancourt MT, Kovacs MJ. Identifying unprovoked thromboembolism patients at low risk for recurrence who can discontinue anticoagulant therapy. CMAJ. 2008; 179:417-426 [DOI] [PMC free article] [PubMed] [Google Scholar]
- 13.Tosetto A, Iorio A, Marcucci M, Baglin T, Cushman M, Eichinger S, Palareti G, Poli D, Campbell Tait R, Douketis J. Predicting disease recurrence in patients with previous unprovoked venous thromboembolism. A proposed prediction score (DASH). J Thromb Haemost. 2012; 10:1019-1025 [DOI] [PubMed] [Google Scholar]
- 14.Eichinger S, Heinze G, Jandeck LM, Kyrle PA. Risk assessment of recurrence in patients with unprovoked deep vein thrombosis or pulmonary embolism: the Vienna Prediction Model. Circulation. 2010; 121:1630-1636 [DOI] [PubMed] [Google Scholar]
- 15.Kyrle PA, Minar E, Bialonczyk C, Hirschl M, Weltermann A, Eichinger S. The risk of recurrent venous thromboembolism in men and women. N Engl J Med. 2004; 350:2558-2563 [DOI] [PubMed] [Google Scholar]
- 16.van Houwelingen HC. Dynamic prediction by landmarking in event history analysis. Scand J Stat. 2007; 34:70-85 [Google Scholar]
- 17.Fine JP, Gray RJ. A proportional hazards model for the subdistribution of a competing risk. J Am Stat Assoc. 1999; 94:496-509 [Google Scholar]
- 18.Lin DY, Wei LJ. The robust inference for the Cox proportional hazards model. J Am Stat Assoc. 1989; 84:1074-1078 [Google Scholar]
- 19.Verweij PJM, Van Houwelingen JC. Cross‐validation in survival analysis. Stat Med. 1993; 12:2305-2314 [DOI] [PubMed] [Google Scholar]
- 20.Wolbers M, Koller MT, Witteman JC, Steyerberg EW. Prognostic models with competing risks: methods and application to coronary risk prediction. Epidemiology. 2009; 20:555-561 [DOI] [PubMed] [Google Scholar]
- 21.Kohl M, Plischke M, Leffondré K, Heinze G. PSHREG: A SAS macro for proportional and nonproportional subdistribution hazards regression. Submitted, 2013. Available at: http://cemsiis.meduniwien.ac.at/en/kb/science-research/software/statistical-software/pshreg Accessed June 30, 2013. [DOI] [PMC free article] [PubMed]
- 22.Kalbfleisch JD, Prentice RL. The Statistical Analysis of Failure Time Data. 1980New York: John Wiley and Sons [Google Scholar]
- 23.Boutitie F, Pinede L, Schulman S, Agnelli G, Raskob G, Julian J, Hirsh J, Kearon C. Influence of preceding length of anticoagulant treatment and initial presentation of venous thromboembolism on risk of recurrence after stopping treatment: analysis of individual participants' data from seven trials. BMJ. 2011; 342:d3036. [DOI] [PMC free article] [PubMed] [Google Scholar]
- 24.Cosmi B, Legnani C, Tosetto A, Pengo V, Ghirarduzzi A, Testa S, Prisco D, Poli D, Tripodi A, Marongiu F, Palareti GPROLONG Investigators Usefulness of repeated d‐dimer testing after stopping anticoagulation for a first episode of unprovoked venous thromboembolism: the PROLONG II prospective study. Blood. 2010; 115:481. [DOI] [PubMed] [Google Scholar]
- 25.Schulman S. The effect of the duration of anticoagulation and other risk factors on the recurrence of venous thromboembolisms. Duration of Anticoagulation Study Group. Wien Med Wochenschr. 1999; 149:66-69 [PubMed] [Google Scholar]
- 26.Baglin T, Douketis J, Tosetto A, Marcucci M, Cushman M, Kyrle P, Palareti G, Poli D, Tait RC, Iorio A. Does the clinical presentation and extent of venous thrombosis predict likelihood and type of recurrence? A patient‐level meta‐analysis. J Thromb Haemost. 2010; 8:2436-2442 [DOI] [PubMed] [Google Scholar]