Abstract
Rationale
Funding decisions for cardiovascular R01 grant applications at NHLBI largely hinge on percentile rankings. It is not known whether this approach enables the highest impact science.
Objective
To conduct an observational analysis of percentile rankings and bibliometric outcomes for a contemporary set of funded NHLBI cardiovascular R01 grants.
Methods and results
We identified 1492 investigator-initiated de novo R01 grant applications that were funded between 2001 and 2008, and followed their progress for linked publications and citations to those publications. Our co-primary endpoints were citations received per million dollars of funding, citations obtained within 2-years of publication, and 2-year citations for each grant’s maximally cited paper. In 7654 grant-years of funding that generated $3004 million of total NIH awards, the portfolio yielded 16,793 publications that appeared between 2001 and 2012 (median per grant 8, 25th and 75th percentiles 4 and 14, range 0 – 123), which received 2,224,255 citations (median per grant 1048, 25th and 75th percentiles 492 and 1,932, range 0 – 16,295). We found no association between percentile ranking and citation metrics; the absence of association persisted even after accounting for calendar time, grant duration, number of grants acknowledged per paper, number of authors per paper, early investigator status, human versus non-human focus, and institutional funding. An exploratory machine-learning analysis suggested that grants with the very best percentile rankings did yield more maximally cited papers.
Conclusions
In a large cohort of NHLBI-funded cardiovascular R01 grants, we were unable to find a monotonic association between better percentile ranking and higher scientific impact as assessed by citation metrics.
Keywords: Research funding, bibliometrics, scientific impact, NHLBI
Introduction
The National Heart Lung and Blood Institute (NHLBI) looks to peer-review to guide its funding decisions for investigator-initiated R01 grants, which make up the largest single component of our extramural portfolio.1 For the most part, successful applications are those that fall below a “percentile ranking” value of peer-review priority scores; the cut-off percentile ranking value, or “payline,” is determined by budgetary considerations. Despite longstanding tradition and affirmations, many question the ability of peer review, as it is currently practiced, to identify those research proposals most likely to have high impact, whether it is impact on scientific thought, clinical practice, or public policy.2–5 While prior reports have questioned the internal consistency and validity of peer review5, there is little data regarding the association, if any, with post-award scientific achievement.4 We therefore conducted an observational analysis of percentile rankings and bibliometric outcomes for a contemporary set of funded NHLBI cardiovascular R01 grants.
Methods
Study Sample
We considered all de novo investigator-initiated R01 grants that met the following inclusion criteria: 1) award on or after January 1, 2001 and before September 1, 2008, 2) duration of the funding of at least 2 years, 3) assignment to a cardiovascular unit within NHLBI, and 4) receipt of a percentile ranking based on a priority score given by a National Institutes of Health (NIH) peer review study section.
Data Collection
We obtained grant-specific award and funding data from an internal NHLBI Tracking and Budget System, which includes information on investigator status (early-stage or established), grantee institution, identity of peer review study section, percentile ranking, project start and end dates, involvement of human subjects, and total funding (including direct and indirect costs).
Outcomes
We utilized the NIH’s electronic scientific portfolio assistant (eSPA) to generate lists of grant-associated publications, along with publication-specific data on publication type (research or other), total citations, and citations received within 2 years of publication. Our common censor date was September 23, 2012. Our co-primary outcome measures were the number of total citations received per million dollars of NIH funding, number of citations received within 2 years, and number of citations received within 2 years for each grant’s most highly cited paper (that is, the one paper per grant that received the most number of 2-year citations). We also calculated each grants h-index (and h-index for two-year citations), where a grant has an index of h if it includes h papers that have been cited at least h times and none of the grant’s other papers have received more than h citations.6 The eSPA system maps publications to specific grants with the Scientific Publication Information Retrieval and Evaluation System (at http://era.nih.gov/nih_and_grantor_agencies/other/spires.cfm) and citation data from ISI Web of Science.
Since many publications were supported by more than one grant, we adjusted counts for publication and citations by dividing by the number of cited grants. Thus, if a paper cited three grants and garnered 30 citations, each individual grant would be credited with 1/3 of a publication (0.3333…) and with 10 citations. We also performed a supplementary analysis focusing on papers that acknowledged only one grant.
For descriptive purposes only, we obtained aggregate data on journals in which publications appeared and on their Medical Subject Heading (MeSH) terms using PubMed PubReminer (available at http://hgserver2.amc.nl/cgi-bin/miner/miner2.cgi).
Statistical Analyses
For descriptive purposes, we present baseline characteristics of grants with numbers and percents for categorical variables and mean ± standard errors for continuous variables, stratified by three percentile ranking categories, 0–10%, 10–20% and 20–30%. We also described unadjusted citation statistics by generating a Pareto plot, which shows the sum of total citations received within citation deciles; a classic Pareto plot enables one to demonstrate, for example, that 20% of inputs (e.g. employees) generate 80% of outputs (e.g. productivity). To describe the association of bibliometric outcomes allocated with percentile rankings, we computed and plotted nonparametric LOESS estimates. We performed multivariable linear regression analyses to account for associations with study type (human subjects or not), grant duration, early-stage investigator status, calendar year of first award, average number of grants acknowledged per paper, average number of authors per paper, average annual funding (in $million per year), and total institutional funding within the portfolio of all grants included in the study sample. Since both publications and citations per million dollars allocated have right skewed distributions, we performed natural logarithmic transformations of (Publications/$Million +1) and (Citations/$Million +1), and performed goodness-of-fit tests for linear models using the nonparametric analysis of deviance (ANODEV) F-tests.7
To further evaluate the independent association of percentile ranking with bibliometric outcomes, we constructed Breiman random forests, which are machine-learning based constructs that allow for robust, un-biased assessments of complex associations. As described previously, we assessed relative variable importance based on a “variable importance ” value that reflected gain of discrimination by adding a variable, as well as by average minimal depth (where 1 is best and higher values suggest lesser importance).8 Statistical analyses were conducted using the SAS 9.2 (SAS Institute Inc.), the Spotfire S+ and the R statistical software packages. We used the “qcc” package to graphically present the distribution of citations and the randomforestSRC package to construct random forests. We will make available copies of the analysis data sets to interested investigators upon request.
Results
Baseline Characteristics
There were 1492 cardiovascular R01 grants that met our inclusion and exclusion criteria. Table 1 summarizes the baseline characteristics of these grants in the sample stratified by the percentile ranking categories of ≤10.0%, 10.1% to 20.0%, and >20.0%. Grants with lower percentile rankings had higher funding levels and longer durations.
Table 1.
Characteristics and bibliometric outcomes of the 1492 cardiovascular R01 grants that met inclusion and exclusion criteria. Values shown are percents (numbers) or 25th/50th/75th quantiles as appropriate.
| Percentile ranking | <10.0% | 10.0 – 19.9% | 20.0 – 41.8% | P-value |
|---|---|---|---|---|
| Number of grants | 487 | 574 | 431 | -- |
| Percentile | 3.2/ 5.7/ 7.7 | 12.3/14.5/17.1 | 22.0/24.7/28.0 | <0.001 |
| New investigator | 29% (139) | 27% (159) | 34% (144) | 0.34 |
| Human studies | 34% (168) | 31% (180) | 37% (160) | 0.16 |
| Costs ($million) | 1.5/1.8/2.8 | 1.3/1.6/2.5 | 1.2/1.5/2.6 | <0.001 |
| Duration (years) | 4.0/5.0/5.0 | 4.0/4.0/5.0 | 3.9/4.0/5.0 | <0.001 |
| Annual costs ($million/year) | 0.32/0.37/0.44 | 0.31/0.36/0.43 | 0.29/0.35/0.41 | <0.001 |
| Institutional funding in portfolio ($million) | 15/30/45 | 13/29/44 | 12/27/41 | 0.052 |
| Bibliometric measures | ||||
| Number of publications | 5680 | 6134 | 4979 | -- |
| Average authors per paper | 4.7/5.8/7.2 | 4.7/5.6/7.0 | 4.5/5.6/7.0 | 0.27 |
| Average grants acknowledged per paper | 1.9/2.5/3.4 | 1.8/2.4/3.3 | 1.8/2.4/3.1 | 0.064 |
| Bibliometric outcomes for each grant | Adjusted P-value* | |||
| Number of publications | 4.0/ 8.0/14.5 | 4.0/ 8.0/14.0 | 4.0/ 8.5/14.8 | 0.84 |
| Number of research publications | 4.0/ 7.0/12.0 | 3.5/ 6.8/12.0 | 3.5/ 7.0/12.0 | 0.87 |
| Citations to all papers | 484/1059/1874 | 443/ 958/1829 | 552/1182/2130 | 0.61 |
| Citations per $million spent | 231/ 537/1003 | 252/ 573/ 981 | 289/ 736/1301 | 0.87 |
| Citations within 2 years of publication | 16/41/98 | 13/35/77 | 15/38/91 | 0.22 |
| Citations within 2 years to paper with most 2-year citations | 7/14/25 | 6/12/21 | 6/13/20 | 0.13 |
| H-index | 3/6/11 | 3/6/11 | 3/7/12 | 0.88 |
| H-index (based on citations within 2 years of publication) | 2/3/6 | 2/3/5 | 2/3/6 | 0.48 |
Adjusted P-values based on linear additive models that account for average annual funding (except for the model for citations per $million spent), project duration, calendar year of initial award, inclusion of human subjects, new investigator status for principle investigator, total within-portfolio institutional funding, average number of authors per paper, and average number of grants acknowledged per paper.
Academic Productivity
In 7654 grant-years of funding that generated $3004 million of total NIH awards, the portfolio of 1492 grants yielded 16,793 publications (median per grant 8, 25th and 75th percentiles 4 and 14, range 0 – 123), which received in total 2,224,255 citations (median per grant 1048, 25th and 75th percentiles 492 and 1,932, range 0 – 16,295) and within 2 year of publication 109,305 citations (median per grant 38, 25th and 75th percentiles 15 and 87, range 0 – 1302). The median grant h-index was 6 (25th and 75th percentiles 3 and 11, range 0 – 72) when the median h-index for 2-year citations was 3 (25th and 75th percentiles 2 and 5, range 0 – 22).
Table 2 presents the most common journals in which publications appeared and the publications’ most common MeSH terms. The five most popular journals were the American Journal of Physiology (Heart and Circulatory Physiology), the Journal of Biological Chemistry, Circulation, Circulation Research, and Hypertension. The ten most common MeSH terms were animals, humans, male, female, mice, rats, middle-aged, cells (cultured), signal transduction, and myocardium.
Table 2.
Most commonly used journals (along with other journals of interest) in which the 1492 investigator-initiated R01 grants of the study sample were cited; most common MeSH terms for papers in which the 1492 grants were cited. Data are presented for descriptive purposes only.
| Journal (number) | MeSH term (number) |
|---|---|
| Most commonly used journals: Am J Physiol Heart Circ Physiol (955) J Biol Chem (649) Circulation (611) Circulation Research (508) Hypertension (303) J Mol Cell Cardiol (295) Proc Nat Acad Sci (252) Arterioscler Thromb Vasc Biol (235) Am J Physiol Regul Integr Comp Physiol (192) Cardiovasc Res (181) Other journals of interest: JAMA (50) Nature (21) N Engl J Med (21) Cell (21) Lancet (19) Science (17) |
Animals (9637) Humans (8095) Male (5454) Female (4007) Mice (3558) Rats (2854) Middle Aged (1940) Cells, Cultured (1805) Signal Transduction (1553) Myocardium (1458) Adult (1429) Aged (1359) Myocytes, Cardiac (1158) Blood pressure (1129) Mice, Knockout (1121) Disease Models, Animal (1121) Time Factors (1117) Mice, Inbred C57BL (1104) |
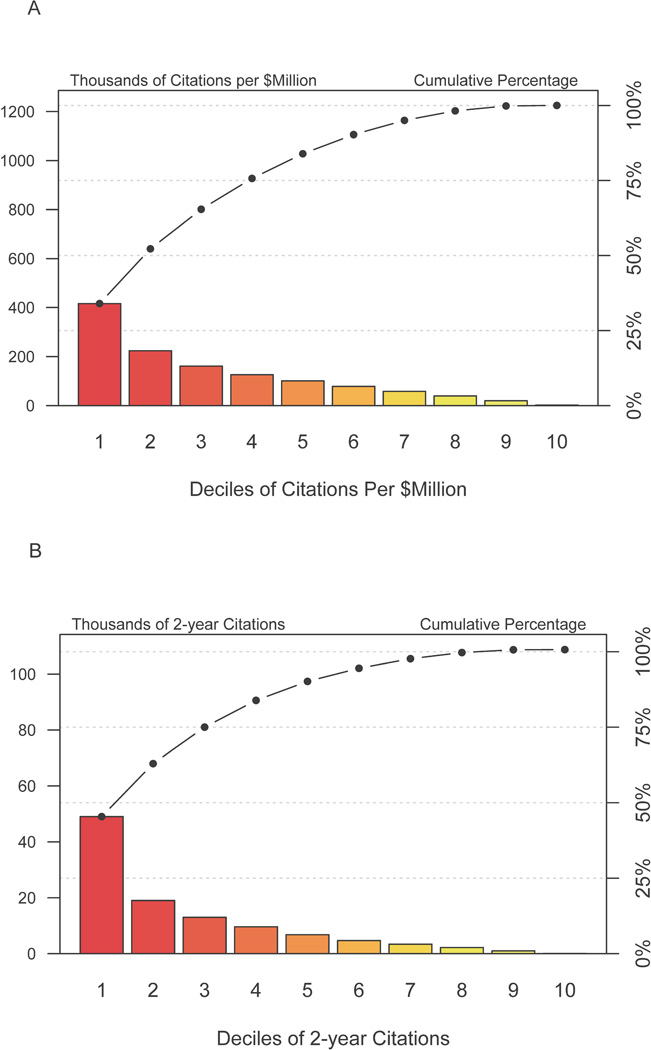
The median number of publications per million dollars allocated was 4.6 (25th and 75th percentiles 2.4 and 7.9, range 0 – 55). The median number of citations per million dollars allocated was 600 (25th and 75th percentiles 259 and 1072, range 0 – 7269). The number of citations received per million dollars allocated followed an attenuated Pareto distribution; as shown in Figure 1A, the 40% most productive grants generated 76% of productivity, while the 40% least productive grants generated only 5%. Similarly, the number of citations received within 2 years of publication followed a Pareto distribution; as shown in Figure 1B, the 40% most productive grants generated 83% of productivity, while the 40% least productive grants generated only 3%.
Figure 1.
Pareto plot of citations per grant for 1492 grants that met inclusion and exclusion criteria. The X-axis divides the grants into deciles according to the number of total citations that each grant’s papers received. The red bars shows the number of citations received within each decile of grants, while the line graph shows cumulative values going from the best to worst producing deciles of grants. The top 3 deciles (e.g. the 30% most productive grants) generated 76% of the total citations.
Publications and Citations According to Percentile Ranking
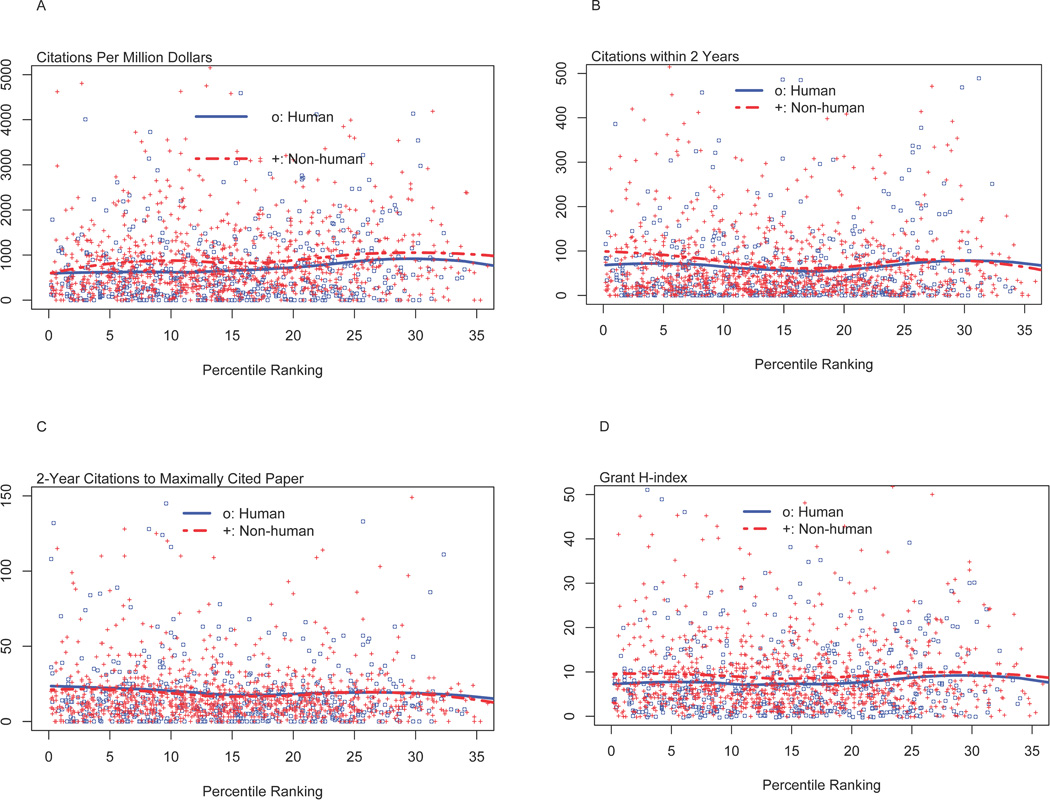
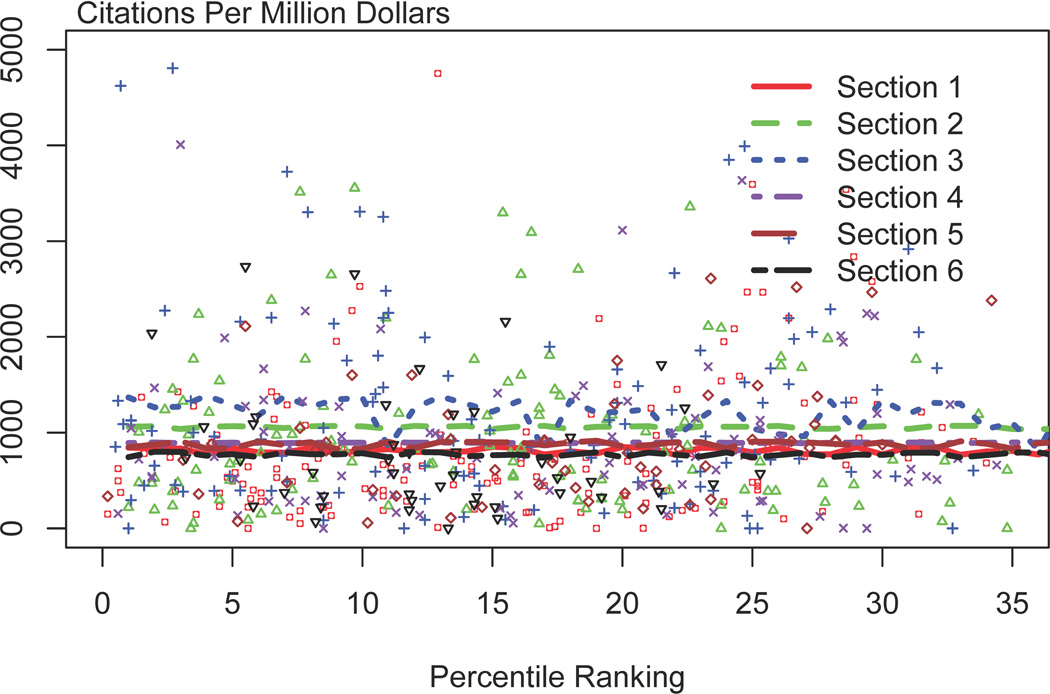
There were no associations between percentile ranking and any of the publication and citation metrics we considered (bottom of Table 1). Figure 2A presents grant-specific data of citations per million dollars allocated according to percentile ranking and grant type (human vs. non-human); Figures 2B, 2C, and 2D show corresponding data for 2-year citations, 2-year citations for maximally cited papers, and grant h-index. Figure 3 shows data specific for the 6 study sections that reviewed the most number of funded grants; again even within each study section there was no association between percentile ranking and citations received per million dollars allocated.
Figure 2.
Bibliometric outcomes according to percentile ranking for 1492 R01 grants that met inclusion and exclusion criteria. All plots show values stratified by human or non-human study focus; curves were generated by LOESS fitting. Panel A shows data for citations received per $million allocated. Panel B shows data for 2-year citations. Panel C shows data for 2-year citations for each grant’s most highly cited paper (i.e., for each grant we identified which paper generated the most 2-year citations, and plot the number of citations generated by that paper according to percentile ranking). Panel D shows data for each grant’s h-index.
Figure 3.
Citations per million dollars allocated according to percentile ranking stratified by the six study sections that reviewed the highest number of funded grants. Curves were generated by LOESS fitting.
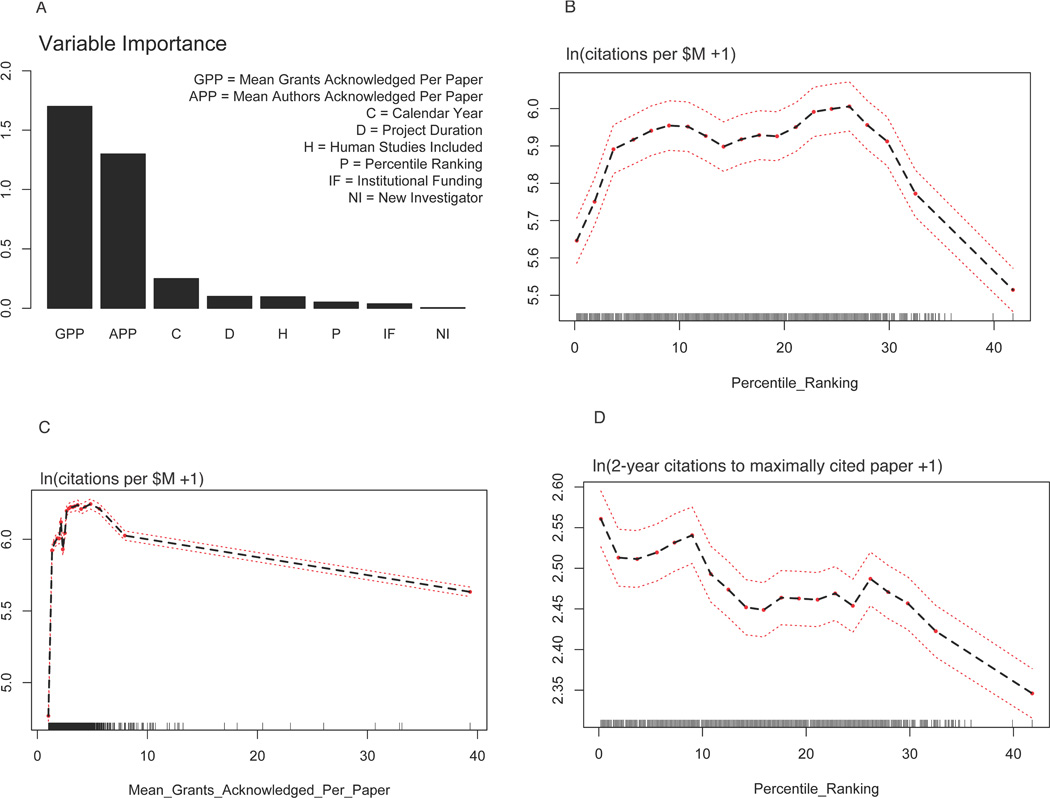
In a machine-learning Breiman random forest model which accounted for the same covariates listed in Table 1, the strongest predictor by far of citations per million dollars allocated was average number of grants acknowledged per paper, while percentile ranking was a much weaker predictor (Figure 4A). There was no clear monotonic association between percentile ranking and citations per million dollars allocated (Figure 4B). The association between average number of grants acknowledged per paper and citations per million dollars allocated followed an inverse-V association, with a peak about approximately 3 to 4 grants (Figure 4C). There was a weak association between percentile ranking and 2-year citations for any given grant’s most highly cited paper, with 2-year citation rates highest for those grants with a percentile ranking < 10 (Figure 4D).
Figure 4.
Random forest findings. Panel A shows the relative importance of candidate variables for prediction of citations per $million allocated. The y-axis value corresponds to change in model discrimination by addition of that variable. Hence, mean number of grants acknowledged per paper is the strongest predictor, while percentile ranking is much weaker. Panel B shows the association between citations per $million (after logarithmic transformation) and percentile ranking after accounting for all other variables in the X axis of Panel A. Panel C shows corresponding values citations per $million and mean number of grants acknowledged per paper. Panel D shows in a different model the association between 2-year citations for each grant’s most highly cited paper and percentile ranking after accounting for all other variables in the X axis of Panel A plus average annual funding. In this model, the mean number of grants acknowledged per paper was again the strongest predictor, while percentile ranking was much weaker.
Papers that Acknowledged Only One Grant
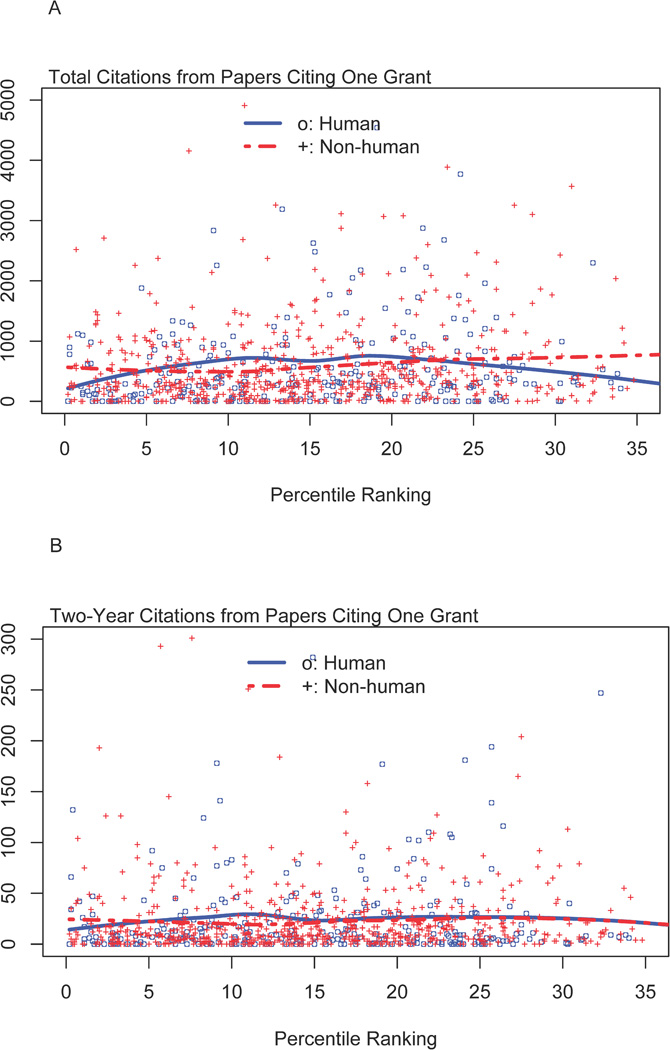
In a supplementary analysis, we identified 927 R01 grants that produced at least one paper that acknowledged only one grant. The 4122 single-grant papers (representing 25% of all papers) received 548,024 citations, of which 21,615 occurred within 2 years of publication. In unadjusted analyses, there was no association between percentile ranking and total number of citations received (Figure 5A) or citations received within 2 years (Figure 5B). After accounting for covariates, there was no association between percentile ranking and total citations (adjusted P=0.40) or citations received within 2 years (adjusted P=0.59).
Figure 5.
Bibliometric outcomes according to percentile ranking for 927 R01 grants that generated at least one paper that acknowledged only one grant. Panel A shows total citations. Panel B shows 2-year citations.
Discussion
We analyzed the bibliometric outcomes of 1492 cardiovascular R01 grants that received initial funding between 2001 and 2008 according to peer review percentile ranking. We found no clear association between percentile ranking and outcomes: as percentile ranking decreased (meaning a “better score”) we did not observe a corresponding monotonic increase in publications produced or citations received per million dollars spent. The absence of association persisted even after accounting for selected confounders, for consideration of “human versus non-human” research, and for actions taken by specific high-volume study sections.
In an exploratory machine-learning analysis, we found an intriguing, though admittedly weak, pattern whereby those grants scoring in the 10th percentile or better generated more 2-year citations for maximally cited papers. This pattern suggests that peer review may identify grants that generate “home runs,” that is, individual papers that have unusually high impact. Given that scientific discovery is inherently “heavy-tailed,”9 our observation is worthy of further exploration in other grant cohorts. Our observation may also be particularly relevant at this time, when we are no longer living in a more generous funding climate.
Our findings are consistent with previous impressions that peer review assessments of grant applications are relatively crude predictors of subsequent productivity.2, 4, 5, 10, 11 Critics have argued that the current approach to selecting proposals for funding has no evidence base.10, 11 Some empirical work suggests that selection mechanisms that focus on researcher track records, instead of peer-review assessments of project proposals, may better predict subsequent high-impact publications and willingness to consider innovative ideas.12
If percentile ranking does not predict scientific outcome, there is a rationale for considering other approaches to evaluating proposals and choosing which ones to fund. Kaplan suggested that the study section committee structure inherently discriminates against innovative projects and has identified alternate peer-review methods, methods that range from “appointing prescient individuals” to highly inclusive web-based crowd sourcing.2 Ioannidis identifies six possible alternate options for choosing projects to fund: egalitarian (fund all but at low amounts), aleatoric (fund at random, an approach being used by some sponsors), career assessment, automated impact indices, scientific citizenship, and projects with broad goals.10 He and others acknowledge that we don’t know which approach (if any) is best, and therefore funding agencies like NIH should consider conducting randomized trials.13 The National Cancer Institute recently modified its approach to funding decisions, restricting automatic funding to those grants with percentile rankings of 7 or better, while staff scientists undertake initial review to decide which additional grants to fund. Our machine learning exploratory analyses (Figure 4D) might offer support: “automatically” fund those with top-notch percentile rankings, while taking a more deliberative approach for all others.
There are important limitations to our analyses. There is no clear “gold standard” for measuring research success or impact. We focused on number of citations, and specifically citations according to funding, as our primary endpoint, an endpoint consonant with those used by others interested in measuring scientific productivity.14 Citations represent a measure of interest on the part of the scientific community; recent work is focusing on newer web-based, arguably more sensitive measures of impact. Work on rare diseases may attract interest from a smaller community, yet still be of substantial scientific value. We deliberately chose not to analyze outcomes according to journal impact factor, as some recently singled out this practice for intense criticism.15 The journal Nature, a journal with one of the highest impact factors in biomedical science, has argued against the use of impact factor for describing the impact of individual papers, noting that only a small proportion of its papers yield the vast majority of its citations.16 Recently, the Editor-in-Chief of Science, another journal with a high impact factor, critiqued the “misuse” as “never intended to be used to evaluate individual scientists.”17 Our analyses focused only on funded R01 cardiovascular grant applications, but even so covered a diversity of projects, scientists, and scientific institutions. There were a number of confounders we did not consider, like detailed pre-application metrics of principle investigators.
Finally, we did not compare productivity of scientists who successfully secured funding as compared to others who did not; such an analysis would be beyond the scope of our study. One prior report from the National Bureau of Economic Research suggested a moderate impact of R01 funding on scientific productivity.18 Nonetheless, as we were only able to analyze outcomes for those grants that scored within a relatively narrow, and positively received range, our findings are consistent with an argument that NIH funding levels are inadequate to support all potentially fundable high-quality work.
Despite these limitations, we noted a striking lack of association between percentile ranking and bibliometric outcomes in a large cohort of cardiovascular R01 grants. Our findings offer justification for further research and consideration into innovative approaches for evaluating research proposal and for selecting projects for funding.
Supplementary Material
Acknowledgements
We are grateful to Dr. Frank Evans for his invaluable assistance in assembling the analysis data set. We also wish to thank the anonymous peer reviewers for their constructive comments and suggestions, and in particular for their queries on how to handle papers that acknowledge support from multiple grants and on the possibility of calculating grant-specific h-indices.
Funding: All authors were full-time employees of NHLBI at the time they worked on this project.
Non-standard abbreviations and acronyms
- ANODEV
analysis of deviance
- eSPA
electronic scientific portfolio assistant
- MeSH
medical subject heading
- LOESS
locally weighted scatterplot smoothing
- NHLBI
National Heart, Lung, and Blood Institute
Footnotes
Disclaimer: The views expressed in this paper are those of the authors and do not necessarily represent those of the NHLBI, the National Institutes of Health, or the US Department of Health and Human Services
Disclosures: None
References
- 1.Galis ZS, Hoots WK, Kiley JP, Lauer MS. On the value of portfolio diversity in heart, lung, and blood research. Circ Res. 2012;111:833–836. doi: 10.1161/CIRCRESAHA.112.279596. [DOI] [PubMed] [Google Scholar]
- 2.Kaplan D. Social choice at NIH: the principle of complementarity. FASEB J. 2011;25:3763–3764. doi: 10.1096/fj.11-191015. [DOI] [PubMed] [Google Scholar]
- 3.Mayo NE, Brophy J, Goldberg MS, Klein MB, Miller S, Platt RW, Ritchie J. Peering at peer review revealed high degree of chance associated with funding of grant applications. J Clin Epidemiol. 2006;59:842–848. doi: 10.1016/j.jclinepi.2005.12.007. [DOI] [PubMed] [Google Scholar]
- 4.Demicheli V, Di Pietrantonj C. Peer review for improving the quality of grant applications. Cochrane Database Syst Rev. 2007 doi: 10.1002/14651858.MR000003.pub2. MR000003. [DOI] [PMC free article] [PubMed] [Google Scholar]
- 5.Graves N, Barnett AG, Clarke P. Funding grant proposals for scientific research: retrospective analysis of scores by members of grant review panel. BMJ. 2011;343:d4797. doi: 10.1136/bmj.d4797. [DOI] [PMC free article] [PubMed] [Google Scholar]
- 6.Hirsch JE. An index to quantify an individual's scientific research output. PNAS. 2005;102:16569–16572. doi: 10.1073/pnas.0507655102. [DOI] [PMC free article] [PubMed] [Google Scholar]
- 7.Hastie T, Tibshirani R. Generalized additive models. London ; New York: Chapman and Hall; 1990. [DOI] [PubMed] [Google Scholar]
- 8.Ishwaran H, Kogalur UB, Gorodeski EZ, Minn AJ, Lauer MS. High-dimensional variable selection for survival data. J Am Stat Assoc. 2010;105:205–217. [Google Scholar]
- 9.Press WH. Presidential address. What's so special about science (and how much should we spend on it?) Science. 2013;342:817–822. doi: 10.1126/science.342.6160.817. [DOI] [PubMed] [Google Scholar]
- 10.Ioannidis JP. More time for research: fund people not projects. Nature. 2011;477:529–531. doi: 10.1038/477529a. [DOI] [PubMed] [Google Scholar]
- 11.Langer JS. Enabling scientific innovation. Science. 2012;338:171. doi: 10.1126/science.1230947. [DOI] [PubMed] [Google Scholar]
- 12.Azoulay P, Graff Zivin JS, Manso G. Incentives and Creativity: Evidence from the Academic Life Sciences. RAND Journal of Economics. 2011;42:527–554. [Google Scholar]
- 13.Dizikes P. How to encourage big ideas. [accessed on September 1, 2013];MITnews. 2009 (available at http://web.mit.edu/newsoffice/2009/creative-research-1209.html)
- 14.Fortin JM, Currie DJ. Big Science vs. Little Science: How Scientific Impact Scales with Funding. PLoS One. 2013;8:e65263. doi: 10.1371/journal.pone.0065263. [DOI] [PMC free article] [PubMed] [Google Scholar]
- 15.Balaban RS. Evaluation of scientific productivity and excellence in the NHLBI Division of Intramural Research. J Gen Physiol. 2013;142:177–178. doi: 10.1085/jgp.201311076. [DOI] [PMC free article] [PubMed] [Google Scholar]
- 16.Not-so-deep impact. Nature. 2005;435:1003–1004. doi: 10.1038/4351003b. [DOI] [PubMed] [Google Scholar]
- 17.Alberts B. Impact Factor Distortions. Science. 2013;340:787. doi: 10.1126/science.1240319. [DOI] [PubMed] [Google Scholar]
- 18.Jacob BA, Lefgren L. The impact of research grant funding on scientific productivity. J Pub Econ. 2011;95:1168–1177. doi: 10.1016/j.jpubeco.2011.05.005. [DOI] [PMC free article] [PubMed] [Google Scholar]
Associated Data
This section collects any data citations, data availability statements, or supplementary materials included in this article.


