Abstract
To be able to detect carbon dioxide (CO2) with high accuracy and fast response time is critical for many health and environmental applications. We report on a pocket-sized CO2 sensor for real-time analysis of end-tidal CO2, and environmental CO2. The sensor shows fast and reversible response to CO2 over a wide concentration range, covering the needs of both environmental and health applications. It is also immune to the presence of various interfering gases in ambient or expired air. Furthermore, the sensor has been used for real-time breath analysis, and the results are in good agreement with those from a commercial CO2 detector.
Keywords: carbon dioxide environmental analysis, breath-by-breath analysis, colorimetric sensor, end-tidal CO2, capnography, respiratory diseases
1. INTRODUCTION
A capability that can detect carbon dioxide (CO2) with high accuracy and with fast response time is critical for many health and environmental applications [1–15]. For example, measuring CO2 levels in breath at the end of expiration, known as end-tidal CO2 (EtCO2), allows for non-invasive evaluation of systemic metabolism, perfusion, ventilation, and cardiac output, which provides doctors and patients with a non-invasive method to diagnose asthma, Chronic Obstructive Pulmonary Disease (COPD), and cardiovascular diseases [5, 6]. Similarly, monitoring of indoor CO2 levels allows for assessment of indoor air quality (IAQ). Higher levels of indoor CO2 are associated with increased prevalence of certain mucous membrane and sick building syndrome (SBS) symptoms [15]. Infrared detection technology is currently utilized for measuring CO2 in breath and in air. While useful, this technology experiences strong interference from humidity that is present both in breath and in air. Moreover, the infrared approach requires special sample pretreatments in order to reduce the humidity, which further adds to the cost of the device technology and limits its usefulness for applications in clinical settings. In the case of indoor environmental CO2 sensing, the use of infrared technology is hampered by the interference of environmental humidity making detection of CO2 levels inaccurate. There is a need, therefore, for developing a compact, low-cost, easy-to-use, and accurate CO2 sensor for tracking CO2 in human breath and for monitoring indoor air quality [16 – 17].
An alternative to infrared sensing is a detecting method based on colorimetry, which identifies CO2 based on the change of color of a pH-sensitive indicator [18 – 23]. Compared to the infrared CO2 sensors, the colorimetric approach has several potential advantages, including simplicity, miniaturization, low cost, and immunity to humidity changes, thereby making colorometric sensors an attractive technology. While these sensors may show great promise, their response and recovery time are too slow for breath-by-breath analysis, and their detection limits and reversibility are insufficient to ensure accurate detection of CO2 in the environment. In order to solve these problems, many attempts, including pre-treatment of the sensing materials have been undertaken to reduce cost and ensure high performance of colorimetric CO2 sensors. These improvement activities, however, often result in more complex instruments and sensor preparation methods.
In a previous publication, we introduced a portable breath analyzer for the determination of the expired CO2. The device features a colorimetric sensor that could analyze breath CO2 concentration accurately, and a fluidic system for efficient delivery of breath sample to the sensing element. A 3D model was created to simulate the sample flow and reaction of CO2 with the sensing materials and color changes associated with the chemical reactions [24]. Despite the success, the sensor response was slow and semi-reversible, which is not suitable for breath-by-breath CO2 analysis as needed for capnography, and moreover, which is insensitive to real-time monitoring of CO2 in air. In the present work, we report a CO2 sensor with a response time as fast as ~0.1 sec., which enables breath-by-breath analysis (see more details in Experimental and Results Section). Additionally, the sensor has a wide dynamic range (with the CO2 concentration up to 11.5%), and low detection limit of a few tens of ppm, which are suitable for indoor air quality monitoring.
2. EXPERIMENTAL
2.1. Reagents and sensor preparation
The colorimetric CO2 sensor presented in this paper was prepared by coating a sensor chip with a solution containing HCO3−/CO32− buffer and m-cresol purple as the sensing element [19, 24]. All the reagents used in this work were analytical grade and purchased from Sigma-Aldrich (St. Louis, MO, USA). As described in our previous work, when an ambient air sample or warm breath sample was brought into contact with the sensor chip, the pH of the sensing material decreased, which led to a color change [24]. This color change was detected with an optoelectronic detection system (see details below).
Note that several differences are stayed in the present work with respect to previous work [24]. Regarding the sensor: a- The sensor substrate uses a fluorinated hydrophobic membrane instead of transparent polyethylene-based plastic; b- The hydrophobic membrane has microstructures and surface properties that provide faster water desorption and significantly improved sensor time response; c- The new indicator, m-cresol purple, provides a wider dynamic range of CO2 % concentration due to its lower pka. Compared with thymol blue [24], m-cresol purple changes color more sensitively under weakly alkaline to neutral conditions (pH value: 9.0 – 6.0), which typically corresponds to the range of normal breath CO2 levels (1.0% – 11.5%) [25 – 27] (Fig. 1).
Figure 1.
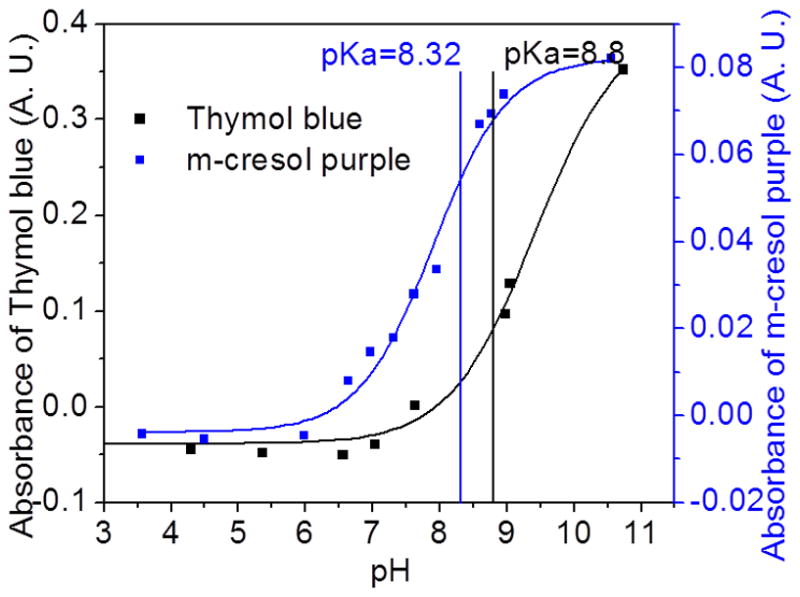
Titration curves for the HCO3−/CO32− buffer system modified with thymol blue and m-cresol purple. The color changes in the CO2 sensor were due to the pKa value (for thymol blue: color changes from blue (pH > pKa) to yellow (pH < pKa); for m-cresol purple: color changes from purple (pH > pKa) to yellow (pH < pKa)). Compared with thymol blue, m-cresol purple changes color more sensitively under neutral to weakly alkaline conditions, which provides a larger dynamic range for the breath CO2 detection.
Regarding the device: a- For breath applications, the gas flow is designed that both exhalation of breath samples, as well as inhalation of clean air are enabled through the device. The later enables in-situ sensor regeneration; b- The device’s gas flow component has larger diameter (~20 mm) than the device published in Ref. 24 (few mm), which significantly reduces the resistance to breathing, enabling breath-by-breath analysis.
2.2. Device description
The CO2 sensor chip was inserted into a detection chamber, which included an optoelectronic detection system consisting of a red LED (wavelength = 633 nm, LEDtronics. Inc., CA, USA) as a light source and a photodiode (OSRM GmbH, Germany) as a light detector (Fig. 2a). The response of the sensor was characterized by measuring the change in the intensity of transmitted light caused by the interaction of CO2 with the sensing element (Fig. 2b). Gas sample, from either the ambient air or a flow containing simulated breath was directed to the sensor detection chamber with a pump. Real breath test was also conducted by asking a volunteer to breathe into the device via a mouthpiece. The device also contains an electronic circuit, which collects and processes the data from the optoelectronic detection system, and then wirelessly sends the data to a smartphone via a Bluetooth chip.
Figure 2.
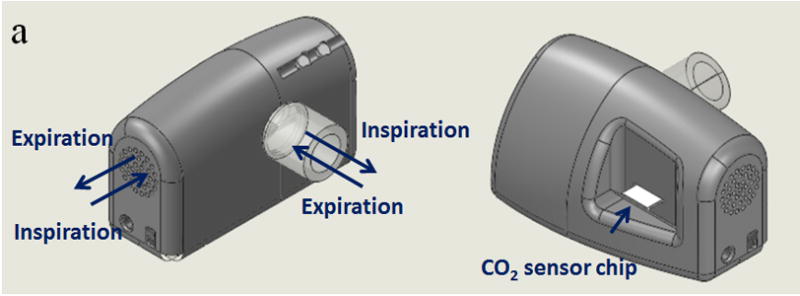
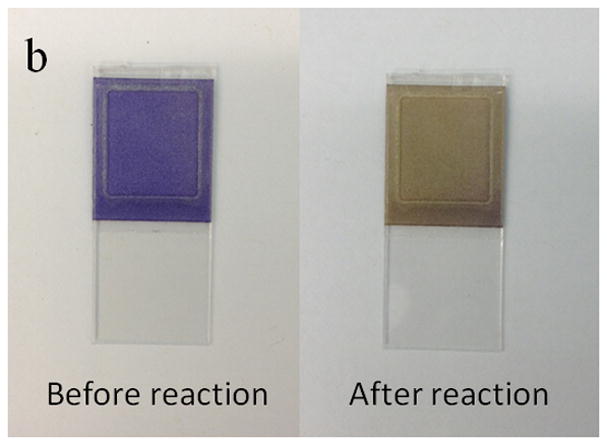
(a) Pocket-sized CO2 sensor device. It has inlets and outlets that allow the detection and analysis of both breath and environmental air samples. The key-sensing element is a CO2 sensor chip, which can be inserted into or remove from the device. The device also features an electronic circuit for signal processing and Bluetooth for wireless transmission of data. (b) The sensor chip changes color from purple to yellow after exposure to CO2 and the concentration of CO2 is determined by measuring the change in intensity of transmitted light for the sensing element.
2.3. Device characterization and validation
Simulated breath samples
In order to investigate the response of the CO2 sensor to real breath, a humidified CO2 gas mixture was employed to simulate the expired air. The simulated expired breath samples were prepared by first mixing 80% N2 + 20% O2 air with different amounts of CO2 (Praxair. Inc.), ranging from 0.03% to 11.5%. The CO2 mixtures were then pumped through a sealed water system immersed in a thermostatic water bath (Thermo Scientific, USA) at 35°C to generate 35°C and 100% relative humidity. The simulated expired gas samples and ambient air were then introduced into the breath analyzer alternately at a flow rate of 6L/min to simulate expiration and inspiration processes as shown in Fig. 3a.
Figure 3.
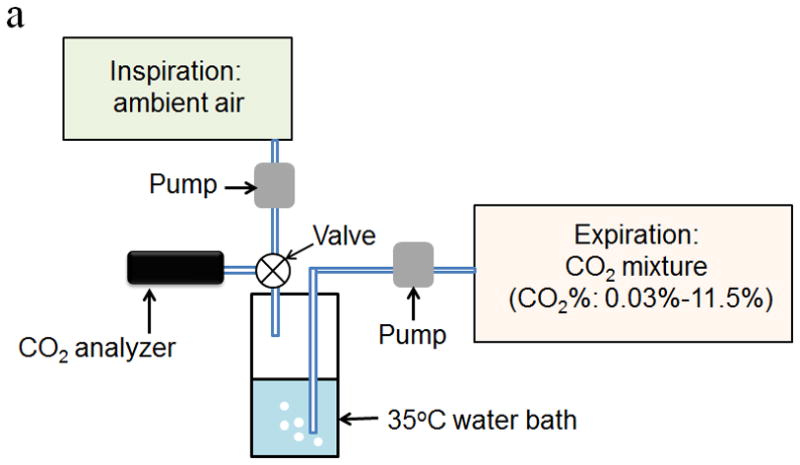
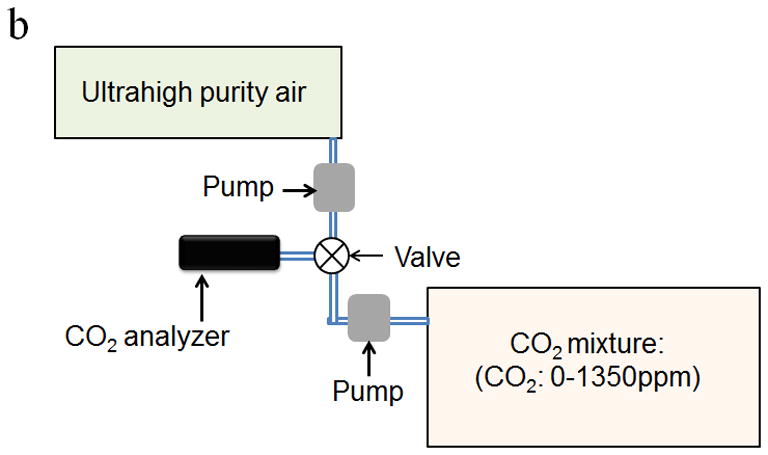
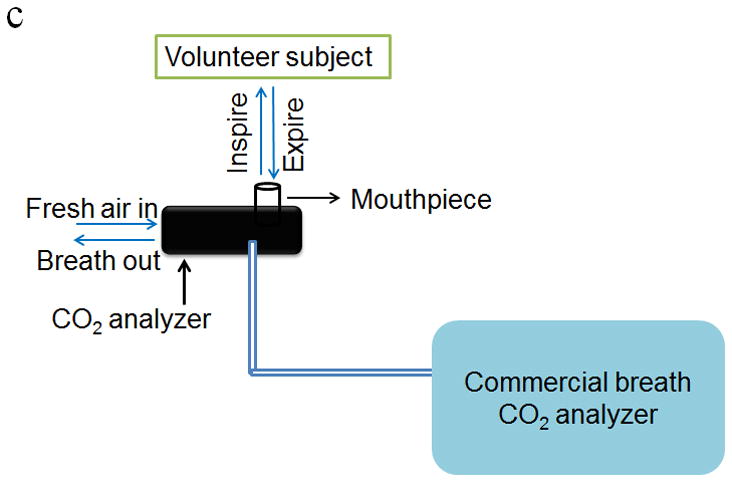
Schematic diagram of calibration setup for investigating the response of the CO2 sensor to (a) breath samples and (b) trace CO2 in air gas samples. (c) Schematic diagram of the laboratory setup for validating the performance of the CO2 sensor using real breath samples from volunteers and a commercial breath CO2 analyzer.
Simulated environmental samples
For environmental CO2 analysis, the CO2 gas mixtures were prepared by mixing ultrahigh purity air with CO2 to simulate indoor air with CO2 concentration ranging from 0 ppm to 1350 ppm. The simulated indoor air samples and ultrahigh purity air were then alternately introduced into the CO2 analyzer at a flow rate of 6 L/min as shown in Fig. 3b.
Sensor signal measurement
The change in light intensity of the CO2 sensor was used to characterize the color change upon exposure to alternating sampling and purging periods of fixed time. The change in light intensity of the CO2 sensor is evaluated as sensor signal from the baseline signal. This means that baseline shifts are corrected, which renders relatively small sensor response dispersion error at a given CO2 concentration (see below for more details). The change in transmitted light of the CO2 sensor is:
where I(0) is the light intensity prior to the exposure of the sensor surface to the gas samples, I(t) is the light intensity at time t during the sampling process. In addition, the performance of this device was further validated using a commercial breath CO2 analyzer (capnography analyzer from VacuMed, CA) and real breath samples from volunteers (Fig. 3c).
Cross-sensitivity analysis
The interference of other chemicals present in expired air and atmosphere, such as ethanol, acetone, acetonitrile, and NH3 was investigated by introducing the humidified gas mixtures containing pure N2 and the interfering gases into the CO2 analyzer. The response of the CO2 sensor exposed to the interfering gases was compared with the response of the sensor exposed to 1% CO2 gas mixture.
3. RESULTS AND DISCUSSION
3.1. Sensing mechanism of the CO2 sensor
The basic sensing principle of the new CO2 sensor is based on the adsorption and desorption processes of CO2 in the sensor during the test [24]. Briefly, during the sensing process, as gas samples (either expired breath or environmental air) were introduced into the device, CO2 was adsorbed by the HCO3−/CO32− buffer system in the sensor, and the pH of the sensing system decreased. However, during the purging process, the clean air flowed over the sensor, and the CO2 molecules were dissociated from the sensor, resulting in the recovery of pH to the initial value. As described in Section 2.1, m-cresol purple was used as the pH indicator of the sensing system. Since the variation of pH in the sensor was correlated to the concentration of CO2 in the gas flow, the concentration of CO2 in either the expired breath or environmental air can be determined via monitoring the color change of m-cresol purple (mCP). The chemical reaction process is as follows [28, 29]:
| (R1) |
| (R2) |
where CO2(aq) is the dissolved CO2 in the sensor, mCP2− is the deprotonated form of m-cresol purple and mCPH− is the protonated form of m-cresol purple in the HCO3−/CO32− buffer solution.
3.2. Characterization of the CO2 sensor
Breath CO2 analysis calibration
Fig. 4a shows the response of the CO2 sensor exposed to the alternating atmospheres of dry air and humidified 5% CO2 gas mixture. As described earlier, when the CO2 gas sample was introduced into the device, water vapor condensed onto the sensor surface and CO2 was adsorbed by the HCO3−/CO32− buffer solution in the sensor, which decreased the pH level of the sensing system, and changed the color of the pH sensing probe from purple to yellow (Fig. 2b). This color change was measured as a change in the transmitted light intensity, which was correlated to the CO2 concentration in the gas sample. Conversely, when CO2-free dry air was introduced into the device to simulate the inspiration process, CO2 was stripped from the sensor and the color changed back from yellow to purple, which was also recorded by the light intensity change. The CO2 concentration in the simulated breath sample can be determined from the maximum intensity change in each simulated breathing cycle. It is worthy to notice, the sensor signal noise at the maximum response level is generated by a current inability of the analog-to-digital converter of the microcontroller used in the detection system to smoothly manage small voltage signal changes. The problem is currently being corrected from hardware design standpoint. In addition, Fig. 4b shows the maximum light intensity change vs. the CO2 concentration in the gas samples. It can be observed that the maximum change of light intensity increases with CO2 concentration from 0.03% to 11.5% with a Langmuir-like behavior (R2 = 0.9986). This concentration range sufficiently covers the need of breath CO2 analysis for medical applications, which typically ranges between 2.5 and 5.0% in healthy individuals [30].
Figure 4.
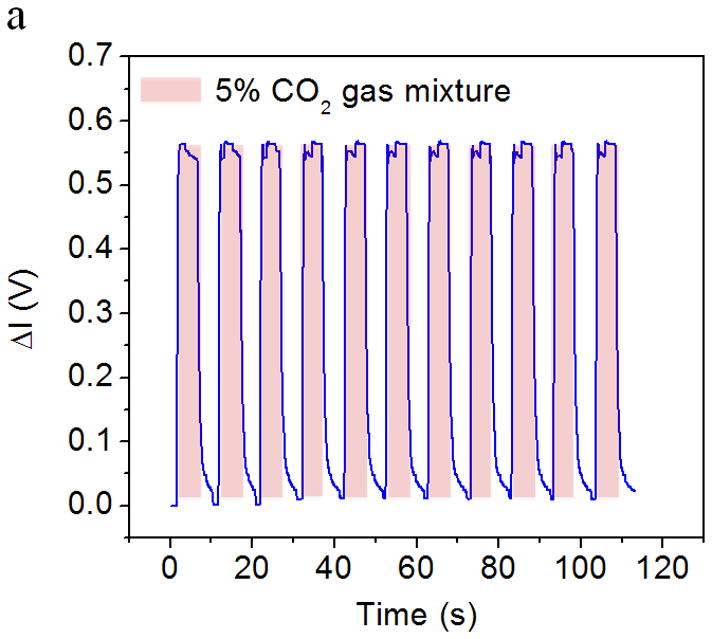
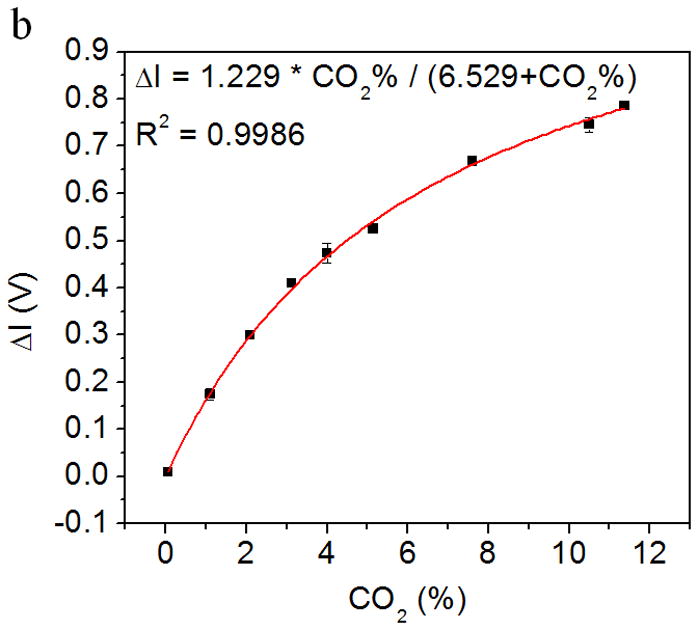
(a) Response of the CO2 sensor exposed to the alternating atmospheres of dry air and artificial expired air containing 5 % CO2. The light intensity increases rapidly when the sensor was exposed to CO2-containing atmosphere and returns to the initial value rapidly when the exposed to CO2-free atmosphere. (b) The relationship between the maximum intensity change (indicated by ΔV, the output of the photodiode) and CO2 concentration. The light intensity increased with the CO2 concentration. Response vs. concentration to Langmuir-like equation is shown in the figure insert.
Environmental CO2 analysis calibration
Fig. 5a shows the response of the CO2 sensor exposed to the alternating atmospheres of ultrahigh purity air and simulated environmental air samples. The light intensity increased as CO2 interacted with the sensing system and reduced gradually as pure air passed through the device. Fig. 5b shows the relationship between the maximum change of light intensity in each sampling-purging cycle and CO2 concentration. The intensity change increased with CO2 concentration with a Langmuir-like behavior (R2 = 0.9965). The detectable range of the sensor to the ambient CO2 was found from few tens of ppm to few thousand ppm levels, which covers the needs for environmental CO2 detection [31].
Figure 5.
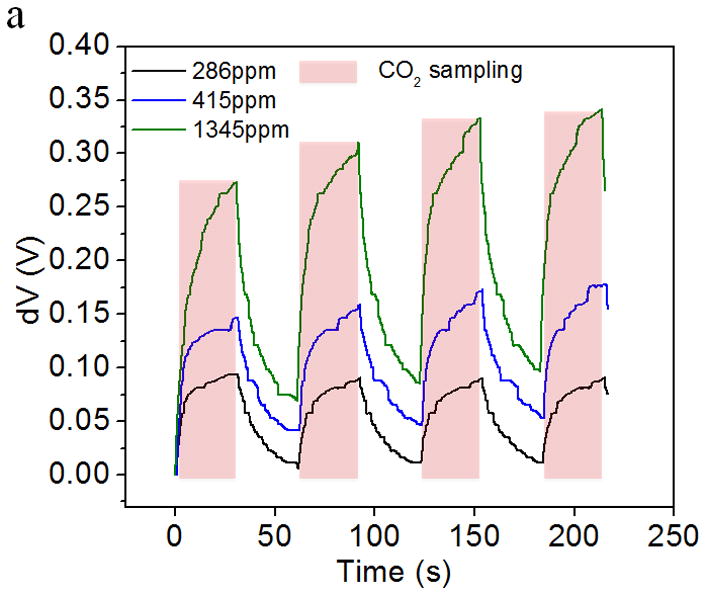
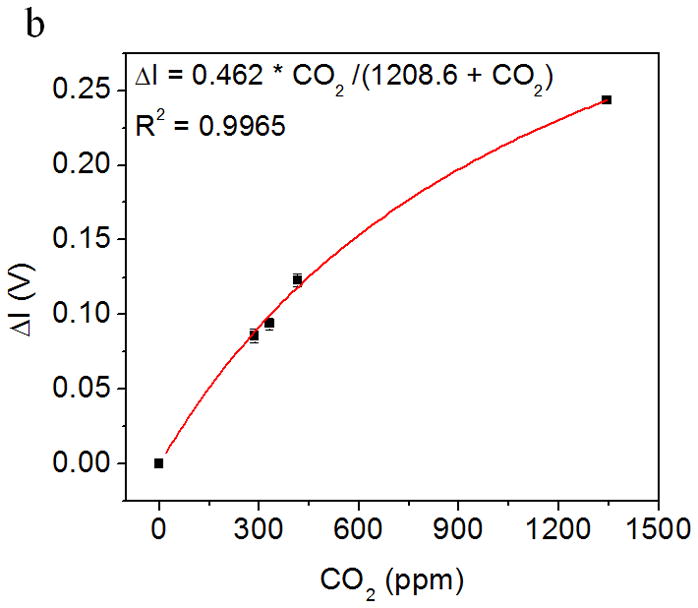
Application of CO2 sensor for environmental sensing: (a) Response of the CO2 sensor exposed to the alternating atmospheres of simulated environmental air samples. (b) The light intensity changes increases with CO2 concentration in the simulated environmental air sample. Response vs. concentration fitting to Langmuir-like equation is shown in the figure insert.
3.3. Cross-sensitivity study
In order to investigate the interference effects of other chemicals that might exist in the expired breath and ambient air, humidified gas mixtures containing pure N2 and different interfering gases were introduced into the CO2 device at a flow rate of 6L/min for 30s. As shown in Table 1, compared to the response of the sensor exposed to a 1% CO2 gas sample, the interference of the other gases is within 12%, which can be considered negligible in breath CO2 analysis as the CO2 levels in breath typically ranges from 3.5 to 5.5 %. However, interference from chemicals such as NH3 needs to be corrected when the CO2 sensor is used for environmental CO2 monitoring.
Table 1.
Cross-sensitivity of CO2 sensor for other gases in the expired and environmental air
| Gas | ΔImax (V) | Maximum Interference (%) |
|---|---|---|
| 1% CO2 | 0.170 | / |
| Pure N2 | 0.010 | 5.8 |
| 165 ppm ethanol | 0.014 | 8.2 |
| 20 ppm acetone | 0.013 | 7.6 |
| 21 % O2 | 0.017 | 10.0 |
| 250 ppb NH3 | 0.017 | 10.0 |
| 100 ppb acetonitrile | 0.019 | 11.2 |
In addition to the above-mentioned studies, the effect of ambient humidity on breath CO2 analysis was evaluated. For relative humidity ranging between 20 and 85 %, the sensor response to the expired CO2 remained constant within 10% variation (not shown). Some interference effect was detected for the relative humidity levels higher than 85%. However, the responses of the sensor to humid air and humid air with CO2 mixture (e.g. simulated breath at 35°C, and 100% humidity) are different. Therefore the effect of extremely high ambient humidity could be corrected by use of an internal humidity sensor in the CO2 analyzer.
3.4 Real breath analysis
In order to investigate the application of the CO2 sensor to real breath analysis, including breath patterns and ventilation rate, the CO2 sensor was calibrated using breath samples in combination with flow rate measurements from an in-situ flow meter. The breath patterns of two volunteers were also analyzed. The volunteers included one healthy person and one asthma patient from the VA Medical Center, Phoenix, AZ. They were asked to breathe normally through the mouthpiece. The end-tidal CO2 values (the maximal concentration of CO2 at the end of expiration) were calculated and compared with the values assessed from a capnogram recorded with a commercial breath CO2 analyzer (Fig. 6). The “capnogram” refers to a real-time waveform of CO2 concentration in the process of respiration with gas samples taken from a sidestream port located a few millimeters away from the colorimetric sensor as shown in Fig. 3c. From Fig. 6a and 6b, it can be seen that the end-tidal CO2 values measured by the new CO2 analyzer were comparable to the values assessed by the commercial analyzer for both the healthy person and asthma patient. In addition, the capnogram obtained from the new CO2 analyzer also showed good agreement with the commercial device. The 90% response time of the CO2 analyzer was less than ~150 ms, which meets the requirements for breath-by-breath CO2 analysis (< 200 – 300 ms). Furthermore, the new CO2 analyzer showed faster response than the commercial analyzer, which had a fraction of a second delay in gas detection due to the aspiration of the gas sample from the sample site through the sampling tube (around 3 ft. long) and into its detection unit (infrared detection chamber) (Fig. 3c). It was evident that time response improvements were achieved in the new CO2 analyzer due to the in-situ location of the sensor chip in the mainstream of the breath sample flow.
Figure 6.
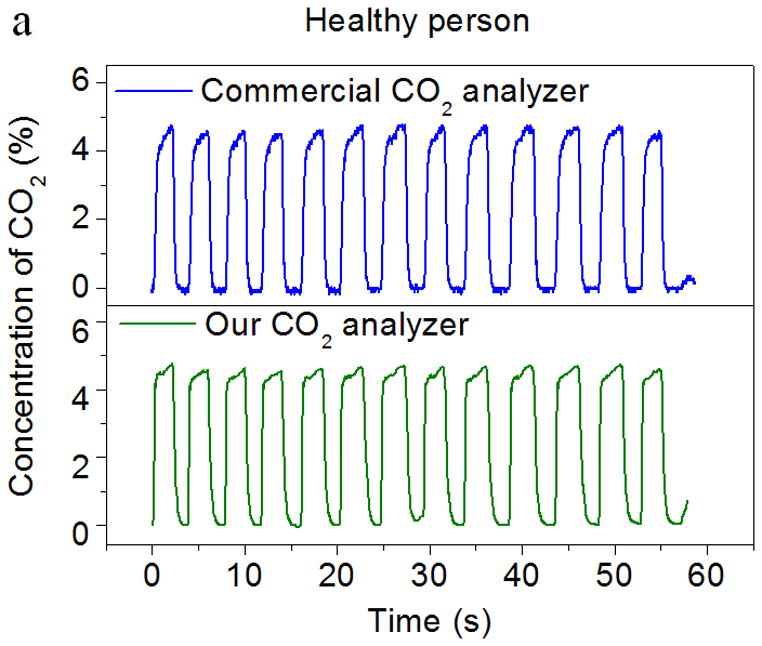
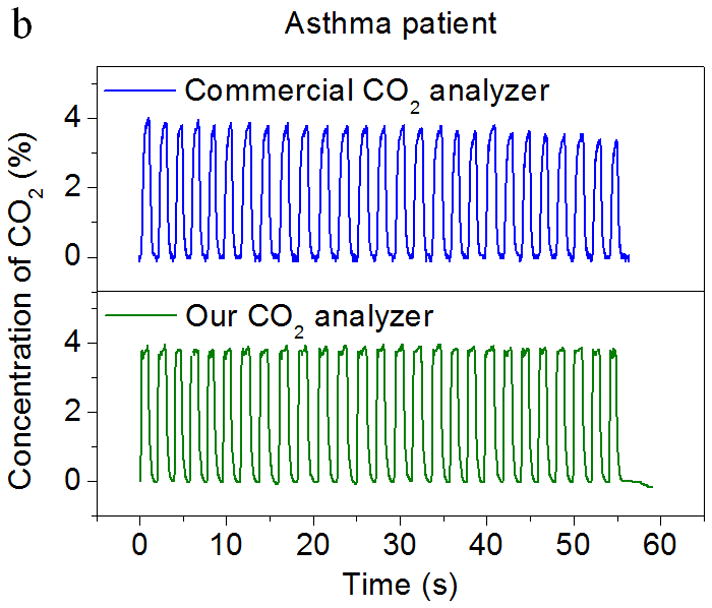
Comparison of the CO2 sensor by this work and a commercial infrared CO2 analyzer. Both sensors were exposed to real breath samples from (a) a healthy person and (b) an asthma patient. The capnograms obtained from the present CO2 sensor and the commercial device are in good agreement with each other.
4. CONCLUSIONS
This paper describes the development of a pocket-sized CO2 sensor for personal healthcare and environmental monitoring. The device has an integrated circuit and an optical-based detection chamber, which includes a colorimetric CO2 sensor. The CO2 sensor shows reversible response to CO2 and a dynamic detection range from ~50 ppm to 11.5%. When compared to a commercial infrared capnography detector, the CO2 analyzer shows fast response with a 90% response time of less than 150ms, which indicates that the CO2 analyzer is suitable for breath-by-breath analysis. In addition, the CO2 sensor shows accurate detection of CO2 levels after non-linear calibration of the sensor response. The interference study indicates that other chemicals typically present in the expired breath and ambient air have negligible effects on the response of the CO2 sensor. Compared with traditional CO2 measurement technology, the new pocket-sized CO2 analyzer allows for simple, fast, and accurate assessment of breath CO2 levels, and breath CO2 profiles for patients with COPD and asthma, as well as CO2 levels in ambient air.
Highlights.
A novel real-time carbon dioxide (CO2) sensor for health and environmental applications is developed.
The sensor shows fast and reversible response to CO2 over a wide concentration range.
The sensor is immune to the presence of various interfering gases in ambient or expired air.
The sensor can be used for real-time breath analysis, and the results are in good agreement with those from a commercial CO2 detector.
Acknowledgments
This work was supported by National Institutes of Health, NIBIB 1R21EB014219. The authors acknowledge the support of Program Director, Dr. Brenda Korte for technical support and discussions.
Biographies
Di Zhao received her BS and MS degree in Materials Science and Engineering from Tongji University in 2006 and 2009, respectively. She is currently working towards her PhD in Chemical Engineering at Arizona State University under the supervision of Dr. Erica Forzani. Her research interests focus on novel colorimetric sensors for the detection of gas and biomarkers in human breath.
Dylan Miller is a Graduate Research Assistant in the Center for Bioelectronics and Biosensors, The Biodesign Institute, at ASU. He received his BS and MS degree in Mechanical Engineering at Arizona State University. His current research is focused on the mechanical design of wireless sensor devices with applications in mobile health and environmental safety.
Xiaojun Xian is Assistant Research Scientist of Center for Bioelectronics and Biosensors, The Biodesign Institute, at ASU. He received his PhD and BS in Physical Chemistry in Peking University, China. He joined Arizona State University in 2009 as Postdoctoral Research Associate and then worked as Assistant Research Scientist. His current research interests include development of mobile health sensor for chronic diseases management and environmental chemical sensor for personal exposure assessment.
Francis Tsow is Assistant Research Professor of the Center of Bioelectronics and Biosensors, the Biodesign Institute, at Arizona State University (ASU). He received his PhD in Electrical Engineering at Arizona State University. His current research focus on novel science and technology particularly those related to sensing applications.
Erica Forzani is Assistant Professor of the School for Engineering of Matter, Transport and Energy, Ira A Fulton Schools of Engineering at Arizona State University (ASU); and Deputy Director of Center for Bioelectronics and Biosensors, at the Biodesign Institute, ASU. She received her PhD in Chemistry and BS in Clinical Chemistry and Biochemistry in Cordoba National University, Argentina. She joined Arizona State University in 2003 as research associate of the Department of Electrical Engineering, where she later worked as Assistant Research Professor. Her current research is focused on science and technology of novel sensors and integration of sensors into wireless, non-invasive and inexpensive sensor devices with applications in mobile health, and environmental health & safety.
Footnotes
The authors declare no competing financial interest
Publisher's Disclaimer: This is a PDF file of an unedited manuscript that has been accepted for publication. As a service to our customers we are providing this early version of the manuscript. The manuscript will undergo copyediting, typesetting, and review of the resulting proof before it is published in its final citable form. Please note that during the production process errors may be discovered which could affect the content, and all legal disclaimers that apply to the journal pertain.
References
- 1.Richardson S. New trends in capnography. FOCUS: Journal for Respiratory Care & Sleep Medicine. 2006;6:4. [Google Scholar]
- 2.Chronic Obstructive Pulmonary Disease (COPD), Centers for Disease Control and Prevention Home Page. [accessed Nov 17, 2011]; http://www.cdc.gov/copd.
- 3.Gooneratne NS, Patel NP, Corcoran A. Chronic Obstructive Pulmonary Disease Diagnosis and Management in Older Adults. J Am Geriatr Soc. 2010;58:1153–62. doi: 10.1111/j.1532-5415.2010.02875.x. [DOI] [PubMed] [Google Scholar]
- 4. [accessed Sep 30, 2004];Asthma cases increase sixfold in 30 years in Japan, Medical News Today. 2004 http://www.medicalnewstoday.com/articles/14222.php.
- 5. [accessed May 3, 2011];Health Central Home Page. http://www.healthcentral.com/asthma/introduction-000004_4-145.html.
- 6.Mannino DM, Akinbami LJ, Ford ES, Redd SC. Chronic Obstructive Pulmonary Disease Surveillance - United States, 1971—2000. Centers for Disease Control and Prevention; 2002. [accessed July 19, 2002]. http://www.cdc.gov/mmwr/preview/mmwrhtml/ss5106a1.htm. [Google Scholar]
- 7.Kodali BS. Capnography in 911. [accessed Aug 28, 2008];Capnography Home Page. 2008 http://www.capnography.com/outside/911.htm.
- 8.Raheem MSA, Wahba OM. A Nasal Catheter for the Measurement of End-Tidal Carbon Dioxide in Spontaneously Breathing Patients: A Preliminary Evaluation. Anesth Analg. 2010;110:1039–42. doi: 10.1213/ANE.0b013e3181d365fd. [DOI] [PubMed] [Google Scholar]
- 9.Kurt OK, Alpar S, Sipit T, Guven SF, Erturk H, Demirel MK, et al. The diagnostic role of capnography in pulmonary embolism. Am J Emerg Med. 2010;28:460–5. doi: 10.1016/j.ajem.2009.01.031. [DOI] [PubMed] [Google Scholar]
- 10.Cacho G, Perez-Calle JL, Barbado A, Lledo JL, Ojea R, Fernandez-Rodriguez CM. Capnography is superior to pulse oximetry for the detection of respiratory depression during colonoscopy. Rev Esp Enferm Dig. 2010;102:86–9. doi: 10.4321/s1130-01082010000200003. [DOI] [PubMed] [Google Scholar]
- 11.Ab-Rahman NH, Howe TA. A comparison of capnographic waveform indices and peak flow meter in the monitoring of asthmatic patients in emergency departments. Ann Emerg Med. 2008;51:476–7. [Google Scholar]
- 12.Yanagidate E, Dohi S. Modified nasal cannula for simultaneous oxygen delivery and end-tidal CO2 monitoring during spontaneous breathing. Eur J Anaesth. 2006;23:257–60. doi: 10.1017/S0265021505002279. [DOI] [PubMed] [Google Scholar]
- 13.Persily AK. The relationship between indoor air quality and carbon dioxide. Indoor air. 1996:961–6. [Google Scholar]
- 14.Satish U, Mendell MJ, Shekhar K, Hotchi T, Sullivan D, Streufert S, et al. Is CO2 an Indoor Pollutant? Direct Effects of Low-to-Moderate CO2 Concentrations on Human Decision-Making Performance. Environ Health Persp. 2012;120:1671–7. doi: 10.1289/ehp.1104789. [DOI] [PMC free article] [PubMed] [Google Scholar]
- 15.Erdmann CA, Apte MG. Indoor carbon dioxide concentrations and sick building syndrome symptoms in the BASE study revisited: Analyses of the 100 building dataset. Indoor Air. 2002:443–8. [Google Scholar]
- 16.Kodali BS. Capnography Home Page. 2008. Physical Method of CO2 Measurement. [Google Scholar]
- 17.Danckwerts PV, Kennedy AM, Roberts D. Kinetics of Co2 Absorption in Alkaline Solutions.2. Absorption in a Packed Column and Tests of Surface-Renewal Models. Chem Eng Sci. 1963;18:63–72. [Google Scholar]
- 18.Nakamura N, Amao Y. Optical sensor for carbon dioxide combining colorimetric change of a pH indicator and a reference luminescent dye. Anal Bioanal Chem. 2003;376:642–6. doi: 10.1007/s00216-003-1949-3. [DOI] [PubMed] [Google Scholar]
- 19.Segawa H, Ohnishi E, Arai Y, Yoshida K. Sensitivity of fiber-optic carbon dioxide sensors utilizing indicator dye. Sensor Actuat B-Chem. 2003;94:276–81. [Google Scholar]
- 20.Borisov SM, Waldhier MC, Klimant I, Wolfbeis OS. Optical carbon dioxide sensors based on silicone-encapsulated room-temperature ionic liquids. Chem Mater. 2007;19:6187–94. [Google Scholar]
- 21.Fernandez-Sanchez JF, Cannas R, Spichiger S, Steiger R, Spichiger-Keller UE. Optical CO2-sensing layers for clinical application based on pH-sensitive indicators incorporated into nanoscopic metal-oxide supports. Sensor Actuat B-Chem. 2007;128:145–53. [Google Scholar]
- 22.Carvajal MA, de Vargas-Sansalvador IMP, Palma AJ, Fernandez-Ramos MD, Capitan-Vallvey LF. Hand-held optical instrument for CO2 in gas phase based on sensing film coating optoelectronic elements. Sensor Actuat B-Chem. 2010;144:232–8. [Google Scholar]
- 23.Mills A, Lepre A, Wild L. Breath-by-breath measurement of carbon dioxide using a plastic film optical sensor. Sensor Actuat B-Chem. 1997;39:419–25. [Google Scholar]
- 24.Zhao D, Miller D, Shao DD, Xian XJ, Tsow F, Iglesias RA, et al. A personal device for analyzing carbon dioxide in real time and real breath: Experimental investigation and computational simulation. Sensor Actuat B-Chem. 2013;183:627–35. [Google Scholar]
- 25.Burgot J. Ionic equilibria in analytical chemistry. 1. New York: Springer; 2012. [Google Scholar]
- 26.Sabnis RW. Handbook of acid-base indicators. 1. CRC Press; 2007. [Google Scholar]
- 27.Zollinger H. Color chemistry: syntheses, properties, and applications of organic dyes and pigments. 3. New York: John Wiley & Sons; 2003. [Google Scholar]
- 28.Rini M, Pines D, Magnes BZ, Pines E, Nibbering ETJ. Bimodal proton transfer in acid-base reactions in water. J Chem Phys. 2004;121:9593–610. doi: 10.1063/1.1804172. [DOI] [PubMed] [Google Scholar]
- 29.Roberts D, Danckwerts PV. Kinetics of CO2 Absorption in Alkaline Solutions.1. Transient Absorption Rates and Catalysis by Arsenite. Chem Eng Sci. 1962;17:961–9. [Google Scholar]
- 30.Sills JR. The comprehensive respiratory therapist exam review: entry and advanced levels. 1. Mosby: Elsevier; 2009. [Google Scholar]
- 31.O.S.H.A. United States Department of Labor, editor. OSHA Technical Manual. 1999. [Google Scholar]


