

Abstract
Objectives
The secretion of dopamine and serotonin is increased in cholangiocarcinoma, which has growth-promoting effects. Monoamine oxidase A (MAOA), the degradation enzyme of serotonin and dopamine, is suppressed in cholangiocarcinoma via an unknown mechanism. The aims of this study were to (i) correlate MAOA immunoreactivity with pathophysiological parameters of cholangiocarcinoma, (ii) determine the mechanism by which MAOA expression is suppressed and (iii) evaluate the consequences of restored MAOA expression in cholangiocarcinoma.
Design
MAOA expression was assessed in cholangiocarcinoma and non-malignant controls. The control of MAOA expression by promoter hypermethylation was evaluated and the contribution of IL-6 signaling to the suppression of MAOA expression was determined. The effects of MAOA overexpression on cholangiocarcinoma growth and invasion were also assessed.
Results
MAOA expression is correlated with differentiation, invasion and survival in cholangiocarcinoma. The MAOA promoter was hypermethylated immediately upstream of the start codon in cholangiocarcinoma samples and cell lines but not in non-malignant counterparts. IL-6 signaling also decreased MAOA expression via a mechanism independent of hypermethylation, involving the regulation of the balance between SP-1 transcriptional activity and its inhibitor, R1 repressor. Inhibition of both IL-6 signaling and DNA methylation restored MAOA levels to those observed in cholangiocytes. Forced MAOA overexpression inhibited cholangiocarcinoma growth and invasion.
Conclusions
MAOA expression is suppressed by the coordinated control of promoter hypermethylation and IL-6 signaling. MAOA may be a useful prognostic marker in the management of cholangiocarcinoma, and therapies designed to increase MAOA expression might prove beneficial in the treatment of cholangiocarcinoma.
Keywords: biliary cancer, DNA methylation, SP-1, R1 repressor
Cholangiocarcinomas are devastating cancers of intrahepatic and extrahepatic origin that are increasing in both worldwide incidence and mortality rates (1, 2). The challenges posed by these biliary tract cancers are daunting, as conventional treatment options are limited and long-term survival requires complete surgical resection of the tumor (1, 2). Therefore it is important to understand the cellular mechanisms of cholangiocarcinoma growth with a view towards developing novel chemopreventive strategies.
The biogenic amines serotonin, dopamine and histamine are overproduced in cholangiocarcinoma and increased secretion of these biogenic amines has been attributed to increased expression of their synthesis enzymes and suppression of degrading enzymes (3–5). Monoamine oxidase A (MAOA), the enzyme that metabolizes both serotonin and dopamine (3, 4), is suppressed in cholangiocarcinoma, although the mechanism by which this occurs and whether MAOA expression correlates with pathological features of cholangiocarcinoma is unknown.
A number of studies have explored the possibility that the MAOA promoter can fall under epigenetic control through hypermethylation (6, 7). In addition, the human MAOA promoter contains 4 putative SP-1 sites (8) and there is a positive correlation between cellular SP-1 concentrations and MAOA promoter and catalytic activity indicating that SP-1 is a positive regulator of MAOA expression (8). Furthermore, a novel repressor R1 (R1/RAM2/CDCA7L) of the MAOA promoter has been cloned and characterized (9). This repressor binds to the SP-1 sites to exert its effects, thereby competing with SP-1 for its consensus sequence (9).
The association between chronic inflammation and the development of malignancy is evident in the biliary tract where persistent inflammation strongly predisposes individuals to cholangiocarcinoma (10, 11). The inflammatory cytokine interleukin-6 (IL-6) enhances tumor growth in cholangiocarcinoma by altering gene expression via autocrine mechanisms (10, 11). IL-6 can regulate the activity of DNA methyltransferases (12) thereby influencing DNA methylation and IL-6 overexpression in cholangiocarcinoma cells regulates the promoter methylation status of a number of genes in a manner that promotes survival and growth of the tumor cell (13). The role of IL-6 in the regulation of MAOA expression and biogenic amine metabolism is unknown.
The aims of this study were to (i) perform a correlation of MAOA expression in both intrahepatic cholangiocarcinomas and Klatskin tumors with pathophysiological parameters, (ii) determine the mechanism by which MAOA expression is suppressed and (iii) determine the consequences of the restoration of MAOA expression on cholangiocarcinoma growth.
Materials and methods
Cell Lines
The Mz-ChA-1 cholangiocarcinoma cell line was a gift from Dr. G. Fitz (University of Texas Southwestern Medical Center, Dallas, TX) (14). CCLP-1 (15), HuCC-T1 (16) and SG231 (17) were a gift from Dr. AJ Demetris (University of Pittsburg, PA) and cultured as described (15–17). HCCC9810, RBE and SSP-25 were purchased from Shanghai Institutes for Biological Sciences, Chinese Academy of Sciences (Shanghai, China) and cultured according to the manufacturer’s instructions. The human immortalized cholangiocyte cell line, H69 (from Dr. G.J Gores, Mayo Clinic, Rochester, MN), was cultured as described (18). A primary human intrahepatic cholangiocyte cell line (HIBEC) was purchased from Sciencell (Carlsbad, CA) and cultured according to the manufacturer’s instructions.
To assess the effects of low levels of IL-6 secretion, we used a genetically modified cell line in which Mz-ChA-1 cells were stably transfected with an IL-6 shRNA plasmid. The resulting cell line (Mz-IL-6 shRNA) and the mock-transfected control (Mz-Neo neg) have been previously characterized (19). Similarly, Mz-ChA-1 cells were genetically modified to either express very low levels of R1 repressor (by stably transfecting an R1 repressor-specific shRNA plasmid; SABiosciences, Frederick, MD) or over-expressing human MAOA (by stably transfecting a plasmid containing human MAOA cDNA; Origene, Rockville, MD) following the methodology described previously (20).
Patients and specimens
Patients with hilar cholangiocarcinoma (Klatskin tumor; n=84) and intrahepatic cholangiocarcinoma (ICC; n=43) pathologically confirmed at the First Affiliated Hospital of Sun Yat-sen University during 1997 to 2007 were enrolled in the survival analysis. Three cores (1.5 mm in diameter) of representative tumor area from each patient’s archival formalin-fixed, paraffin-embedded tissue blocks were assembled into tissue microarrays by MTA1-manual tissue arrayer (Beecher Instruments Inc, USA). Patients with choledochal cyst (n=45) served as benign controls. Overall survival was defined as the interval between one month after the dates of surgery and death or the last follow-up. Paired tumor and non-tumor tissues (at least 3 cm distant from the tumor) from 25 cholangiocarcinoma patients and liver resected from 20 benign disease patients during April 2009 to August 2009 were microdissected prior to DNA and RNA extraction. Among these DNA samples, 17 cholangiocarcinoma and 5 benign samples were used for bisulfate pyrosequencing. None of these patients received chemotherapy or radiation before sampling. Written informed contents were obtained from all patients. Samples were coded anonymously according to the Declaration of Helsinki, and the protocol was approved by the ethics committee of the First Affiliated Hospital of Sun Yat-sen University.
Immunohistochemistry
Immunoreactivity of MAOA was detected in the aforementioned tissue microarrays as described (3) using a rabbit polyclonal antibody specific to MAOA (Santa Cruz Biotechnology; Santa Cruz, CA), then assessed quantitatively by the mean intensity of the area of interest under the representative field by Image Pro-Plus 7.0 software (Media Cybernetics Inc, MD). Expression of MAOA in each sample was evaluated by the mean intensity of the three cores and grouped in “None” (<25% of mean intensity of control group), “Low” (25%~50% of mean intensity of control group), “Moderate” (50%~75% of mean intensity of control group) and “Strong” (75%~100% of mean intensity of control group). Immunohistochemical analysis was conducted by two independent observers who were blinded to the related clinical data.
Real time PCR
RNA was extracted from human tissue by Trizol Reagent (Invitrogen Inc, CA) according to the manufacturer’s instructions and in cell lines with or without treatment with by 5-aza-2′-deoxycytidine (5-aza; 5 or 10 μM/day for 4 days) or an anti-IL-6 neutralizing antibody (R&D Systems, Minneapolis, MN; 1μg/mL/day for 4 days) using the RNeasy Mini Kit (Qiagen Inc, CA). Realtime PCR was performed as previously described (3) using commercially available primers designed against human MAOA, IL-6, R1 Repressor, PCNA or GAPDH (SABioscience, Frederick MD). A ΔΔCT analysis was performed and data were expressed as relative mRNA expression ± SD (n=4).
Immunoblotting
Immunoblots to detect MAOA, PCNA and β-actin were performed as previously described (21) using specific antibodies against each protein. Data are expressed as fold change (mean ± SD) of the relative expression after normalization with β-actin.
DNA extraction, bisulfite treatment and pyrosequencing
Genomic DNA was extracted from cell lines and tissue using the DNeasy Blood and Tissue Kit (Qiagen Inc, CA) according to the manufacturer’s instructions. DNA underwent bilsulfite modification using the EpiTect Bisulfite Kits (Qiagen Inc, CA) according to the manufacturer’s instructions. Representative sequences of the two CpG islands were amplified using a PyroMark PCR Kit (Qiagen Inc, CA) and specific primer pairs designed by PyroMark Assay Design 2.0 software (Qiagen Inc, CA) described in Supplemental Table S1. PCR products were subjected to pyrosequencing on PyroMark Q24 system using PyroGold reagents (Qiagen Inc, CA) according to the manufacturer’s instructions, using sequencing primers (Supplemental Table S1). PyroMark Q24 2.0.6 software (Qiagen Inc, CA) was used to analyze pyrosequencing data. Methylation rate of each CpG island was defined as the mean methylation percentage of each CpG dinucleotides in the amplicon.
Chromatin immunoprecipitation
Chromatin immunoprecipitation was performed on DNA/protein complexes isolated from Mz-IL-6 shRNA cells and the mock-transfected Mz-Neo neg cells following the methodology described (19). DNA fragments bound to SP-1 were precipitated using a specific SP-1 antibody (Active Motif, Carlsbad, CA) according to the manufacturer’s instructions. The relative amount of MAOA promoter precipitated was assessed by real time PCR using specific primers designed around the −200 region of the MAOA promoter (SABiosciences, Frederick MD). A ΔΔCT analysis was performed (22) using the amount of MAOA promoter in the input DNA for normalization.
Immunofluorescence
Subcellular location of SP-1 and R1 repressor was assessed by immunofluorescence (23) in Mz-IL-6 shRNA and Mz-Neo neg cell lines using an antibodies specific to R1 Repressor (Abcam, Cambridge, MA) or SP-1 (Santa Cruz Biotechnology, Santa Cruz, CA). Cells were counterstained with 4',6-diamidino-2-phenylindole (DAPI) and images were taken on an Olympus IX-71 inverted confocal microscope.
Serotonin EIA
Mz-MAOA+ cells and the mock-transfected control cell line, Mz-pCMV6 cells were suspended in Hank’s buffered salt solution (5 × 10⁷ cells/mL) and incubated for 6 hr at 37°C. The amount of serotonin released into the media was assayed using a commercially available serotonin EIA kit (Invitrogen, Carlsbad, CA) according to the manufacturer’s instructions.
Cell cycle analysis
Mz-MAOA+ and Mz-pCMV6 cells were serum-starved for 24 hr to synchronize the corresponding cell cycles. Cells were then moved back into serum-containing media and the relative distribution of cells in each phase of the cell cycle was assessed by using the Cell cycle phase determination kit (Cayman Chemical Company, Ann Arbor MI) and staining was detected by flow cytometry (Accuri C6; BD Accuri cytometers Inc, Ann Arbor MI).
Nude mice
In vivo experiments were performed as described previously (20) using Mz-pCMV6 cells or Mz-MAOA+ cells to establish tumors. Briefly, cells (5 × 10⁶) were suspended in extracellular matrix gel and injected subcutaneously into each back flank of male balb/c 8-week-old nude (nu/nu) mice. After tumor establishment (10 days), dimensions were measured twice a week by an electronic calliper and volume determined as: tumor volume (mm3) = 0.5 x [length (mm) x width (mm) x height (mm)]. Study protocols were performed with strict adherence to institution guidelines and were approved by our institutional IACUC committee.
Invasion assay
The invasive properties of Mz-pCMV6 and Mz-MAOA+ cells were determined using the BD biocoat matrigel invasion chamber following the manufacturers instructions (BD Biosciences, Bedford, MA). The invasion index was calculated as the percentage of cells that invaded the lower chamber through the Matrigel invasion chambers compared to the number of cells that invaded the lower chamber in the control cells.
Statistical analysis
Statistical analyses were performed using SPSS 13.0 software (SPSS, Chicago, IL). Kaplan-Meier survival analysis was used to calculate the cumulative survival curve, which was subsequently assessed by Log Rank test. To test the association between various categorical clinicopathological variables and MAOA expression, the cross-tabulation and Fisher's exact test were performed. Univariate and multivariate Cox proportional hazards regression models were used to identify independent prognostic factors. Spearman correlation analysis was used to assess the correlation between mRNA expression and promoter methylation of MAOA as well as MAOA mRNA expression and PCNA mRNA expression as a marker of proliferative capacity. In vitro, for data exhibiting normal distribution, differences between two groups were analyzed by the Student unpaired t-test, or ANOVA when more than two groups were analyzed, followed by an appropriate post hoc test. When the normality test failed, a Mann-Whitney U test was performed when comparing two groups and a Kruskal-Wallis one-way ANOVA by ranks was performed when comparing 3 or more groups. In each case, a p value of less than 0.05 was used to indicate statistical significance.
RESULTS
MAOA expression correlates with poor prognosis in cholangiocarcinoma
We have previously shown that MAOA expression is suppressed in a number of cholangiocarcinoma cell lines and in a limited number of cholangiocarcinoma biopsy samples (3). Here we performed correlation analyses of MAOA expression with pathophysiological parameters of cholangiocarcinoma. MAOA immunoreactivity was quantitatively assessed and then categorized as none to low or moderate to strong as described above. Representative photomicrographs of these categories are shown in Figure 1A. Analysis of the distribution of staining strength revealed that 100% of the samples from benign biopsy tissue had moderate-to strong staining, whereas approximately 50% of the biopsy samples of cholangiocarcinoma fell into the none-to-low category (Figure 1B). No significant difference in MAOA staining intensity was observed between Klatskin and ICC tumors (Figure 1B). In parallel, mRNA was isolated from a subset of samples that had the tumor tissue microdissected from the tumor periphery. MAOA mRNA expression was significantly decreased in the malignant samples compared to both the benign samples and the tissue taken from the tumor periphery (Figure 1C).
Figure 1. MAOA immunoreactivity in cholangiocarcinoma.
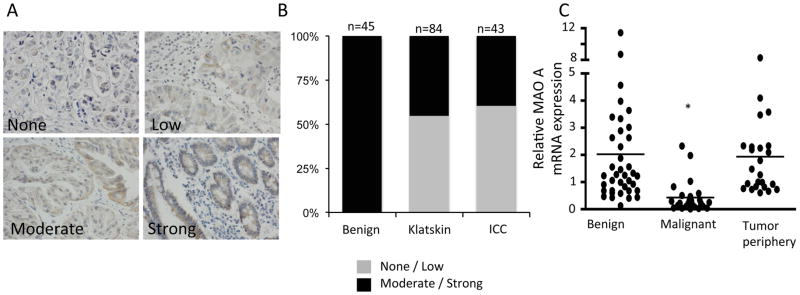

Surgically ressected samples from Klatskin and intrahepatic tumors were evaluated for MAOA immunoreactivity and categorized as either strong, moderate, low or none. Choledochal cysts were used as benign controls. (A) Representative photomicrographs of the MAOA staining in each category. (Magnification X40) (B) The proportion of the samples that were categorized as moderate to strong versus none to low for each tissue type is depicted. (C) In a subset of clinical samples, tumor tissue was microdissected from the tumor periphery. RNA was extracted and real time PCR for MAOA was performed. Data are expressed as average ± SD (n=4; *p<0.05). The survival rate of patients with moderate to strong MAOA immunoreactivity versus none to low immunoreactivity was assessed for Klatskin tumors (D) and intrahepatic cholangiocarcinoma (E).
Further correlation analysis between MAOA immunoreactivity and the physiological and pathophysiological characteristics of the Klatskin and ICC tumors revealed that patients that fell into the non-to-low MAOA staining category had higher incidence of adjacent organ invasion, vascular invasion and perineural invasion (Supplemental Table S2, and S3). Furthermore, low MAOA staining was correlated with poorer differentiation using a number of different classifications of differentiation (Supplemental Table S2 and S3). Not surprisingly, patients with higher MAOA expression had a significantly better prognosis and survival rate than patients with low MAOA immunoreactivity (Figure 1D and 1E). No correlation was observed between MAOA intensity and age or gender (Supplemental Table S2 and S3).
MAOA promoter region is hypermethylated in cholangiocarcinoma
To determine the mechanism by which MAOA may be suppressed in CCA, we performed a computer-based analysis on the MAOA promoter to identify possible CpG islands using Emboss cpgplot software (24). Two putative CpG islands were identified and are depicted in Figure 2A. CpGI28 contains 28 potential CpG dinucleotides and spans the start codon for MAOA transcription. CpGI52 is further upstream and contains 52 potential CpG dinucleotides. Inhibition of DNA methyltransferase by 5-aza treatment increased MAOA mRNA and protein expression in the cholangiocarcinoma cell line Mz-ChA-1 (Figure 2B and 2C), but not in the cholangiocyte cell line H69 (Figure 2B and 2C).
Figure 2. MAOA promoter contains CpG Islands and MOA expression is regulated by hypermethylation.

The published sequence of the human MAOA promoter was analyzed using the Emboss cpgplot software. Two putative CpG islands were found and are represented (A). Mz-ChA-1 and H69 cells were treated with various concentrations of 5-aza-2-deoxycytidine for 4 days. MAOA expression was assessed by realtime PCR (B) and immunoblotting (C). Real time PCR data are expressed as average ± SD (n=4). (* p<0.05). Representative MAOA immunoblots are shown. β-Actin was used as the loading control.
To demonstrate that the promoter region of MAOA is directly methylated and to identify which putative CpG island may be involved, we performed bisulfite conversion of DNA followed by pyrosequencing. Figure 3A shows representative pyrosequencing traces of a region in CpGI28 that spans 7 potential CpG residues (labeled R1 to R7). Mz-ChA-1 cells had a very high degree of methylation on CpGI28 of the MAOA promoter, whereas the methylation of H69 cells was low (Figure 3A). A grayscale representation of the degree of methylation of each residue for all samples studied was used, with white representing 0% methylation and black representing 100% methylation. The non-malignant cell lines H69 and HIBEC had very low levels of methylation, whereas 4 out of 7 cholangiocarcinoma cell lines showed high methylation levels of CpGI28 (Figure 3B). Because MAOA is an X-linked gene (7), we narrowed down the analysis of the human tissue samples to male patients only, due to the high levels of physiological methylation of X-linked genes in females. We assessed the methylation levels in 17 male cholangiocarcinoma patients and 5 control patients and demonstrated a higher degree of methylation in cholangiocarcinoma patients than in the non-malignant controls (Figure 3C). No difference in methylation levels between cholangiocarcinoma and non-malignant controls was observed on CpGI52 (data not shown). We correlated the degree of methylation with the MAOA mRNA expression in tissue. There was a significant, negative correlation between the degree of methylation and MAOA expression in the CCA samples, although the relatively low correlation coefficient (r = −0.532) suggests that hypermethylation may not be the only factor affecting MAOA expression (Figure 3D).
Figure 3. CpGI 28 of the MAOA promoter region is hypermethylated in cholangiocarcinoma.


DNA was extracted from cell lines and human tissue and underwent bisulfite modification. Regions within the CpG islands were then amplified by PCR and the degree of methylation was assessed by pyrosequencing. Representative traces from the cholangiocyte cell line H69 and the cholangiocarcinoma cell line Mz-ChA-1 are shown (A) and the CpG residues within this sequence are designated R1 through R7. The degree to which each residue was hypermethylated for each cell line (B) or representative tumor tissue (C) was expressed on a grayscale. Average methylation for each sample was then correlated to the MAOA mRNA expression levels from each sample (D) and was significantly correlated (p=0.028) with a correlation co-efficient of r= −0.532.
MAOA expression is also suppressed by IL-6-mediated events
Cholangiocarcinoma cells secrete high levels of IL-6 (10, 11), which has been shown to modulate the hypermethylation of various target genes (12, 13). Therefore, we assessed the involvement of IL-6 signaling in the expression of MAOA. Treatment with an anti-IL-6 neutralizing antibody increased the mRNA and protein expression of MAOA in Mz-ChA-1 cells, but not in the non-malignant H69 cells. In parallel, MAOA mRNA and protein expression are upregulated in Mz-IL-6 shRNA cells (Figure 4B) in which IL-6 expression has been knocked down to approximately 3% of both the parental cell line (Mz-ChA-1) and the mock transfected Mz-Neo neg cells (19). To assess if the knockdown of IL-6 expression is affecting MAOA expression by modulating promoter hypermethylation, we assessed the levels of methylation by bisulfite conversion of DNA followed by pyrosequencing. Promoter methylation levels remained unchanged between the Mz-IL-6 shRNA cells and the parental Mz-ChA-1 cells (Figure 4C) suggesting that IL-6 may be exerting its effects on MAOA expression via another mechanism. Treatment of Mz-IL-6 shRNA cells with 5-aza increased MAOA expression to a higher degree than similar treatment of Mz-ChA-1 cells (Figure 4D) and inhibition of both DNA methylation (by 5-aza treatment) and IL-6 signaling (by shRNA transfection) is required to restore MAOA expression to the levels observed in the non-malignant cell line, H69 (Figure 4D).
Figure 4. MAOA expression is regulated by IL-6 signaling.

Mz-ChA-1 and H69 cells were treated with an anti-IL-6 neutralizing antibody for 4 days. MAOA expression was assessed by real time PCR and immunoblotting in these treatment groups (A). In parallel, MAOA expression was assessed in cell lines stably expressing IL-6 shRNA (Mz-IL-6 shRNA) compared to the control cell line (Mz-Neo neg) by real time PCR and immunoblotting (B). The degree of promoter hypermethylation in Mz-IL-6 shRNA and Mz-Neo neg cells was assessed by pyrosequencing and expressed on a gray-scale (C). Mz-Neo neg and Mz-IL-6 shRNA cells were treated with 5-aza-2-deoxycytidine (5-aza) for 4 days and MAOA expression was assessed by real time PCR and compared to MAOA levels in H69 cells (D). Real time PCR data are expressed as average ± SD (n=4). (*p<0.05 compared basal-treated samples; #p<0.05 compared to the same treatment in the Mz-Neo neg cells). Representative MAOA immunoblots are shown andβ-Actin was used as the loading control.
As mentioned above, the balance between SP-1 transcriptional activity and R1 repressor activity on the promoter can also regulate MAOA expression (8, 9). When the inhibitor, R1 repressor is not bound to DNA, it is shuttled out of the nucleus to allow SP-1 full access to the consensus sequence (25). To determine if SP-1 may contribute to the IL-6-mediated suppression of MAOA expression, we performed chromatin immunoprecipitation followed by realtime PCR to determine the relative levels of SP-1 bound to the MAOA promoter in Mz-IL-6 shRNA cells compared to Mz-Neo neg cells. There was more SP-1 bound to the MAOA promoter in the absence of IL-6 signaling than in the mock-transfected control cells (Figure 5A). Furthermore, SP-1 could be found predominantly in the cytoplasm of Mz-Neo neg cells, but became nuclear in Mz-IL-6 shRNA cells (Figure 5B). Conversely, R1 repressor could be found exclusively in the nucleus of Mz-Neo neg cells, whereas knocking down IL-6 expression resulted in increased cytoplasmic accumulation (Figure 5B). These data suggest that IL-6 may be exerting its effects on MAOA expression by promoting the interaction between R1 repressor and the MAOA promoter, thereby extruding SP-1 from the nucleus and inhibiting the positive transcriptional control by SP-1.
Figure 5. IL-6 regulates the balance between SP-1 transciptional activity and R1 repressor.

The relative amount of SP-1 transcription factor bound to the MAOA promoter was assessed in Mz-Neo neg and Mz-IL-6 shRNA cells by chromatin immunoprecipitation (A) using a specific SP-1 antibody to precipitate the complex followed by real time PCR using specific primers for the MAOA promoter region. The subcellular localization of SP-1 and R1 repressor in these cell lines was determined by immunofluorescence. SP-1 or R1 repressor immunoreactivity is shown in red, nuclei were counterstained with DAPI (blue; scale=20μm; B). A stable transfected cell line expressing R1 repressor shRNA (Mz-R1 shRNA) was used to assess the effects of R1 repressor on MAOA expression by real time PCR (C) and immunoblotting (D). Real time PCR data are expressed as average ± SD (n=4). (* p<0.05). Representative MAOA immunoblots are shown;β-Actin was used as the loading control.
To demonstrate a role for R1 repressor in the suppression of MAOA expression, we established stable transfected cell lines with the R1 repressor expression knocked down to approximately 12% of the Mz-Neo neg control cell line (Supplemental Figure S1). Suppressed R1 repressor expression increased both MAOA mRNA and protein expression (Figure 5C and 5D).
Implications of restored MAOA expression on cholangiocarcinoma cell proliferation and invasion
To determine the effects of MAOA expression in cholangiocarcinoma, we established an MAOA overexpressing cholangiocarcinoma cell line (Mz-MAOA+) that had approximately 14 fold higher MAOA expression and approximately 40% less serotonin secretion than the mock-transfected control cells (Supplement Figure S2). Mz-MAOA+ cells had a slower proliferation rate than Mz-pCMV6 cells, as demonstrated by a decrease in PCNA expression (Figure 6A) and increased percentage of cells in the G0/G1 arrest phase of the cell cycle (Figure 6B). To assess whether this effect translated into a change in tumor growth in vivo, we used a xenograft model. The tumors derived from Mz-MAOA+ cells increased approximately 5 fold over the course of the experiment, whereas tumors derived from the parental Mz-ChA-1 cells increased approximately 10 fold (Figure 6C), suggesting that high levels of MAOA expression slows tumor growth. Furthermore, in human cholangiocarcinoma samples, MAOA mRNA expression negatively correlated with PCNA mRNA expression (Figure 6D), that is samples with high MAOA expression generally had lower PCNA expression.
Figure 6. Restoration of MAOA expression inhibits cholangiocyte proliferation.

Proliferative capacity was assessed in a cell line overexpressing MAOA (Mz-MAOA+) compared to the control cell line (Mz-pCMV6) by immunoblotting for PCNA (A). Data are expressed as average ± SD (n=4) after normalization for loading with β-Actin. (*p<0.05 compared Mz-pCMV6 cells). Representative PCNA immunoblots are shown;β-Actin is shown as a loading control. Cell cycle progression was assessed by flow cytometry and the percentage of cells in the G0/G1, S and G2 phases determined (B). In vivo, Mz-MAOA+ and Mz-pCMV6 cells were injected into the flank of athymic mice. After tumors were established (12 days), tumor volume was measured for a further 50 days (n=6; C). In our human samples, PCNA mRNA expression for each sample was then correlated to the MAOA mRNA expression levels from each sample (D) and was significantly correlated (p=0.024) with a correlation co-efficient of r= −0.59696. The invasive capacity of Mz-pCMV6 and Mz-MAOA+ cells was assessed using a commercially available invasion assay. The invasion index was determined as the percentage of invading cells in the invasion chamber compared to the invading cells in the control chambers (E). Data are expressed as average ± SD (*p<0.05).
The correlation analysis described above suggested an association between MAOA expression and tumor invasion. Therefore, we assessed the invasive properties of the Mz-MAOA+ cells compared to the mock-transfected Mz-pCMV6 and found that Mz-MAOA+ cells had a reduced invasive index (Figure 6E and Supplemental Figure S3) suggesting that MAOA expression plays a role in the invasive properties of cholangiocarcinoma.
DISCUSSION
The major findings of this study relate to the mechanism by which MAOA expression is suppressed in cholangiocarcinoma and its clinicopathological significance. We demonstrated that (i) low MAOA immunoreactivity correlates with increased invasiveness, low tumor differentiation and poor survival, (ii) the suppression of MAOA can be attributed to coordinated promoter hypermethylation and IL-6-mediated inhibition of SP-1 transcriptional activity, and (iii) restoration of MAOA has growth suppressing effects and reduces the invasiveness of cholangiocarcinoma cells in vitro. Taken together, these data suggest that MAOA expression may be useful as a prognostic marker for cholangiocarcinoma progression and efforts to modulate MAOA expression may prove useful in the treatment of cholangiocarcinoma.
We have previously shown that MAOA expression is suppressed in cholangiocarcinoma cell lines and in a limited number of tumor biopsy samples (3). The consequences of this suppression, together with an overexpression of the synthesis enzymes, is an increased secretion of the biogenic amines serotonin (1) and dopamine (4) that can be detected in the bile of cholangiocarcinoma patients. Both serotonin and dopamine have subsequent growth-promoting effects and blocking the synthesis of these two compounds inhibits cholangiocarcinoma growth (3, 4). In support of our findings that MAOA expression is suppressed in cholangiocarcinoma, many other neuroendocrine tumors displaying dysregulated serotonin synthesis and secretion often have a concomitant decrease in the expression of MAOA (26). In a normal cell, these amine oxidases exert an antiproliferative effect, more than likely because the products of amine oxidation: aldehydes, hydrogen peroxide and other reactive oxygen species are cytotoxic (26–28). Because the expression of such amine oxidases (including MAOA) is suppressed in certain tumor cells, the potential cytotoxic, antiproliferative effects of amine oxidation are bypassed (26, 27), in addition to the mitogenic effects of the accumulating serotonin and dopamine. Indeed, our data indicates that restoration of MAOA expression in cholangiocarcinoma not only reduces serotonin secretion from these cells, but also slows tumor growth and inhibits the invasive properties of these cells.
Here we demonstrate that the MAOA promoter is hypermethylated in cholangiocarcinoma and that this hypermethylation is in part, responsible for the decreased MAOA expression. Our identification of two putative CpG islands within the MAOA promoter is supported by recent data indicating that epigenetic control of MAOA through these two CpG islands may be responsible for the functional polymorphisms observed in the brain (29). While the methylation levels demonstrated in the current study significantly correlated with MAOA expression, the correlation coefficient was still relatively low suggesting that other factors were contributing to the suppression of MAOA expression. Our data suggest that another distinct contributing factor is IL-6 signaling.
IL-6 production is upregulated in cholangiocarcinoma, which is consistent with the long-standing association between chronic inflammation and the neoplastic transformation of cholangiocytes (10, 11). IL-6 enhances cholangocarcinoma growth by altering gene expression in an autocrine manner (10, 11) and can regulate promoter methylation of a number of genes, such as EGFR, Caspase 8, and Survivin in a manner that promotes survival and growth of the tumor cell (13). The data presented here describe a role for IL-6 signaling in MAOA expression via a pathway distinct from hypermethylation. Indeed, our data suggest that IL-6 signaling may increase the association of the R1 repressor with the MAOA promoter thereby preventing access of SP-1 to its consensus sequence. R1 repressor is a novel regulator of MAOA expression (9) although the mechanisms controlling R1 repressor activity are largely unknown. Furthermore, the mechanism by which IL-6 signaling, in particular, may influence R1 repressor function is unclear. R1 repressor can be upregulated by the oncogene c-myc (28) after which, c-myc co-localizes and interacts with R1 repressor (28). IL-6 signaling has previously been shown to upregulate c-myc expression in cancer cells (30), therefore it is conceivable that IL-6 is modulating R1 repressor function via a c-myc-dependent pathway in cholangiocarcinoma cells. Indeed c-myc expression is upregulated in cholangiocarcinoma tissue and correlates with tumor differentiation (3131), thus supporting our current hypothesis.
In conclusion, the data presented here indicate a strong correlation between MAOA expression and certain pathophysiological parameters of both ICC and Klatskin tumors. Patients with tumors expressing higher levels of MAOA had a better prognosis than those with low MAOA expression. We demonstrated that the MAOA promoter region was hypermethylated at CpGI28. Though there was a correlation between the degree of methylation and MAOA expression, the correlation was not so strong as to exclude the possibility of a second independent mechanism for the suppression of MAOA. We demonstrated that IL-6 signaling can also suppress MAOA expression via the modulation of the R1 repressor/SP-1 balance, and that blocking both the hypermethylation and IL-6-mediated events could restore MAOA expression in a cholangiocarcinoma cell line back to the levels observed in a non-malignant cholangiocyte cell line. These data are summarized in Supplemental Figure S4. Lastly, restoration of MAOA expression in cholangiocarcinoma cells inhibited tumor growth and decreased the invasive properties of these cells. Taken together, our data suggest that MAOA may be a useful prognostic marker in the management of cholangiocarcinoma, and that therapies designed to increase MAOA expression and/or decrease serotonin and dopamine production might prove beneficial for the treatment of cholangiocarcinoma.
Supplementary Material
Acknowledgments
Grant support: These studies were supported by an American Cancer Society Research Scholar award (RSC118760), an NIH K01 award (DK078532) and an NIH R03 award (DK088012) to Dr. DeMorrow and a state scholarship of China Scholarship Council to Dr. Huang (2009638036).
Abbreviations
- 5-aza
5-aza-2′-deoxycytidine
- DAPI
4'6-diamidino-2-phenylindole
- GAPDH
Glyceraldehyde phosphate dehydrogenase
- HIBEC
human intrahepatic cholangiocyte cells
- ICC
intrahepatic cholangiocarcinoma
- IL-6
interleukin-6
- MAOA
monoamine oxidase A
- shRNA
small hairpin RNA
- PCNA
Proliferating cellular nuclear antigen.
Footnotes
Supplementary information is available at Laboratory Investigation’s website.
References
- 1.Alpini G, McGill JM, LaRusso NF. The pathobiology of biliary epithelia. Hepatology. 2002;35(5):1256–1268. doi: 10.1053/jhep.2002.33541. [DOI] [PubMed] [Google Scholar]
- 2.Sirica AE. Cholangiocarcinoma: molecular targeting strategies for chemoprevention and therapy. Hepatology. 2005;41(1):5–15. doi: 10.1002/hep.20537. [DOI] [PubMed] [Google Scholar]
- 3.Alpini G, Invernizzi P, Gaudio E, et al. Serotonin metabolism is dysregulated in cholangiocarcinoma, which has implications for tumor growth. Cancer research. 2008;68(22):9184–9193. doi: 10.1158/0008-5472.CAN-08-2133. [DOI] [PMC free article] [PubMed] [Google Scholar]
- 4.Coufal M, Invernizzi P, Gaudio E, et al. Increased local dopamine secretion has growth-promoting effects in cholangiocarcinoma. International journal of cancer Journal international du cancer. 2010;126(9):2112–2122. doi: 10.1002/ijc.24909. [DOI] [PMC free article] [PubMed] [Google Scholar]
- 5.Francis H, Demorrow S, Venter J, et al. Inhibition of histidine decarboxylase ablates the autocrine tumorigenic effects of histamine in human cholangiocarcinoma. Gut. 2011 doi: 10.1136/gutjnl-2011-300007. [DOI] [PMC free article] [PubMed] [Google Scholar]
- 6.Hendriks RW, Chen ZY, Hinds H, Schuurman RK, Craig IW. An X chromosome inactivation assay based on differential methylation of a CpG island coupled to a VNTR polymorphism at the 5' end of the monoamine oxidase A gene. Hum Mol Genet. 1992;1(3):187–194. doi: 10.1093/hmg/1.3.187. [DOI] [PubMed] [Google Scholar]
- 7.Pinsonneault JK, Papp AC, Sadee W. Allelic mRNA expression of X-linked monoamine oxidase a (MAOA) in human brain: dissection of epigenetic and genetic factors. Hum Mol Genet. 2006;15(17):2636–2649. doi: 10.1093/hmg/ddl192. [DOI] [PubMed] [Google Scholar]
- 8.Zhu QS, Chen K, Shih JC. Bidirectional promoter of human monoamine oxidase A (MAO A) controlled by transcription factor Sp1. J Neurosci. 1994;14(12):7393–7403. doi: 10.1523/JNEUROSCI.14-12-07393.1994. [DOI] [PMC free article] [PubMed] [Google Scholar]
- 9.Chen K, Ou XM, Chen G, Choi SH, Shih JC. R1, a novel repressor of the human monoamine oxidase A. J Biol Chem. 2005;280(12):11552–11559. doi: 10.1074/jbc.M410033200. [DOI] [PMC free article] [PubMed] [Google Scholar]
- 10.Park J, Tadlock L, Gores GJ, Patel T. Inhibition of interleukin 6-mediated mitogen-activated protein kinase activation attenuates growth of a cholangiocarcinoma cell line. Hepatology. 1999;30(5):1128–1133. doi: 10.1002/hep.510300522. [DOI] [PubMed] [Google Scholar]
- 11.Yokomuro S, Tsuji H, Lunz JG, 3rd, et al. Growth control of human biliary epithelial cells by interleukin 6, hepatocyte growth factor, transforming growth factor beta1, and activin A: comparison of a cholangiocarcinoma cell line with primary cultures of non-neoplastic biliary epithelial cells. Hepatology. 2000;32(1):26–35. doi: 10.1053/jhep.2000.8535. [DOI] [PubMed] [Google Scholar]
- 12.Hodge DR, Xiao W, Clausen PA, Heidecker G, Szyf M, Farrar WL. Interleukin-6 regulation of the human DNA methyltransferase (HDNMT) gene in human erythroleukemia cells. J Biol Chem. 2001;276(43):39508–39511. doi: 10.1074/jbc.C100343200. [DOI] [PubMed] [Google Scholar]
- 13.Wehbe H, Henson R, Meng F, Mize-Berge J, Patel T. Interleukin-6 contributes to growth in cholangiocarcinoma cells by aberrant promoter methylation and gene expression. Cancer Res. 2006;66(21):10517–10524. doi: 10.1158/0008-5472.CAN-06-2130. [DOI] [PubMed] [Google Scholar]
- 14.Knuth A, Gabbert H, Dippold W, et al. Biliary adenocarcinoma. Characterisation of three new human tumor cell lines. J Hepatol. 1985;1(6):579–596. doi: 10.1016/s0168-8278(85)80002-7. [DOI] [PubMed] [Google Scholar]
- 15.Shimizu Y, Demetris AJ, Gollin SM, et al. Two new human cholangiocarcinoma cell lines and their cytogenetics and responses to growth factors, hormones, cytokines or immunologic effector cells. Int J Cancer. 1992;52(2):252–260. doi: 10.1002/ijc.2910520217. [DOI] [PubMed] [Google Scholar]
- 16.Miyagiwa M, Ichida T, Tokiwa T, Sato J, Sasaki H. A new human cholangiocellular carcinoma cell line (HuCC-T1) producing carbohydrate antigen 19/9 in serum-free medium. In Vitro Cell Dev Biol. 1989;25(6):503–510. doi: 10.1007/BF02623562. [DOI] [PubMed] [Google Scholar]
- 17.Storto PD, Saidman SL, Demetris AJ, Letessier E, Whiteside TL, Gollin SM. Chromosomal breakpoints in cholangiocarcinoma cell lines. Genes Chromosomes Cancer. 1990;2(4):300–310. doi: 10.1002/gcc.2870020408. [DOI] [PubMed] [Google Scholar]
- 18.Grubman SA, Perrone RD, Lee DW, et al. Regulation of intracellular pH by immortalized human intrahepatic biliary epithelial cell lines. Am J Physiol. 1994;266(6 Pt 1):G1060–1070. doi: 10.1152/ajpgi.1994.266.6.G1060. [DOI] [PubMed] [Google Scholar]
- 19.Frampton G, Invernizzi P, Bernuzzi F, et al. Interleukin-6-driven progranulin expression increases cholangiocarcinoma growth by an Akt-dependent mechanism. Gut. 2012;61(2):268–277. doi: 10.1136/gutjnl-2011-300643. [DOI] [PMC free article] [PubMed] [Google Scholar]
- 20.DeMorrow S, Francis H, Gaudio E, et al. The endocannabinoid anandamide inhibits cholangiocarcinoma growth via activation of the noncanonical Wnt signaling pathway. Am J Physiol Gastrointest Liver Physiol. 2008;295(6):G1150–1158. doi: 10.1152/ajpgi.90455.2008. [DOI] [PMC free article] [PubMed] [Google Scholar]
- 21.DeMorrow S, Glaser S, Francis H, et al. Opposing actions of endocannabinoids on cholangiocarcinoma growth: Recruitment of fas and fas ligand to lipid rafts. J Biol Chem. 2007;282(17):13098–13113. doi: 10.1074/jbc.M608238200. [DOI] [PubMed] [Google Scholar]
- 22.Livak KJ, Schmittgen TD. Analysis of relative gene expression data using real-time quantitative PCR and the 2(-Delta Delta C(T)) Method. Methods. 2001;25(4):402–408. doi: 10.1006/meth.2001.1262. [DOI] [PubMed] [Google Scholar]
- 23.DeMorrow S, Francis H, Gaudio E, et al. Anandamide inhibits cholangiocyte hyperplastic proliferation via activation of thioredoxin 1/redox factor 1 and AP-1 activation. American journal of physiology Gastrointestinal and liver physiology. 2008;294(2):G506–519. doi: 10.1152/ajpgi.00304.2007. [DOI] [PubMed] [Google Scholar]
- 24.Larsen F, Gundersen G, Lopez R, Prydz H. CpG islands as gene markers in the human genome. Genomics. 1992;13(4):1095–1107. doi: 10.1016/0888-7543(92)90024-m. [DOI] [PubMed] [Google Scholar]
- 25.Ou XM, Chen K, Shih JC. Glucocorticoid and androgen activation of monoamine oxidase A is regulated differently by R1 and Sp1. The Journal of biological chemistry. 2006;281(30):21512–21525. doi: 10.1074/jbc.M600250200. [DOI] [PubMed] [Google Scholar]
- 26.Pietrangeli P, Mondovi B. Amine oxidases and tumors. Neurotoxicology. 2004;25(1–2):317–324. doi: 10.1016/S0161-813X(03)00109-8. [DOI] [PubMed] [Google Scholar]
- 27.Toninello A, Salvi M, Pietrangeli P, Mondovi B. Biogenic amines and apoptosis: minireview article. Amino Acids. 2004;26(4):339–343. doi: 10.1007/s00726-004-0080-x. [DOI] [PubMed] [Google Scholar]
- 28.Ou XM, Chen K, Shih JC. Monoamine oxidase A and repressor R1 are involved in apoptotic signaling pathway. Proc Natl Acad Sci U S A. 2006;103(29):10923–10928. doi: 10.1073/pnas.0601515103. [DOI] [PMC free article] [PubMed] [Google Scholar]
- 29.Shumay E, Fowler JS. Identification and characterization of putative methylation targets in the MAOA locus using bioinformatic approaches. Epigenetics : official journal of the DNA Methylation Society. 2010;5(4):325–342. doi: 10.4161/epi.5.4.11719. [DOI] [PMC free article] [PubMed] [Google Scholar]
- 30.Shi Y, Frost P, Hoang B, Benavides A, Gera J, Lichtenstein A. IL-6-induced enhancement of c-Myc translation in multiple myeloma cells: critical role of cytoplasmic localization of the rna-binding protein hnRNP A1. The Journal of biological chemistry. 2011;286(1):67–78. doi: 10.1074/jbc.M110.153221. [DOI] [PMC free article] [PubMed] [Google Scholar]
- 31.Voravud N, Foster CS, Gilbertson JA, Sikora K, Waxman J. Oncogene expression in cholangiocarcinoma and in normal hepatic development. Human pathology. 1989;20(12):1163–1168. doi: 10.1016/s0046-8177(89)80006-1. [DOI] [PubMed] [Google Scholar]
Associated Data
This section collects any data citations, data availability statements, or supplementary materials included in this article.