

Abstract
Object classification can be facilitated if simple diagnostic features can be used to determine class membership. Previous studies have found that simple shapes may be diagnostic for emotional content and automatically alter the allocation of visual attention. In the present study, we analyzed whether color is diagnostic of emotional content and tested whether emotionally diagnostic hues alter the allocation of visual attention. Reddish-yellow hues are more common in (i.e., diagnostic of) emotional images, particularly images with positive emotional content. An exogenous cueing paradigm was employed to test whether these diagnostic hues orient attention differently from other hues due to the emotional diagnosticity. In two experiments, we found that participants allocated attention differently to diagnostic hues than to non-diagnostic hues, in a pattern indicating a broadening of spatial attention when cued with diagnostic hues. Moreover, the attentional broadening effect was predicted by self-reported measures of affective style, linking the behavioral effect to emotional processes. These results confirm the existence and use of diagnostic features for the rapid detection of emotional content.
One of the primary functions of vision is to inform an organism about objects in its immediate surroundings, particularly if the objects are threatening or rewarding (Vuilleumier, 2005). Accordingly, human event-related potential (ERP) studies suggest that the discrimination of object emotionality occurs rapidly, with effects appearing as early as 150 ms from stimulus onset (Junghofer, Bradley, Elbert & Lang, 2001; Codispoti, Ferrari & Bradley, 2007). This places the latency of the visual system’s ability to discriminate emotionality near the lower bound of general object categorization (Johnson & Olshausen, 2003). What strategy does the visual system employ to enable judgments of stimulus emotionality to be performed as quickly as that of object identification? Johnson and Olshausen (2003) observed earlier latencies for EEG components related to visual recognition when stimulus categories possessed low-level diagnostic features, suggesting that the rapidity of emotion discrimination could, in part, be due to the exploitation of simple diagnostic features.
A diagnostic feature is one that occurs more frequently within one particular category than it does within other categories. It is of particular interest when a diagnostic feature is accessible early in the visual stream; this allows information regarding object category to be accessed rapidly, minimizing the need for more time-intensive feature extraction. Discriminations that could be mediated by a simple diagnostic feature are performed faster and more accurately according to behavioral measures (Schyns, 1998; Wurm, Legge, Isenberg & Luebker, 1993; Oliva & Schyns, 2000; Tanaka, Weiskopf & Williams, 2001), as well as by the aforementioned ERP latency measures (Johnson & Olshausen, 2003; see also, Goffaux, Jacques, Mouraux, Oliva, Schyns & Rossion, 2005).
Given the established utility of low-level diagnostic features for neutral object categorization, researchers have sought out diagnostic features that could facilitate the rapid detection of emotional objects. The search for emotionally diagnostic features has focused primarily on downward-pointing V shapes, which are commonly used to convey threat in artistic works (Aronoff, Barclay & Stevenson, 1988; Aronoff, Woike & Hyman, 1992; Aronoff, 2006; Watson, Blagrove, Evans & Moore, 2012). These ‘V’ shapes attract visual attention in search tasks (Larson, Aronoff & Stearns, 2007) and increase activation in the amygdala (Larson, Aronoff, Sarinopoulos & Zhu, 2009), a structure in the limbic system that receives extensive visual input and plays a key role in the detection of emotional objects (Zald, 2003). Emotional diagnosticity also has been proposed for other shape-based features, such as the shape of eye-whites during fearful facial expressions (Whalen et al, 2004) or sharp edges on objects (Bar & Neta, 2007).
The present report tests whether color can also serve as a diagnostic feature for discriminating emotional and non-emotional objects. The motivation for exploring the diagnosticity of hue is two-fold. First, it is simple to quantify which hues are present in an image, so it easy to compare the image statistics for emotional and non-emotional images to determine the feasibility of certain colors as diagnostic features. Secondly, multiple literatures have proposed a deep connection emotional/motivational systems and color processing. The evolution of trichromatic color vision in primates may have been driven by the need for more effective frugivory or folivory (Surridge, Osorio & Mundy, 2003), better discrimination of emotion-induced changes in skin tone (Changizi, Zhang & Shimojo, 2006), or gender discrimination (Nestor & Tarr, 2008). Each of these theories suggest a deep connection between primate color vision and the emotional systems used for reward-detection and/or social interactions. The color red is of particular import to these theories, consistent with the use of red as a social signal throughout the animal kingdom. Displays for determining social dominance among mandrills (Setchell & Wickings, 2005) and finches (Pryke & Griffith, 2006) rely on the display and detection of red, where as some Macaques (Waitt et al, 2003) and sticklebacks (Milinski & Bakker, 1990) use red displays to communicate mate quality or availability.
The importance of red extends to humans as well; Berlin and Kay’s (1969) seminal studies explored the color terms used in various languages, and found that languages would add new color terms in a particular order. Languages with only two color categories would include terms for ‘dark’ and ‘light’, however a language with three or more color terms always include ‘dark’, ‘light’, and ‘red’. Not only do human languages appear to value the inclusion of red, western cultures place an emphasis on red by forming explicit associations between red and dominance or aggression (Little & Hill, 2007). Moreover, preferences for designs composed of predominantly red and yellow are stronger in people with low need for achievement, whereas preferences for designs composed predominantly of blue and green are stronger in people with high need for achievement (Green & Knapp, 1959; Knapp, 1962), suggesting that color is associated with motivation. Red is also associated with failure-related words (Moller, Elliot & Maier, 2009), particularly when encountered in an achievement-related context (Elliot & Maier, 2007). Participants physically avoid tests that are in red folders (Elliot, Maier, Binser, Friedman & Pekrun, 2009), and performance on tests is impaired after briefly viewing the color red (Elliot, Maier, Moller, Friedman & Meinhardt, 2007) or even reading the word red (Lichtenfield, Maier, Elliot & Pekrun, 2009). More contentious lines of research purport that athletes wearing red can augment their dominance signals, resulting in a statistically significant increase in the probability of victory (Hill & Barton, 2005; Attrill, 2008) or bias referees to make calls in their favor (Hagemann, Strauss & Leiβing, 2008).
This experiment explores the emotional diagnosticity of color by testing differences in the color content of emotional and non-emotional images from the International Affective Picture System (IAPS; Lang, Bradley & Cuthbert, 1995). If this image analysis identifies emotionally diagnostic hues, an attentional cueing task will be used to test whether the particular colors implicated in the image analysis automatically affect the orientation of visual attention when they are presented as simple color patches.
Analysis of Color Histograms in the International Affective Picture System (IAPS)
The diagnosticity of color for emotional images was tested using IAPS images. The IAPS is a database of emotion-provoking images used frequently in psychological studies because they have been thoroughly rated along the affective dimensions of arousal (intensity of emotional response) and valence (pleasantness or unpleasantness). The colors for each image were extracted and summarized in a color histogram, and diagnostic colors were identified as those that were significantly more common in emotional images than in neutral images.
Method
Image selection
Three hundred and sixty color images with a relatively simple figure-ground composition were selected from the IAPS (the slide numbers are listed in Appendix A). The sample had equal numbers of positive (e.g., erotica, babies and cute animals, etc.), negative (e.g., mutilations, animal and human threats, contamination, etc.) and neutral (e.g., household objects, plants, non-provocative people, etc.) images. These particular images were selected to equate the mean arousal ratings for positive and negative images and ensure that the content of each image was rapidly identifiable for use in a different, unpublished experiment. On the normative 9-point scale, the mean valence of positive (MPos,Val = 6.6) and negative (MNeg,Val = 2.8) images were significantly different from the neutral images (MNeu,Val = 5.4, |t|s > 8.78, ps < .001). The mean arousal for positive (MPos,Aro = 5.2) and negative (MNeg,Aro = 6.0) images were greater than neutral images (MNeu,Aro = 3.4; ts > 16.2, ps < .001), but not different from one another (t(238) = −0.86, p = 0.39).
Image processing and analysis
All image processing was performed in Matlab (The Mathworks; Natick, MA). Each image was converted from the original RGB (red, green, blue) colorspace into a space that encoded image intensity (I) and two dimensions for red-green and blue-yellow color opponency (RG, BY). This space, used successfully by Walther (2006) for modeling stimulus-driven salience, is a biologically-inspired1 color representation scheme that allows hue to be mostly independent from brightness. The original RGB color coordinates (r, g and b) were each rescaled to the interval [0,1], and used to form a new color representation defined as:
The I, RG, and BY values were calculated for each pixel. The RG and BY values from pixels with sufficient brightness (I > 0.5) were recorded, and binned to fit in a two-dimensional (RG by BY) 11-by-11 histogram for each image. The histogram frequencies for each image were transformed into relative frequencies by dividing by the total number of pixels in the histogram.
Univariate t-tests were performed on log-transformed relative frequencies to test whether a color occurred more or less frequently between two groups. The false discovery rate (FDR) was held at 0.05 (Genovese, Lazar & Nichols, 2002) to control for multiple comparisons. Diagnostic hues were identified for several different comparisons using different contrasts: emotional versus non-emotional, positive versus neutral, negative versus neutral and positive versus negative.
Results
Effect of emotion content on color histograms
Emotional images, collapsed across positive and negative valence, have significantly more reddish-yellow pixels than neutral images (Figure 1). Six histogram bins surpassed the FDR threshold of uncorrected p = .003, with the peak effect being t(358) = 4.54 (uncorrected p < .001). A follow-up analysis using the HSV colorspace replicated this effect2, indicating that the effect is not dependent upon using the RGB colorspace.
Figure 1.

Effect of emotional content on color-histograms. The histograms indicate the log-frequency of colors in emotional (A) and non-emotional (B) images, with the axes of each histogram indicating the red-green and blue-yellow dimensions of color. (C) The histogram depicts t-scores for the difference between the emotional and non-emotional color histograms, and (D) depicts regions in that histogram reaching significance. Significant bins are depicted as black, and the significance threshold was determined by setting the false discovery rate at .05.
This effect of emotional content on the color-histograms was driven more by positive images than by negative images, with the positive versus neutral contrast reaching significance in nine histogram bins in the red-yellow quadrant (FDR threshold p < .004; peak effect t(238) = 6.54, uncorrected p < .001). The negative versus neutral contrast failed to reach the FDR significance threshold (uncorrected p < .004), but the peak difference approached significance (t(238) = 2.80, uncorrected p = .006). In the positive versus negative contrast, significantly more red-yellow color was present in positive images than in negative images for three histogram bins (FDR threshold p < .001; peak effect t(238) = 4.92, uncorrected p < .001).
Relationships between Diagnostic Hues and Emotional Ratings in Neutral Images
The differences in color histograms for emotional and neutral images may be due to the particular emotional categories used in the analysis – reddish-yellow hues could arise from skin tones on nude figures or blood from the surgery/accident victims. An additional analysis was performed to test whether the effect of more reddish-yellow hues in emotional images was because emotional images were more likely to contain human skin (e.g., erotica, surgery photos). Furthermore, the relationship between the diagnostic hue and emotionality was tested using images that were not overtly emotional by calculating the correlation between the amount of the diagnostic reddish hue in each neutral image and the normative emotional ratings for each neutral image.
Method
Image selection
The analysis was limited to the IAPS images from the original histogram analysis, and images were further categorized based on whether any human skin was visible.
Image processing and analysis
The diagnostic hue was defined as any bins in the color histogram that were significant in the emotional vs. non-emotional contrast from the previous analysis plus any adjacent bins that met p < 0.05. The average value across the resulting 14-bin “emotionally diagnostic” region (Figure 2a) was used to calculate the amount of diagnostic hue in each image. A two-way ANOVA tested the main effect of image emotionality (i.e., emotional or neutral) and the presence of skin (i.e. has skin or does not) on the amount of this diagnostic hue in a particular image. The amount of diagnostic hue in each image was also correlated with each image’s rating for valence and arousal using Spearman’s rank-order correlation. The additional scales of image positivity (Valence + Arousal) and negativity (−[Valence − Arousal]) were also created, as is occasionally done to form more intuitive interpretation of positivity and negativity results (Watson, Clark & Tellegen, 1988).
Figure 2.
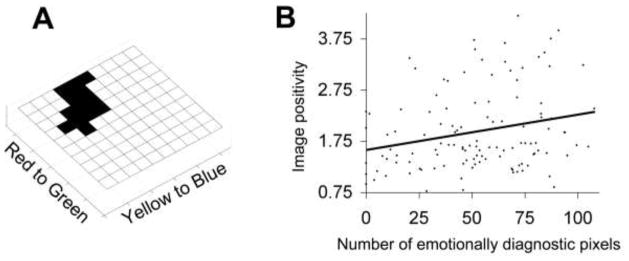
The relationship between red hues and positivity in neutral images. (A) The histogram depicts the region defined as the diagnostic hue by the Emotional versus Non-emotional contrast. (B) The relationship between the number of emotionally diagnostic pixels for a neutral image and its positivity rating.
Results
The proportion of images that depicted any human skin did not differ between emotional and neutral images (60.4% and 60.0%, respectively; χ2(1, N = 360) = 0.02, p = 0.90). The two-way ANOVA confirmed that emotional images contained more of the diagnostic hue than neutral images (F(1,356) = 34.82, p < 0.001), but there was no difference in the amount of the diagnostic hue between images that contained skin and those that did not (F(1,356) = 1.73, p = 0.19). However, the interaction between emotionality and the presence of skin was significant (F(1,356) = 8.9, p < 0.01), such that the effect of emotionality on the amount of this hue present was larger among images that did not contain skin.
The amount of diagnostic hue in a non-emotional, neutral image positively correlates with arousal (ρ(118) = 0.20, p = .03) and valence (ρ(118) = 0.20, p = .03) ratings. This results in a significant positive correlation between the amount of the diagnostic hue in an image and its positivity (ρ(118) = 0.24, p < .01; Figure 2b), but not between the amount of hue and image negativity (ρ(118) = −0.06, p = .52).
Discussion of Image Analysis
The emotional images in our sample of the IAPS dataset had more reddish-yellow hues than neutral images, driven primarily by an increase in the frequency of reddish-yellow hues for positive images. This effect is not due to more skin in the emotional images, and is actually greater when restricted to emotional and neutral images that do not contain skin. Moreover, when the analysis is restricted to the non-emotional, neutral images, images with more of these reddish-yellow hues were rated as being more arousing and positive.
One limitation of our analysis was that analyzing 360 images of the IAPS image set may not be sufficient for accurate generalization to the variety of stimuli encountered in the real world. This concern is partially ameliorated given that reddish hues were expected given previous research on color as an important signal for animals and humans. However, drawing conclusions about emotional diagnosticity from an image analysis is problematic no matter how large and inclusive the image set becomes. At best, an image analysis can only tell us that a particular feature (i.e., the reddish-orange hue) is capable of distinguishing various stimuli (i.e., emotional versus non-emotional) but not whether the human visual system actually exploits this feature. The preceding analyses have identified a candidate low-level emotionally diagnostic feature, but the following sections provide the behavioral experimentation to test whether this feature affects behavior.
Experiment 1: Effects on Attention from an Emotionally Diagnostic Hue
In order to test whether an emotionally diagnostic hue identified in the analysis of IAPS images is exploited by the visual system, the exogenous cueing paradigm (Posner & Peterson, 1990) was administered. This task requires participants to report whether a small white target appears in the left or right visual field, however, a cue immediately precedes the target. The cue can appear in either the same visual field (a valid cue) or the opposite visual field (an invalid cue) as the target appears. Attention is oriented toward the cue, resulting in faster and less error-prone responding to validly cued trials and slower and more error-prone responses for invalidly cued trials; these two effects are respectively referred to as attentional capture and attentional holding. By comparing the response time and accuracy of valid and invalid trials, the experimenter can quantify how much attention was allocated toward the cue. In Experiment 1, the cues were colored squares. By comparing the responses of cueing with the diagnostic hue to cueing with other, non-diagnostic hues, one can determine whether more or less attention is allocated to the diagnostic hue than to the other hues.
Some previous research would be in line with the prediction that the diagnostic hue will capture and/or hold attention to a greater degree than non-diagnostic hues. Cues that have acquired negative valence through fear conditioning demonstrate greater attentional capture and holding (Koster, Crombez, Van Damme, Verschuere & De Houwer, 2004). Downward pointing ‘V’ shapes are detected faster in visual search tasks than upward pointing ‘V’ shapes (Larson et al., 2007). This is consistent with evidence that threatening faces are located faster than other kinds of faces in visual search tasks (Öhman, Flykt & Esteves, 2001).
Other considerations lead to the prediction that the diagnostic hue will broaden attention to a greater degree than non-diagnostic hues, in part because the diagnostic hue implicated in the image analysis was more diagnostic for positive images than for negative images. When an organism encounters objects that are positively valenced and encourage approach-related behavior, it has been shown that attention is broadened when the positive stimuli have low motivational intensity but it is narrowed when the positive stimuli have high motivational intensity (Gable & Harmon-Jones, 2008, 2010). Presumably, a diagnostic hue would have relatively low motivational intensity when presented as an isolated color patch, without additional corroborating information about valence. In addition, the Gable and Harmon-Jones studies used stimuli that are unambiguous and whose emotional value is easily discerned (e.g., whole IAPS images). In contrast, an isolated diagnostic hue indicates only the possibility of an emotional object being present, and the organism is faced with a great deal of uncertainty about what the object is or whether approach-related behavior is appropriate. Although the reddish-orange hue occurs more frequently for positive objects in the IAPS set, this particular feature is not so diagnostic that it alone can be used to make emotional discriminations with a high degree of certainty (e.g., whether it is positive or negative, or whether it should be approached or avoided). Whalen (1998) suggests that a primary function of the amygdala is to resolve ambiguity about emotional objects by increasing vigilance. So, rather than restrict attention to a weakly diagnostic feature (e.g. a reddish-orange hue), a more beneficial strategy would be to broaden attention to encourage further exploration of the environment. Specifically, one may find reduced capture and/or holding with the diagnostic hue in the exogenous cueing paradigm. This would manifest itself as a smaller difference in response times or error rates between invalid and valid trials when the cue is the diagnostic hue compared with when it is a non-diagnostic hue.
In addition, a pattern of attentional broadening-like effects could be interpreted as reflecting competition between two tasks – the processing of emotional stimuli and the detection of the target. The neural circuitry in frontal cortex for processing approach and withdrawal related affect are localized to the left and right hemispheres respectively (Davidson, 1993). Even though these asymmetries exist in frontal cortex, they can still be observed behaviorally with a divided visual field paradigm. Maxwell, Shackman and Davidson (2005) instructed participants to perform a demanding go-nogo task with peripherally presented targets while task-irrelevant emotional faces were presented centrally. When the targets were presented to the right visual field (RVF) and hence projected directly to the left hemisphere (LH), performance was impaired when the centrally presented face was happy. When targets were presented in left visual field (LVF, i.e., right hemisphere, RH), performance was impaired when the centrally presented face was angry. This suggests that the processing of emotional facial expressions occurs involuntarily and in an asymmetrical manner across hemispheres, resulting in a competition with the go-nogo task that decreases performance. By this account, presenting an emotionally diagnostic hue directly to one hemisphere would engage that hemisphere’s emotional systems, and slow responses to targets presented to the same hemisphere (i.e., in the valid trials). In addition, slowing processing in the cued hemisphere may have the indirect effect of enabling enhanced processing of the target in the un-cued hemisphere, resulting in enhanced performance in invalidly cued trials.
In order to test these hypotheses regarding possible effects on attention from an emotionally diagnostic hue, the exogenous cueing paradigm was employed with a variety of hues serving as attentional cues.
Method
Participants
Fifty naïve right-handed participants (31 female, mean age = 20.6 SD = 3.1) with normal or corrected-to-normal vision were recruited from the University of Minnesota community in exchange for class credit or $10 cash. The study only recruited right-handed participants because they generally have more consistent patterns of cerebral asymmetry (Lake & Bryden, 1976).
Materials
The colors used for attentional cueing were selected so that the reddish-yellow hue identified in the IAPS analysis was Hue 1, and Hues 2–8 are equally spaced along the hue (H) dimension of HSV (i.e., Hue, Saturation, Value) colorspace (Table 1). Hue 9 was the grayscale equivalent to hues 1–8, created by setting color saturation to zero. Trials using this cue were included only to enhance the salience of the color cues in other trials, and thus they were not included in the analyses of the trials with colored cues. Table 2 has the measurements of each hue’s luminance and chromaticity.
Table 1.
Specification of Colors used in Experiments One and Two
| Colorspace parameter | - | - | - | Hue Number | - | - | - | ||
|---|---|---|---|---|---|---|---|---|---|
|
| |||||||||
| 1a | 2 | 3 | 4 | 5 | 6 | 7 | 8 | 9 | |
| Experiment 1 | |||||||||
| H | 0.05 | 0.175 | 0.3 | 0.425 | 0.55 | 0.675 | 0.8 | 0.925 | 1 |
| S | 1 | 1 | 1 | 1 | 1 | 1 | 1 | 1 | 0 |
| V | 0.75 | 0.75 | 0.75 | 0.75 | 0.75 | 0.75 | 0.75 | 0.75 | 0.75 |
|
| |||||||||
| Experiment 2 | |||||||||
| L* | 45.08 | 45.08 | 45.08 | 45.08 | 45.08 | 45.08 | 45.08 | 45.08 | 45.08 |
| a* | 52.90 | −3.20 | −57.50 | −78.00 | −52.90 | 3.20 | 57.50 | 78.00 | 0.00 |
| b* | 57.50 | 78.00 | 52.90 | −3.20 | −57.50 | −78.00 | −52.90 | 3.20 | 0.00 |
Note: H, S, and V indicate coordinates in HSV colorspace. L*, a*, and b* indicate coordinates in L*a*b* colorspace.
Hue 1 is the emotionally diagnostic hue identified in Experiment 1, and is identical in Experiments 2 and 3.
Table 2.
Physical Measurements of Colors used in Experiments One and Two
| Colorspace parameter | - | - | - | Hue Number | - | - | - | ||
|---|---|---|---|---|---|---|---|---|---|
|
| |||||||||
| 1a | 2 | 3 | 4 | 5 | 6 | 7 | 8 | 9 | |
| Experiment 1 | |||||||||
| L | 20.5 | 58.7 | 45.9 | 47.6 | 29.1 | 8.3 | 17.3 | 17.1 | 65.5 |
| x | 0.561 | 0.404 | 0.305 | 0.253 | 0.188 | 0.156 | 0.251 | 0.465 | 0.289 |
| y | 0.381 | 0.512 | 0.586 | 0.447 | 0.211 | 0.080 | 0.134 | 0.264 | 0.305 |
|
| |||||||||
| Experiment 2 | |||||||||
| L | 20.5 | 21.2 | 21.4 | 25.1 | 29.1 | 26.3 | 23.3 | 21.8 | 21.1 |
| x | 0.561 | 0.429 | 0.305 | 0.232 | 0.184 | 0.169 | 0.254 | 0.447 | 0.295 |
| y | 0.381 | 0.481 | 0.573 | 0.347 | 0.194 | 0.141 | 0.157 | 0.251 | 0.307 |
Note: L is the luminance measured in cd/m2, x and y are the dimensionless chromaticity coordinates for the CIE colorspace.
Design
A 2 {valid, invalid cue} by 9 {cue color} factorial design was used, with 40 trials per hue (30 were validly cued, 10 invalidly). Trials were presented pseudo-randomly with no more than three consecutive trials having the same cue color, cue visual field or target visual field, and no more than two consecutive invalidly cued trials.
Procedure
The exogenous cueing task was presented using E-Prime (Psychology Software Tools; Pittsburgh, PA) on a Windows PC with a 17-inch CRT monitor and 60 Hz screen refresh. A chin rest was used to ensure a viewing distance of 76.2 cm (30 inches) participants.
Each trial began with a central fixation cross presented against a black background for 500 ms. Following fixation, attention was cued by a colored square (3.8 by 3.8 degrees). The attentional cue appeared in the left or right hemifield for 187 ms. Immediately following cue offset, the white target square (1.38 by 1.38 degrees) appeared in the left or right visual hemifield for 100 ms and then disappeared. Participants indicated in which hemifield the target appeared by pressing ‘a’ or ‘l’ on a QWERTY keyboard to indicate with their left and right hands to indicate LVF or RVF, respectively. Cues and targets appeared such that their center was 7.7 degrees to the left or right of the central fixation point. A blank display was presented during 1 s inter-trial intervals.
Data reduction and analytic strategy
For the response time analysis, trials with incorrect responses or outlier response times (RT) were dropped. Outliers were detected by log-transforming each RT, converting them to z-scores within each participant and condition, and rejecting trials with an absolute z-score greater than 2.5 (Ratcliff, 1993).
Results from the 8 non-diagnostic hue conditions were collapsed, and the analyses proceeded as 2 {valid, invalid cue} × 2 {diagnostic, non-diagnostic hue} × 2 {LVF, RVF target} repeated measures ANOVAs. Two ANOVA analyses were performed with different dependant variables, one using the log-transformed RTs and the one with arcsine transformed error-rates.
Results
Response times
Responses were faster in validly cued trials (320 ms) than in invalidly cued trials (363 ms; F(1,49) = 50.58, p < 0.001), as depicted in Figure 3A. Main effects of hue diagnosticity and target visual field indicated slower responses following diagnostic cues (345 ms) than following non-diagnostic cues (340 ms; F(1,49) = 7.13, p = 0.01) and slower responses to LVF/RH targets (346 ms) than to RVF/LH targets (339 ms; F(1,49) = 4.85, p = 0.03).
Figure 3.

Main results from Experiment 1. (A) Mean response times (ms) as a function of cue validity, target visual field, and hue diagnosticity of the cue. (B) Mean error rates as a function of cue validity, target visual field and hue diagnosticity of the cue. Error bars depict within subject error.
More important, the ANOVA on response times indicated a significant hue-by-validity interaction (Figure 3A; F(1,49) = 5.29, p = 0.03), in a pattern indicating significantly less attentional capture and/or holding from diagnostic cues than from non-diagnostic cues. Simple effects analyses indicated that responses in the valid trials were significantly slower when the diagnostic hue was the cue (325 ms) than when non-diagnostic hues were the cues (316 ms; F(1,49) = 18.75, Bonferroni corrected p < 0.004), whereas responses in the invalid trials did not differ as a function of type of hue (F(1,49) = 0.23, Bonferroni corrected p = 0.98; 364ms for diagnostic, 363ms for non-diagnostic). No other interactions were significant in this analysis (ps > .24).
Error rates
The main effect of validity was significant, such that fewer errors were made in valid trials (0.04) than in invalid trials (0.12; F(1,49) = 6.49, p = 0.01; see Figure 3B). The main effect of hue diagnosticity was significant (F(1,49) = 11.94, p < 0.001), with fewer errors made following the diagnostic hue (0.04) than following the non-diagnostic hues (0.06).
More important, the hue-by-validity interaction (Figure 3B; F(1,49) = 7.00, p = 0.01) was significant, again in a pattern indicating significantly less attentional capture and/or holding from diagnostic cues than from non-diagnostic cues. Simple effects analyses indicated that responses in the invalid trials were significantly less error-prone when the diagnostic hue was the cue (error rate of 0.10) than when non-diagnostic hues were the cues (error rate of 0.14; F(1,49) = 12.06, Bonferroni corrected p = 0.04, whereas responses in the valid trials did not differ as a function of type of hue (F(1,49) = 0.54, Bonferroni corrected p = 0.92; error rate of 0.04 for both diagnostic and non-diagnostic). No other interactions were significant in this analysis (ps > 0.724).
Discussion
The reddish-yellow hue associated with emotional content in the IAPS image set was less effective at capturing and/or holding visuospatial attention than other hues. After viewing the emotionally diagnostic hue, responses were slowed if it was a valid trail and the target appeared in the cued hemifield (i.e., reduced attentional capture) and more accurate if it was an invalid trial and the target appeared in the opposite hemifield (i.e., reduced attentional holding). This is consistent with the hypotheses that the diagnostic hue causes attentional broadening or competition between emotion-related and task-related processes.
These results complement the results from the Larson et al. (2007) study, in which search times were faster for the downward pointing ‘V’ than for other stimuli in a visual search task. One key difference between that study and ours is that the features used by Larson et al (2007) were subjectively rated as threatening, whereas the diagnostic hue used in the present study was demonstrated to be more diagnostic for positive images than for negative images. Thus, the motivational processes that were engaged may have differed between the two studies. The processing of positive affect appears to have a different effect on cognitive processes than negative affect, as theorized in Fredrickson’s broaden-and-build theory of positive affect (1998, 2004). Accordingly, positive mood broadens attention and engages action repertoires such as more frequent and more peripheral saccadic eye movements (Wadlinger & Isaacowitz, 2006). The second key difference is the use of a visual search task versus an attentional cueing task. Visual search paradigms involve presenting all of the targets and distractors simultaneously, making it difficult to determine whether the effects are due to the finding the targets, ignoring the distractors, or both. For example, if an experiment indicates lower search-times for emotional (or emotionally diagnostic) targets, it could be that the emotional object automatically attracts attention or that the participant is faster at disengaging from the non-emotional distractor stimuli. Additionally, the visual search task requires that participants explicitly attend to and process the potentially diagnostic feature, whereas the exogenous cueing task does not and hence may be sensitive enough to observe more implicit forms of attentional processing.
Experiment 2: Effects on Attention from an Emotionally Diagnostic Hue using the L*a*b* Colorspace
The previous experiment demonstrated that the emotionally diagnostic hue cues attention differently than non-diagnostic or control hues. However, to increase confidence that the effects observed in Experiment 1 are due to the diagnosticity of the reddish-orange hue, and not some other perceptual property of that stimulus, we conducted a follow-up experiment to replicate and extend the finding using additional control hues. The control hues in Experiment 1 were defined by varying the H dimension (Hue angle) of the HSV colorspace while holding S and V (Saturation and Value) constant. The control hues in Experiment 2 were defined in the L*a*b* colorspace (Olivia & Schyns, 2000). This colorspace is spanned by three dimensions (L*, a*, and b*): L* controls the lightness of the hue, a*and b* adjust the color. Gray occurs when a*=b*=0, and the saturation of a color is proportional to the distance from gray (i.e. a*2 + b*2). The primary benefit of using the L*a*b* colorspace is perceptual uniformity, meaning that the distance between points in this colorspace are proportional to the perceived differences in color by humans.
Method
Participants
Fifty-one naïve right-handed participants (39 female, mean age = 19.6 SD = 3.2) with normal or corrected-to-normal vision were recruited from the University of Minnesota community in exchange for class credit.
Materials
For Experiment 2, the non-diagnostic hues were selected from the L*a*b* colorspace. The diagnostic hue – hue 1 – was transformed into L*a*b* coordinates, and a new set of distractor hues were created. The L* value of the diagnostic hue was used for all additional colors. Hues 2–8 were selected to have equal saturation to hue 1 and spaced at equal intervals in the (a*,b*) plane (Table 1). Hue 9 was the grayscale equivalent to hues 1–8 (i.e. a* = b* = 0). Table 2 has the measurements of each hue’s luminance and chromaticity.
Design, Procedure, and Data Reduction and Analysis Strategy
With the exception of the new stimuli and participants, all other aspects of the method and data analyses were identical to those used in Experiment 1.
Results
Response times
Figure 4A depicts the main response time results The main effect of cue validity was significant (F(1,50) = 40.55, p < .001), indicating faster responses for validly cued trials (329ms) relative to invalid trials (352ms). The main effect of hue diagnosticity was significant (F(1,50) = 6.91, p = .01), with longer RTs following the diagnostic hue (343 ms) relative to the non-diagnostic hues (338 ms). The main effect of visual field indicated slower responses for LVF/RH targets (347 ms; F(1,50) = 14.86, p < .001) relative to RVF/LH targets (334 ms).
Figure 4.

Main results from Experiment 2. (A) Mean response times (ms) as a function of cue validity, target visual field and hue diagnosticity of the cue. (B) Mean error rates as a function of cue validity, target visual field and hue diagnosticity of the cue. Error bars depict within subject error.
Unlike Experiment 1, the cue validity by hue diagnosticity interaction was not significant (Figure 4A; F(1,50) = 0.25, p = 0.62). However, based on the pattern of results from Experiment 1, there was a priori interest in the effect of hue diagnosticity on valid trials. Accordingly, simple effects analyses revealed that the effect of the diagnostic hue relative to the non-diagnostic hues on response times was driven by a significant slowing in valid trials (6 ms; F(1,50) = 6.97, Bonferroni corrected p = 0.04), with a non-significant slowing in invalidly cued trials (4 ms; F(1,50) = 1.67, Bonferroni corrected p = .59). No other interactions were significant (ps > 0.10).
Error rates
Figure 4B depicts the results for error rates. Mean error rates in the task were comparable to Experiment 1, with an average of 0.04 errors. The main effect of cue validity was significant (F(1,50) = 16.33, p < 0.001), indicating that fewer errors were made on validly cued trials (0.03) relative to invalidly cues trials (0.07). The effect of hue diagnosticity was significant (F(1,50) = 18.94, p < 0.001), indicating that fewer errors followed the diagnostic hue (0.04) relative to the non-diagnostic hues (0.06). The main effect of target visual field was non-significant (F(1,50) = 0.21, p = 0.65).
More important, replicating the results from Experiment 1, the hue diagnosticity by validity interaction was significant (Figure 4B; F(1,50) = 30.89, p < 0.001). A follow-up simple-effects analysis indicated that this interaction is driven by a relative decrease in error rate for diagnostic hues compared with non-diagnostic hues when they followed invalid cues (0.05; F(1,50) = 29.71, Bonferroni corrected p < .004) without a significant effect for diagnosticity when targets followed valid cues (0.00; F(1,50) = 1.74, Bonferroni corrected p = 0.57). No other interactions were significant (ps > 0.29).
Discussion
Experiment 2 provides a replication of the effects observed in Experiment 1 while using a different set of non-diagnostic control colors. In particular, the reddish-yellow hue that was found to be associated with emotional images in the IAPS dataset was less effective at capturing and/or holding visuospatial attention than the non-diagnostic hues.
Relating Individual Differences in Affective Style to the Diagnostic-Hue Attentional Effect
Individuals predisposed to negative affect demonstrate an attentional bias toward negative stimuli (Mogg, Bradley & Williams, 1995; Bradley, Mogg & Millar, 1996), and those with a positive predisposition are biased to attend to positive stimuli (Segerstrom, 2001; Murphy et al, 1999). Accordingly, effects elicited by a hue that is diagnostic of rewarding, approach-eliciting objects may be larger for individuals with greater sensitivity to reward.
To provide converging evidence that the observed attentional effects were due to emotional processes, the relationship between the attentional effect and individual differences in affective style were explored. The reddish-orange hue was diagnostic of emotional image content to a greater degree for positive images than for negative images, and neutral pictures were rated as more positive when they contained reddish-orange hues. Accordingly, one would expect participants with greater trait reward sensitivity to have an exaggerated attentional response to this hue. Moreover, this effect may respect hemispheric asymmetries for emotional processing, in which the left hemisphere has proven to be more efficient at processing positively valenced objects than the right (Davidson, 1993; Maxwell et al., 2005).
Method
Participants
The data from all participants in Experiments 1 and 2 (N = 101, 70 female) were used to ensure a sufficiently large sample for exploring individual differences.
Materials
After participants completed the cueing task, they completed the Behavioral Inhibition System (BIS) and Behavioral Activation System (BAS) self report questionnaire (Carver & White, 1994). The BIS/BAS questionnaire is a pencil and paper self-report survey designed to assess trait responsiveness to threats and rewards with the BIS and BAS scales, respectively. The BAS instrument consists of three subscales: Fun Seeking (BASF; the desire for new rewards and willingness to enter novel situations), Drive (BASD; the persistence in pursuing rewards), and BAS-Reward Responsiveness (BASR; the value of and anticipation of rewards).
Procedure
The attentional effect, measured as the percentage change in log-transformed response times between invalid and valid trials, was calculated for diagnostic hue targets and non-diagnostic hue targets. Separate calculations were performed for trials that had targets presented in the LVF/RH and RVH/LH. Two linear regression models were built, one to predict the diagnostic-hue attentional effect when targets were presented in the LVF/RH and the other to predict the diagnostic-hue attentional effect when targets were presented in the RVF/LH. In both models, the predictor variables were the relevant non-diagnostic hue attentional effect, BIS, the three BAS subscales (Reward Sensitivity, Drive and Fun-seeking/Impulsivity) and a categorical variable indicating whether the participant was in Experiment 1 or 2. Interaction terms between Experiment Number and the other predictors were also included in the models.
Results
Descriptive statistics
As seen in Table 3, the mean BIS score was 21.2 and mean BAS was 40.7 for Experiment 1 and 22.1 and 41.5, respectively, for Experiment 2. These scores are similar to one another as well as those from previously reported samples (Carver & White, 1994).
Table 3.
Average Scores on the Behavioral Inhibition/Activation System Questionnaire
| Scale | Experiment 1
|
Experiment 2
|
||
|---|---|---|---|---|
| M | SD | M | SD | |
| BIS | 21.1 | 3.7 | 22.1 | 3.8 |
| BAS | 40.7 | 4.9 | 41.5 | 4.5 |
| BASF | 12.0 | 2.3 | 12.3 | 1.9 |
| BASD | 11.1 | 2.1 | 11.0 | 2.2 |
| BASR | 17.6 | 1.8 | 18.2 | 1.6 |
Note:
M = Mean, SD = Standard deviation; BIS = Behavioral Inhibition System; BAS = Behavioral Activation System; BASF = BAS Fun-seeking subscale; BASD = BAS Drive subscale; BASR = BAS Reward sensitivity subscale.
Correlations between the BIS and BAS scales were non-significant (|r|s < 0.04, ps > 0.78; Table 4). Significant positive correlations exist between BAS subscales, however multicolinearity is not problematic as indicated by reasonable variance inflation factors (VIF) in Table 5.
Table 4.
Spearman correlation between the Behavioral Inhibition/Activation System Questionnaire Scales
| Experiment 1 | |||||
|---|---|---|---|---|---|
| Scale | BIS | BAS | BASF | BASD | BASR |
| BIS | - | 0.03 | −0.22 | 0.12 | 0.24 |
| BAS | - | 0.80* | 0.83* | 0.71* | |
| BASF | - | 0.5* | 0.31* | ||
| BASD | - | 0.46* | |||
| BASR | - | ||||
|
| |||||
| Experiment 2 | |||||
| BIS | - | −0.04 | −0.15 | 0.02 | 0.03 |
| BAS | - | 0.80* | 0.82* | 0.73* | |
| BASF | - | 0.43* | 0.43* | ||
| BASD | - | 0.40* | |||
| BASR | - | ||||
Note:
BIS = Behavioral Inhibition System; BAS = Behavioral Activation System; BASF = BAS Fun-seeking subscale; BASD = BAS Drive subscale; BASR = BAS Reward sensitivity subscale.
p < .05
Table 5.
Results from regressing the diagnostic hue cueing effect on Behavioral Inhibition/Activation System
| Diagnostic cueing for LH/RVF
|
Diagnostic cueing for RH/LVF
|
|||||||
|---|---|---|---|---|---|---|---|---|
| Beta | t | p | VIF | Beta | t | p | VIF | |
| Intercept | 1.25 | 0.22 | 0.84 | 0.40 | ||||
| BIS | −0.01 | −0.08 | 0.93 | 1.17 | −0.05 | −0.59 | 0.56 | 1.16 |
| BASF | 0.06 | 0.54 | 0.59 | 1.57 | 0.00 | −0.01 | 1.00 | 1.53 |
| BASD | 0.26* | 2.47* | 0.02 | 1.49 | 0.03 | 0.32 | 0.75 | 1.54 |
| BASR | −0.26* | −2.53* | 0.01 | 1.45 | −0.06 | −0.66 | 0.51 | 1.42 |
| Non-diagnostic cueing | 0.36* | 3.60* | <0.001 | 1.36 | 0.56* | 6.49* | <0.001 | 1.13 |
| Experiment Number | 0.00 | −0.01 | 1.00 | 1.12 | 0.07 | 0.79 | 0.43 | 1.09 |
| Exp’t Number x BIS | −0.10 | −1.09 | 0.28 | 1.15 | 0.16 | 1.82 | 0.07 | 1.14 |
| Exp’t Number x BASF | 0.06 | 0.54 | 0.59 | 1.57 | −0.05 | −0.50 | 0.62 | 1.52 |
| Exp’t Number x BASD | 0.19 | 1.82 | 0.07 | 1.49 | 0.08 | 0.83 | 0.41 | 1.54 |
| Exp’t Number x BASR | −0.03 | −0.25 | 0.80 | 1.40 | −0.17 | −1.82 | 0.07 | 1.37 |
| Exp’t Number x Cueing | −0.18 | −1.91 | 0.06 | 1.30 | −0.05 | −0.58 | 0.56 | 1.11 |
Note: Beta is the standardized regression coefficient, t is the t-score associated with that regressor, p indicates two-tailed significance of the t test, and VIF is the variance inflation factor used to diagnose multicolinearity.
BIS = Behavioral Inhibition System; BAS = Behavioral Activation System; BASF = BAS Fun-seeking subscale; BASD = BAS Drive subscale; BASR = BAS Reward sensitivity subscale.
p < .05
Regression results
Not surprisingly, the results of the regressions indicated that significant positive relationships exist between the magnitude of the attentional effect for non-diagnostic hues and the magnitude of the attentional effect for diagnostic hues in both hemispheres (ps < 0.001). More importantly, increases in BASR were associated with smaller diagnostic-hue attentional effects for RVF/LH targets (p = 0.01), but not for LVF/RH targets (p = 0.451), meaning that increases in BASR are associated with more attentional broadening for targets presented directly to the LH. And increases in BASD were associated with increases in the diagnostic-hue cueing effect in the RVF/LH (p = 0.02), but not the LVF/RH (p = 0.75), meaning that increases in BASD are associated with less attentional broadening for targets presented directly to the LH.
Discussion
Analysis of individual differences on the BIS/BAS scales indicates that participants with greater responsiveness to rewards (BASR) have a more pronounced attentional broadening effect for the diagnostic hue, and individuals with greater drive toward goals (BASD) show less broadening following the diagnostic hue. In both cases, the effect was only significant for targets that were presented to the RVF/LH, consistent with previous theories on the asymmetrical organization of emotion in the brain. Processing of positive or approach-related affect is greater in the left hemisphere than in the right. Moreover, the fact that individual differences in affective style predict the behavioral measure of attentional broadening helps to allay concerns that emotionality per se may not have been involved in the effect of the diagnostic hue on attentional broadening.
Interpreting the results of the regression requires an understanding of the differences between the BAS subscales. Although the existence of three distinct BAS subscales has been replicated (Heubeck, Wilkinson & Cologon, 1998; Leone, Perungini, Bagozzi, Pierro & Mannetti, 2001), the exact interpretation of each is still unclear (Smillie, Jackson & Dalgleish, 2006; Leone, 2009). The original interpretation of the BASR and BASD scales by Carver and White (1994) was that they measure “focus on positive responses to the occurrence or anticipation of reward” and “the persistent pursuit of desired goals” (pp. 322). With these definitions, the current pattern of results may indicate that a disposition to focus on the anticipation of reward (i.e., increased BASR) results in more broadening of attention after a weakly-diagnostic emotional cue. In contrast, a persistent pursuit of goals (i.e., increased BASD) makes one more focused on completing the instructed attentional cueing task rather than exploring alternative rewards. Therefore, one interpretation of the behavioral effects may be that participants are faced with two contradictory demands after facing an emotionally diagnostic feature – explore the environment for the new, non-task-related reward or ignore the potential, non-task-related reward and remain focused on completing the instructed task. The degree to which one values rewards and task compliance is measured by the BASR and BASD subscales, respectively. However, this interpretation is admittedly speculative until a more solid theoretical account of the BAS subscales is developed.
An alternative interpretation of the BASD result comes from a series of studies regarding individual differences in the need for achievement. Participants with a high need for achievement or desire to control their environment and time (e.g., high BAS Drive) rated patterns containing reds and yellows less favorably than patterns with blues and greens (Green & Knapp, 1959; Knapp, 1962). By this account, participants with high BASD scores may have a weaker association between the reddish-orange hue and positive emotional content, resulting in a weaker broadening effect.
General Discussion
We found that color can be diagnostic for emotional content. Reddish-orange hues are more common in emotional images, especially those with positive content, than in neutral images. When these colors are used as attentional cues, responses are slowed at the location of the cue and more accurate at non-cued locations. The magnitude of this attentional broadening effect for targets presented to the RVF/LH is predicted by self-reported measures of the behavioral activation systems (BAS), providing a link between this behavioral effect and emotional systems involved in reward processing. These correlations with self-report are absent for targets presented to the LVF/RH, consistent with observed hemispheric asymmetries for the organization of emotional systems.
These results provide further evidence that low-level diagnostic features can exist for emotional categories and that they are exploited by the visual system to facilitate the rapid detection of emotional objects. Future research is necessary to determine the neural circuitry used for learning and detecting the emotionally diagnostic features, and whether these systems and processes are fundamentally different from those used to learn and detect diagnostic features for non-emotional object categories. Subcortical visual processing is thought to provide a ‘quick and dirty’ image analysis to enable the detection of emotional objects (Liddell et al, 2005; Pasley, Mayes & Schultz, 2004), however the nature of visual representation and algorithms employed by this pathway are largely unknown. Given the relative simplicity of visual processing that occurs along this pathway, the exploitation of simple diagnostic features would be computationally feasible and reasonably effective.
Additionally, it is unknown whether the diagnostic features for emotional content are innate or learned through experience. The caudate nucleus is a structure in the basal ganglia that has been implicated in learning the statistical regularities for object categorization (Nomura & Reber, 2008) and learning about rewarding behaviors (Haruno et al, 2004), suggesting a possible neural substrate for such a process. The acquisition of emotional features could be explored by fear conditioning artificial object categories with experimenter-controlled feature statistics or developmental and cross-cultural studies that could test questions of innateness and universality.
The present report makes two crucial assumptions regarding the color analysis of IAPS images. The first assumption if that the color content of an image can be studied from its RGB-coordinates, rather than physical measurements of wavelength. Relating the physical color measurements for each image to it’s normative affective rating would require details about the display apparatus and viewing conditions from the original IAPS report (Lang, Bradley & Cuthbert, 1995), which are not available. The second assumption in the color analysis is that color can be measured using the local properties (i.e., the color coordinates of each pixel), but the perceived color is affected by global and contextual image properties, such as color constancy and color contrast effects (Lotto & Purves, 2004). However, concern over the validity of a color analysis based on the local RGB-coordinates should be ameliorated by the findings from Experiments 1 and 2 – a physical rendering of the emotionally diagnostic hue in a different context from all of the IAPS images resulted in behavioral effects. This suggests that the effect is somewhat robust to perturbations of the physical display and global image context.
Lastly, these results emphasize the need to exercise care in removing confounds between low-level image statistics and experimental conditions (cf., Delplanque, N’diaye, Scherer, & Grandjean, 2007), because a simple feature, such as color, may influence behavior and interact with individual differences in temperament. Future research into the diagnosticity of various image features could lead to the development of image manipulations that allow for systematic altering of the arousal and valence of an image, thus providing tools for titrating the potency of experimental stimuli or even for assisting graphic design.
Conclusions
The colors in emotional images systematically differ from those of non-emotional objects. Specifically, an analysis of the IAPS images indicated that reddish-yellow hues were more common in emotional scenes, particularly for the positively valenced images. When these reddish-yellow hues are used in an exogenous cueing task, participants respond differently to the diagnostic and non-diagnostic hues. The pattern of results suggests either a broadening of attention following the diagnostic hue or that the automatic processing of emotional content competes with the demands of the attentional task. Additional evidence that these results reflect the engagement of emotional systems came from regression models linking individual differences in affective style to the behavioral effects. Future research should explore the mechanisms by which diagnostic features for emotional content are learned and exploited, possibly with emphasis placed on the role of subcortical visual circuitry.
Acknowledgments
BWM was supported by T32-HD007151.
Appendix A: IAPS slides used in color analysis
Neutral:
2372, 2383, 2385, 2410, 2441, 2510, 5800, 7150, 7185, 7211, 2030, 2102, 2190, 2276, 2304, 2311, 5520, 7020, 7025, 7030, 2215, 2216, 2221, 2222, 2224, 2270, 5510, 7009, 7010, 7060, 2037, 2104, 2154, 2305, 2393, 2490, 5500, 7002, 7004, 7057, 2360, 2375.1, 2381, 2387, 2480, 2506, 5750, 7175, 7186, 7190, 2362, 2394, 2395, 2396, 2397, 2399, 5535, 7100, 7110, 7187, 2373, 2391, 2440, 2442, 2455, 2485, 5740, 7080, 7090, 7170, 2278, 2345, 2370, 2495, 2499, 2500, 5534, 7006, 7043, 7055, 2487, 2491, 2493, 2501, 2513, 2550, 5533, 7000, 7056, 7058, 2210, 2516, 2520, 2530, 2540, 2570, 5532, 7050, 7052, 7053, 2038, 2339, 2346, 2512, 2580, 2890, 5531, 7040, 7042, 7059, 2271, 2320, 2344, 2358, 2600, 2635, 5530, 7031, 7034, 7035
Negative:
1710, 2250, 4141, 4302, 4606, 4695, 4770, 7450, 7470, 7472, 1811, 2260, 4311, 4320, 4641, 4750, 4800, 7475, 7480, 7481, 1920, 2660, 4001, 4235, 4607, 4609, 4810, 7484, 7487, 7488, 1440, 2057, 4003, 4310, 4611, 4643, 4645, 7230, 7250, 7352, 1441, 2050, 4290, 4300, 4647, 4649, 4650, 7200, 7260, 7285, 1463, 2040, 4232, 4279, 4651, 4652, 4653, 7281, 7282, 7283, 1602, 2058, 4250, 4255, 4656, 4658, 4659, 7270, 7284, 7286, 1603, 2070, 4002, 4240, 4660, 4666, 4689, 7291, 7320, 7330, 1604, 2071, 4220, 4225, 4669, 4670, 4680, 7289, 7340, 7350, 1610, 2080, 4180, 4210, 4672, 4676, 4677, 7220, 7351, 7359, 1750, 2153, 4004, 4142, 4664, 4681, 4687, 7360, 7390, 7400, 1722, 2240, 4005, 4006, 4683, 4690, 4694, 7402, 7410, 7430
Positive:
1114, 1274, 1321, 3010, 6830, 9405, 9409, 9410, 9440, 9561, 1051, 1070, 1310, 3061, 3062, 3064, 3110, 3530, 6190, 9008, 1022, 1040, 1220, 2720, 3015, 3030, 3069, 6243, 6350, 9181, 1030, 1270, 1280, 2730, 3000, 3016, 3500, 6210, 9420, 9570, 1052, 1240, 1302, 3051, 3053, 3100, 3120, 6241, 6562, 9040, 1026, 1201, 1301, 3301, 3400, 3550, 6200, 6510, 6831, 9340, 1050, 1275, 1525, 3220, 3225, 3250, 3266, 6244, 6540, 9373, 1019, 1200, 1303, 3060, 3168, 3261, 6250, 6560, 9320, 9560, 1120, 1205, 1300, 3150, 3160, 3170, 3181, 6550, 6555, 9341, 1113, 1230, 1617, 3063, 3130, 3140, 3180, 6211, 6230, 9180, 1110, 1111, 1112, 3080, 3101, 3102, 6260, 6300, 9182, 9300, 1080, 1090, 1101, 2811, 3005.1, 3068, 3071, 3210, 6242, 9290
Footnotes
However, one should note that this representation is not identical to that in the thalamus because it is based on a transformation of RGB image coordinates rather than the relative activation-level of photoreceptors with long, medium or short wavelength sensitivities. Using this more biologically accurate model requires physical measurements from the display used during original IAPS emotional rating task, which is not possible.
Two-dimensional color histograms were constructed using the H (hue) and S (saturation) dimensions, and the emotional versus non-emotional effect was significant for six highly-saturated reddish hues (peak effect was t(358) = 5.10).
References
- Attrill MJ. Red shirt colour is associated with long-term team success in English football. Journal of Sports Sciences. 2008;26:577–582. doi: 10.1080/02640410701736244. [DOI] [PubMed] [Google Scholar]
- Aronoff J. How we recognize angry and happy emotion in people, places and things. Cross-cultural Research. 2006;40(1):83–105. [Google Scholar]
- Aronoff J, Barclay AM, Stevenson LA. The recognition of threatening facial stimuli. Journal or Personality and Social Psychology. 1988;54(4):647–655. doi: 10.1037//0022-3514.54.4.647. [DOI] [PubMed] [Google Scholar]
- Aronoff J, Woike BA, Hyman LM. Which are the stimuli in facial displays of anger and happiness? Configurational bases of emotion recognition. Journal or Personality and Social Psychology. 1992;62(6):1050–1066. [Google Scholar]
- Bar M, Neta M. Visual elements of subjective preference modulate amygdala activation. Neuropsychologia. 2007;45 doi: 10.1016/j.neuropsychologia.2007.03.008. [DOI] [PMC free article] [PubMed] [Google Scholar]
- Berlin B, Kay P. Basic color terms. University of California Press; Berkeley: 1969. [Google Scholar]
- Bradley BP, Mogg K, Millar N, White J. Selective processing of negative information: Effects of clinical anxiety, concurrent depression, and awareness. Journal of Abnormal Psychology. 1995;104:532–532. doi: 10.1037//0021-843x.104.3.532. [DOI] [PubMed] [Google Scholar]
- Carver CS, White TL. Behavioral inhibition, behavioral activation, and affective responses to impending reward and punishment: The BIS/BAS scales. Journal of Personality and Social Psychology. 1994;67:319–333. [Google Scholar]
- Changizi MA, Zhang Q, Shimojo S. Bare skin, blood and the evolution of primate colour vision. Biology Letters. 2006;2(2):217–221. doi: 10.1098/rsbl.2006.0440. [DOI] [PMC free article] [PubMed] [Google Scholar]
- Codispoti M, Ferrari V, Bradley MM. Repetition and event-related potentials: Distinguishing early and late processes in affective picture perception. Journal of Cognitive Neuroscience. 2007;19(4):577–586. doi: 10.1162/jocn.2007.19.4.577. [DOI] [PubMed] [Google Scholar]
- Davidson RJ. Cerebral asymmetry and emotion: Conceptual and methodological conundrums. Cognition and Emotion. 1993;7:115–138. [Google Scholar]
- De Cesarei A, Codispoti M. Fuzzy picture processing: Effects of size reduction and blurring on emotional processing. Emotion. 2008;8(3):352–363. doi: 10.1037/1528-3542.8.3.352. [DOI] [PubMed] [Google Scholar]
- Elliot AJ, Maier MA. Color and psychological functioning. Current Directions in Psychological Science. 2007;16(5):250–254. [Google Scholar]
- Elliot AJ, Maier MA, Binser MJ, Friedman R, Pekrun R. The effect of red on avoidance behavior in achievement contexts. Personality and Social Psychology Bulletin. 2009;35:365–375. doi: 10.1177/0146167208328330. [DOI] [PubMed] [Google Scholar]
- Elliot AJ, Maier MA, Moller AC, Friedman R, Meinhardt J. Color and psychological functioning: The effect of red on performance attainment. Journal of Experimental Psycology: General. 2007;136(1):165–168. doi: 10.1037/0096-3445.136.1.154. [DOI] [PubMed] [Google Scholar]
- Fredrickson BL. The broaden-and-build theory of positive emotions. Philosophical Transactions of the Royal Society: Biological Sciences. 2004;359(1449):1367–1377. doi: 10.1098/rstb.2004.1512. [DOI] [PMC free article] [PubMed] [Google Scholar]
- Gable PA, Harmon-Jones E. Approach-motivated positive affect reduces breadth of attention. Psychological Science. 2008;19:476–482. doi: 10.1111/j.1467-9280.2008.02112.x. [DOI] [PubMed] [Google Scholar]
- Genovese CR, Lazar NA, Nichols T. Thresholding of statistical maps in functional neuroimaging using the false discovery rate. Neuroimage. 2002;15(4):870–878. doi: 10.1006/nimg.2001.1037. [DOI] [PubMed] [Google Scholar]
- Goffaux V, Jacques C, Mouraux A, Oliva A, Schyns PG, Rossion B. Diagnostic colours contribute to the early stages of scene categorization: Behavioural and neurophysiological evidence. Visual Cognition. 2005;12(6):878–892. [Google Scholar]
- Green HB, Knapp RH. Time judgment, aesthetic preference, and need for achievement. Journal of Abnormal and Social Psychology. 1959;58(1):140–142. doi: 10.1037/h0041983. [DOI] [PubMed] [Google Scholar]
- Hagemann N, Strauss B, Leiβing J. When the referee sees red. Psychological Science. 2008;19(8):769–771. doi: 10.1111/j.1467-9280.2008.02155.x. [DOI] [PubMed] [Google Scholar]
- Haruno M, Kuroda T, Doya K, Toyama K, Kimura M, Samejima K, Imamizu &, Kawato M. A neural correlate of reward-based behavioral learning in caudate nucleus: A functional magnetic resonance imagain study of stochastic decision task. Journal of Neuroscience. 2004;24:1660–1665. doi: 10.1523/JNEUROSCI.3417-03.2004. [DOI] [PMC free article] [PubMed] [Google Scholar]
- Heubeck BG, Wilkinson RB, Cologon J. A second look at Carver and White’s (1994) BIS/BAS scales. Personality and Individual Differences. 1998;25:785–800. [Google Scholar]
- Hill RA, Barton RA. Red enhances human performance in contests. Nature. 2005;435(7040):293. doi: 10.1038/435293a. [DOI] [PubMed] [Google Scholar]
- Johnson JS, Olshausen BA. Timecourse of neural signatures of object recognition. Journal of Vision. 2003;3(7):499–512. doi: 10.1167/3.7.4. [DOI] [PubMed] [Google Scholar]
- Junghofer M, Bradley MM, Elbert TR, Lang PJ. Fleeting images: A new look at early emotion discrimination. Psychophysiology. 2001;38(02):175–178. [PubMed] [Google Scholar]
- Keil A, Müller MM, Gruber T, Wienbruch C, Stolarova M, Elbert T. Effects of emotional arousal in the cerebral hemispheres: A study of oscillatory brain activity and event-related potentials. Clinical Neurophysiology. 2001;112(11):2057–2068. doi: 10.1016/s1388-2457(01)00654-x. [DOI] [PubMed] [Google Scholar]
- Knapp RH. Attitudes toward time and aesthetic choice. Journal of Social Psychology. 1962;56:79–87. [Google Scholar]
- Koster EHW, Crombez G, Van Damme S, Verschuere B, De Houwer J. Does imminent threat capture and hold attention. Emotion. 2004;4(3):312–317. doi: 10.1037/1528-3542.4.3.312. [DOI] [PubMed] [Google Scholar]
- Lake DA, Bryden MP. Handedness and sex differences in hemispheric asymmetry. Brain and Language. 1976;3(2):266–282. doi: 10.1016/0093-934x(76)90022-5. [DOI] [PubMed] [Google Scholar]
- Lang PJ, Bradley MM, Cuthbert BN. International affective picture system (IAPS): Technical manual and affective ratings. Gainesville, FL: The Center for Research in Psychophysiology, University of Florida; 1995. [Google Scholar]
- Larson CL, Aronoff J, Sarinopoulos IC, Zhu DC. Recognizing threat: A simple geometric shape activates neural circuitry for threat detection. Journal of Cognitive Neuroscience. :1–13. doi: 10.1162/jocn.2009.21111. (Early Access) [DOI] [PubMed] [Google Scholar]
- Larson CL, Aronoff J, Stearns JJ. The shape of threat: Simple geometric forms evoke rapid and sustained capture of attention. Emotion. 2007;7(3):526–534. doi: 10.1037/1528-3542.7.3.526. [DOI] [PubMed] [Google Scholar]
- Leone L, Perugini M, Bagozzi RP, Pierro A, Mannetia L. Construct validity and generalizability of the Carver-White behavioral inhibition system/behavioral activation system scales. European Journal of Personality. 2001;15:373–390. [Google Scholar]
- Leone L. Testing conceptual distinctions among Carver and White’s (1994) BAS scales: A comment and extension on Smillie, Jackon and Dalgleish (2006) Personality and Individual Differences. 2009;46:54–59. [Google Scholar]
- Lichtenfeld S, Maier MA, Elliot AJ, Pekrun R. The semantic red effect: Processing the word red undermines intellectual performance. Journal of Social Psychology. 2009;45:1273–1276. [Google Scholar]
- Liddell BJ, Brown KJ, Kemp AH, Barton MJ, Das P, Peduto A, et al. A direct brainstem–amygdala–cortical ‘alarm’ system for subliminal signals of fear. Neuroimage. 2005;24(1):235–243. doi: 10.1016/j.neuroimage.2004.08.016. [DOI] [PubMed] [Google Scholar]
- Little AC, Hill RA. Attribution to red suggests special role in dominance signaling. Journal of Evolutionary Psychology. 2007;5(1):161–168. [Google Scholar]
- Lotto RB, Purves D. Perceiving color. Review of Progress in Coloration and Related Topics. 2004;34:12–25. [Google Scholar]
- Knapp RH. Attitudes toward time and aesthetic choice. The Journal of Social Psychology. 1962;56:79–87. [Google Scholar]
- Milinski M, Bakker TCM. Female sticklebacks use male coloration in mate choice and hence avoid parasitized males. Nature. 1990;344(6264):330–333. [Google Scholar]
- Mogg K, Bradley BP, Williams R. Attentional bias in anxiety and depression: The role of awareness. The British Journal of Clinical Psychology. 1995;34 (Pt 1):17–36. doi: 10.1111/j.2044-8260.1995.tb01434.x. [DOI] [PubMed] [Google Scholar]
- Moller AC, Elliot AJ, Maier MA. Basic hue-meaning associations. Emotion. 2009;9(6):898–902. doi: 10.1037/a0017811. [DOI] [PubMed] [Google Scholar]
- Murphy FC, Sahakian BJ, Rubinsztein JS, Michael A, Rogers RD, Robbins TW, et al. Emotional bias and inhibitory control processes in mania and depression. Psychological Medicine. 1999;29(6):1307. doi: 10.1017/s0033291799001233. [DOI] [PubMed] [Google Scholar]
- Nestor A, Tarr MJ. Gender recognition of human faces using color. Psychological Science. 2008;19(12):1242–1246. doi: 10.1111/j.1467-9280.2008.02232.x. [DOI] [PubMed] [Google Scholar]
- Nomura EM, Reber PJ. A review of medial temporal lobe and caudate contributions to visual category learning. Neuroscience and Biobehavioral Reviews. 2008;32:279–291. doi: 10.1016/j.neubiorev.2007.07.006. [DOI] [PubMed] [Google Scholar]
- Öhman A, Flykt A, Esteves F. Emotion drives attention: Detecting the snake in the grass. Journal of Experimental Psychology. 2001;130(3):466–478. doi: 10.1037//0096-3445.130.3.466. [DOI] [PubMed] [Google Scholar]
- Oliva A, Schyns PG. Colored diagnostic blobs mediate scene recognition. Cognitive Psychology. 2000;41:176–210. doi: 10.1006/cogp.1999.0728. [DOI] [PubMed] [Google Scholar]
- Osgood CE, Suci GJ, Tannenbaum PH. The measurement of meaning. Urbana, IL: University of Illinois Press; 1957. [Google Scholar]
- Pasley BN, Mayes LC, Schultz RT. Subcortical discrimination of unperceived objects during binocular rivalry. Neuron. 2004;42(1):163–172. doi: 10.1016/s0896-6273(04)00155-2. [DOI] [PubMed] [Google Scholar]
- Pizzagalli D, Regard M, Lehmann D. Rapid emotional face processing in the human right and left brain hemispheres: An ERP study. Neuroreport. 1999;10(13):2691. doi: 10.1097/00001756-199909090-00001. [DOI] [PubMed] [Google Scholar]
- Posner MI, Petersen SE. The attention system of the human brain. Annual Reviews in Neuroscience. 1990;13(1):25–42. doi: 10.1146/annurev.ne.13.030190.000325. [DOI] [PubMed] [Google Scholar]
- Pryke SR, Griffith SC. Red dominates black: Agonistic signaling among head morphs in the colour polymorphic gouldian finch. Proceedings of the Royal Society B: Biological Sciences. 2006;273(1589):949–957. doi: 10.1098/rspb.2005.3362. [DOI] [PMC free article] [PubMed] [Google Scholar]
- Ratcliff R. Methods for dealing with reaction time outliers. Psychological Bulletin. 1993;114:510–510. doi: 10.1037/0033-2909.114.3.510. [DOI] [PubMed] [Google Scholar]
- Schyns PG. Diagnostic recognition: Task constraints, object information, and their interactions. Cognition. 1998;67(1–2):147–179. doi: 10.1016/s0010-0277(98)00016-x. [DOI] [PubMed] [Google Scholar]
- Segerstrom SC. Optimism and attentional bias for negative and positive stimuli. Personality and social psychology Bulletin. 2001;27(10):1334. [Google Scholar]
- Setchell JM, Wickings E. Dominance, status signals and coloration in male mandrills (mandrillus sphinx) Ethology. 2005;111(1):25–50. [Google Scholar]
- Smillie LD, Jackson CJ, Dalgleish LI. Conceptual distinctions among Carver and White’s (1994) scales: A reward-reactivity versus trait impulsivity perspective. Personality and Individual Differences. 2006;40:1039–1050. [Google Scholar]
- Surridge AK, Osorio D, Mundy NI. Evolution and selection of trichromatic vision in primates. Trends in Ecology & Evolution. 2003;18(4):198–205. [Google Scholar]
- Tanaka J, Weiskopf D, Williams P. The role of color in high-level vision. Trends in Cognitive Sciences. 2001;5(5):211–215. doi: 10.1016/s1364-6613(00)01626-0. [DOI] [PubMed] [Google Scholar]
- Vuilleumier P, Armony JL, Driver J, Dolan RJ. Distinct spatial frequency sensitivities for processing faces and emotional expressions. Nature Neuroscience. 2003;6(6):624–631. doi: 10.1038/nn1057. [DOI] [PubMed] [Google Scholar]
- Waitt C. Evidence from rhesus macaques suggests that male coloration plays a role in female primate mate choice. Proceedings of the Royal Society B: Biological Sciences. 2003;270:144–146. doi: 10.1098/rsbl.2003.0065. [DOI] [PMC free article] [PubMed] [Google Scholar]
- Walther D. PhD Thesis. 2006. Appendix A. 2. Color opponencies for bottom-up attention. Interactions of visual attention and object recognition: Computational modeling, Algorithms, and psychophysics; pp. 98–99. [Google Scholar]
- Watson D, Clark LA, Tellegen A. Development and validation of brief measures of positive and negative affect: The PANAS scales. Journal of Personality and Social Psychology. 1988;54(6):1063–1070. doi: 10.1037//0022-3514.54.6.1063. [DOI] [PubMed] [Google Scholar]
- Watson DG, Blagrove E, Evans C, Moore L. Negative triangles: Simple geometric shapes convey emotional valence. Emotion. 2012;12(1):18–22. doi: 10.1037/a0024495. [DOI] [PubMed] [Google Scholar]
- Whalen PJ, Kagan J, Cook RG, Davis FC, Kim H, Polis S, et al. Human amygdala responsivity to masked fearful eye whites. Science. 2004;306(5704):2061–2061. doi: 10.1126/science.1103617. [DOI] [PubMed] [Google Scholar]
- Winston JS, Vuilleumier P, Dolan RJ. Effects of low-spatial frequency components of fearful faces on fusiform cortex activity. Current Biology. 2003;13(20):1824–1829. doi: 10.1016/j.cub.2003.09.038. [DOI] [PubMed] [Google Scholar]
- Wurm LH, Legge GE, Isenberg LM, Luebker A. Color improves object recognition in normal and low vision. Journal of experimental psychology. 1993;19:899–911. doi: 10.1037//0096-1523.19.4.899. [DOI] [PubMed] [Google Scholar]
- Zald DH. The human amygdala and the emotional evaluation of sensory stimuli. Brain Research Reviews. 2003;41:88–123. doi: 10.1016/s0165-0173(02)00248-5. [DOI] [PubMed] [Google Scholar]