Abstract
Minimally invasive imaging of upper airway obstructions in children and adults is needed to improve clinical decision-making. Toward this goal, we demonstrate an anatomical optical coherence tomography (aOCT) system delivered via a small-bore, flexible endoscope to quantify the upper airway lumen geometry. Helical scans were obtained from a proximally-scanned fiber-optic catheter of 820 μm outer diameter and >2 mm focal length. Coupled with a long coherence length wavelength-swept light source, the system exhibited an SNR roll-off of < 10 dB over a 10 mm range. Operating at 10 rotations/s, the average accuracy of segmented cross-sectional areas was found to be −1.4 ± 1.0%. To demonstrate the capability of this system, aOCT was performed on a pediatric airway phantom and on ex vivo swine trachea. The ability for quantitative endoscopy afforded by this system can aid in diagnosis, medical and surgical decision making, and predictive modeling of upper airway obstructive disorders.
OCIS codes: (170.4500) Optical coherence tomography, (170.3880) Medical and biological imaging, (170.3890) Medical optics instrumentation, (170.2150) Endoscopic imaging
1. Introduction
Airway obstruction is an extraordinarily common problem with a far-ranging health and economic impact, including co-morbidites such as hypertension and heart disease [1]. In particular, pediatric upper airway obstructive disorders can lead to life-threatening respiratory difficulties, poor growth, aspiration, delay in speech development, and long term morbidity [2]. In such airway abnormalities, bronchoscopy/laryngoscopy is the gold standard for aiding in diagnosis and treatment. However, endoscopy is only semi-quantitative. Truly quantitative methods of imaging the geometry of the upper airway can potentially lead to improved methodology for determining the optimal management of upper airway disorders. Importantly, quantitative measurements of the airway lumen enable the construction of virtual computational airway models of airflow and respiratory function and can potentially predict outcomes of medical or surgical intervention [3]. Currently, computed tomography (CT) and magnetic resonance imaging (MRI) have been used to provide quantitative upper airway anatomy [4, 5]. However, there are health risks associated with the need for sedation to obtain scans in children (which may be hazardous in children with airway obstruction), and with exposure to ionizing radiation in CT. Also, both imaging modalities are limited by respiratory motion artifacts and long imaging times during which the patient, particularly an infant or child, may require sedation. In addition, these modalities cannot be performed during surgery, during which real-time feedback would be beneficial.
Optical coherence ranging techniques, such as optical coherence tomography (OCT), are an attractive alternative as they are well-suited for providing non-invasive, microscopic resolution imaging of light scattering structures [6]. OCT is typically used for analyzing internal tissue structures within the ~2–3 mm depth range. In order to access the larger depth ranges needed for upper airway lumen imaging, anatomical OCT (aOCT) was originally developed by adapting time-domain OCT hardware for considerably longer optical delays [7]. The use of retrospective respiratory gating provided the ability to capture respiratory dynamics with minimal blurring [8]. This led to widespread research applications in human respiratory imaging of both lower [9] and upper airways [10], showing the potential of aOCT to aid in the diagnosis and elucidate mechanisms of obstructive sleep apnea (OSA) [11] as well as asthma, chronic obstructive pulmonary disease (COPD), bronchiectasis, and tracheal stenosis [12–14]. An alternate low-coherence ranging method based on full-field interferometry was demonstrated on ex vivo pig bronchi [15]. While these studies established the potential of aOCT to inform a broad spectrum of obstructive airway diseases, the time-domain nature of these aOCT systems offered limited scanning speed, reducing the ability to track the respiratory cycle [16] or to perform imaging during a short (<2 min) endoscopic procedure.
The subsequent development of spectral-domain OCT has provided higher imaging speeds and sensitivity over those accessible by time-domain OCT [17]. In particular, swept source OCT (SSOCT) is a type of spectral-domain OCT in which a wavelength-swept light source is used and the axial reflectivity profile is obtained from Fourier transformation of the detected signal. Recently, swept-source anatomical OCT (SSaOCT) has been employed for upper airway luminal imaging, demonstrating that the cross-sectional image obtained from SSaOCT is correlated with that of CT [18]. The high speed and sensitivity of SSOCT systems have also shown utility in other respiratory imaging applications including imaging microstructural changes associated with airway injury from smoke inhalation [19], and for capturing the vibration of the vocal cords [20].
For airway OCT there is a need for compact and high scanning speed endoscopic imaging probes. While the technology for the OCT probes is commercially available for cardiovascular applications [21], the development of aOCT probes for airway luminal imaging is in the early stages due to the challenges of obtaining longer (>12 mm) axial imaging range while keeping a sufficient signal-to-noise ratio (SNR). Typically an SNR of ~80dB is needed to provide high-quality reflectance images of the airway lumen. Toward this end, a 1.2 mm diameter GRIN-based fiber-optic catheter was recently described in which it was inserted into a 1.8 mm outer diameter tube deployed via the nares into the airway [18]. However, even smaller diameters are required for the delivery of the SSaOCT catheter via currently existing endoscopes, which provide a familiar and widely utilized platform for clinicians with concomitant video imaging capabilities.
Here, we describe an aOCT system that employs a specially-designed swept light source (Santec, Japan) with a coherence length of 17.5 mm. The system also employs a custom fiber-optic catheter capable of long (>10 mm) imaging range. The catheter design is based upon an angle-polished ball lens that is packaged within a protective sheath of 820 μm outer diameter. This catheter is easily accommodated into the 1.2 mm channel of currently commercially available flexible pediatric endoscopes while providing long-range anatomic imaging. Using this instrument we demonstrate accurate luminal 3D image reconstructions of human airway phantoms and an ex vivo swine trachea.
2. Methods
2.1 aOCT system hardware
Quantitative pediatric endoscopy poses the particular challenge of a long imaging radius (>12 mm) in combination with a sufficiently small catheter (0.82 mm outer diameter) to fit the side channel of the smallest commercially available flexible endoscope used in infants (1.2 mm). Here we describe an endoscopically-delivered SSaOCT system which meets these criteria; to our knowledge, this combination of features has not yet been reported.
The aOCT system consists of a wavelength-swept light source (HSL-2100-LC Santec, Inc.) centered at a wavelength of 1305 nm with a sweep rate (A-line rate) of 5 kHz, a sweep range of 30 nm, and, importantly, a coherence length of ~17.5 mm (1/e length) as measured experimentally. The light source has a power of 20 mW delivered into a single-mode fiber, which is directed into a Mach-Zehnder fiber interferometer to perform aOCT as depicted in Fig. 1 .
Fig. 1.
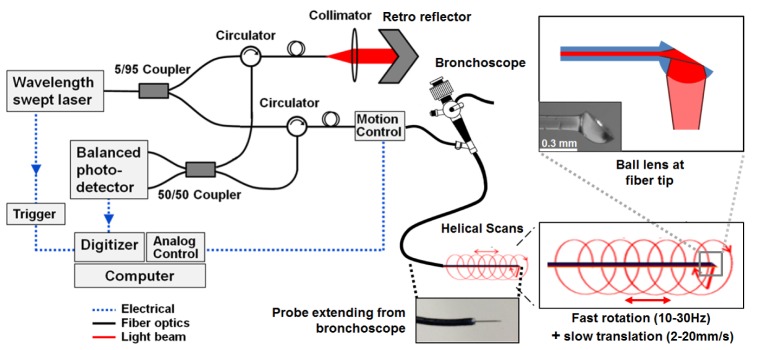
Anatomical OCT system diagram. The collimator and retro reflector act as the reference arm while the sample arm consists of a fiber optic catheter probe that has been inserted into the side port of the endoscope. The ball lens tip of the fiber optic catheter is inside a protective plastic sheath with an outer diameter of 820 μm, which is inserted into a laryngoscope (see photograph) for pediatric airway imaging. The ball lens tip of the fiber optic catheter provides a sideways-directed beam that rotates during pullback translations, resulting in a helical scan pattern.
The source beam is directed into a 1 × 2 coupler of 5/95 split ratio into the reference and sample arms, respectively. The reference arm consists of a collimator and adjustable delay retro-reflector. Two circulators were used in both sample and reference arms to redirect the back-reflected light to a 2 × 2 fiber coupler (50/50 split ratio). The interference of the reference and the backscattered sample electric fields was detected by a balanced photodetector and digitized at 10 MHz. A software application was written in LabVIEW to simultaneously control the translational and rotational motion in the scan engine while digitizing the OCT signal.
In the sample arm, the scan engine (Physical Sciences, Inc) contains a fiber rotary junction and provides translational motion at 2–20 mm/s and full 360° rotational scans at 10–30 Hz. This is used to drive the 168 cm long fiber catheter proximally in a helical scan pattern; this fiber length provides sufficient excess length after insertion into the 54 cm long endoscope channel for the clinician to position and manipulate the instrument. The fiber-optic catheter consists of a ball lens tip and an internally reflective polished flat surface at an angle (top right panel of Fig. 1), providing a sideways-directed beam with a focal length of typically 2–3.5 mm. In the current design, the physical limitation of producing a long focal length is given by the aperture size and ball lens diameter, which dictates a tradeoff between small catheter diameter and long focal length. Longer focal lengths may also be accessible by modifying the design to include a segment of fused GRIN fiber as a focusing element instead of the ball lens. With the current ball lens design, however, we found that a sufficiently long confocal range (results in the following section) is provided by a ball lens diameter of 300–350 μm, which allows for enough additional room for placement into a protective tube that is sufficiently small for insertion into a small-bore pediatric, flexible endoscope (Karl Storz, Germany).
2.2 Imaging protocols and segmentation
All data presented here were obtained by fiber scanning with translational and rotational rates of 2.5 mm/s and 10 Hz, respectively. During scanning, the fiber probe is typically extended 2−3 cm beyond the endoscope tip and translated in a pull-back mode. Once collected, the OCT data is digitally compensated for dispersion arising from the interferometer and k-space nonlinearity of the light source wavelength sweep. While there are existing methods for k-clocking to reduce the latter effect [22], the long interferometer fiber lengths used in endoscopic OCT can often be difficult to precisely length-match, in which case the interferometer dispersion mismatch can also require compensation. Here we employ digital dispersion compensation in lieu of k-clocking to correct for all forms of dispersion simultaneously. Our method was previously described in [23]; briefly, our approach consists of an autofocus algorithm based on an entropy minimization method originally developed for time-domain OCT [24], and extended to swept-source OCT.
To quantify the cross-sectional area (CSA) from aOCT scans, the inner surface of the object was segmented by a custom algorithm comprised of the following steps: 1) The differential pixel intensity was computed along each A-line and compared against that for a reference image, 2) pixels with differential SNR > 5 were thresholded, 3) non-adjacent pixels and pixels below already thresholded pixels were rejected, and 4) cubic spline interpolation and 5-point smoothing were applied. The segmented surfaces were then converted from pixel number to radial distance from the probe tip using a calibration curve; the calibration curve was established by linear least-squares fitting of the aOCT-derived position of a diffusely reflecting surface mounted on a micrometer stage while the catheter was stationary. Finally, the segmented radial distances of the object surface, Ri, for each 360° rotation were numerically integrated to compute the CSA according to: , where n is the number of A-lines per rotation.
2.3 Samples employed for imaging
In order to measure the transverse point-spread function of the system, we prepared a silicone test sample containing a sparse distribution of aluminum particles passed through a sieve so as to be less than 100 μm in size (sufficiently small so that they could be approximated as point-like in the transverse dimension). The results of imaging this sample are presented in 3.1 below.
In order to assess scanning accuracy, we obtained cylindrical, opaque plastic tubes (McMaster-Carr, Inc.) with diameters varying from 12.2 – 25.4 mm. The results of imaging the tubes are presented in 3.2 below.
To simulate pediatric airway imaging, an airway surface geometry was segmented from computed tomography (CT) data of a 10 year old boy with a radiologically normal airway. The segmentation was converted into a stereolithography format for 3D printing in an optically turbid composite material (SLArmorTM, Fineline Prototyping, Inc.) Imaging of the phantom is reported in section 3.3 below.
To determine the ability for this aOCT system to image real airway tissues, we obtained a freshly frozen, ex vivo swine airway. The upper tracheal region of the swine airway was thawed and placed in a 1X saline solution prior to performing scans. First, aOCT scans were collected via the endoscope; then a CT scan (GE eXplore CT120, Biomedical Research Imaging Center, UNC) of the same region was obtained. The results of imaging the airway are reported in section 3.4 below.
3. Results and discussion
3.1 aOCT performance
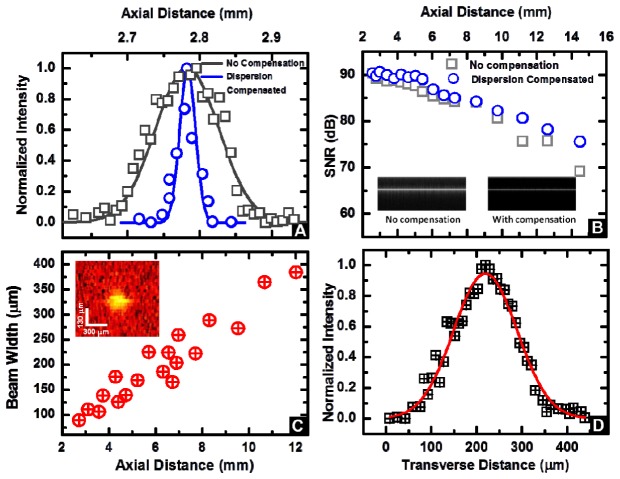
The axial resolution of the aOCT system depends on the characteristics of the light source (center wavelength and sweep range) and has a theoretical value of 25.1 μm. Figure 2(A) depicts the axial point-spread function before and after dispersion compensation, with a nearly transform-limited axial resolution of 25.7 μm achieved after compensation.
Fig. 2.
(A) Axial point spread function without and with digital dispersion compensation demonstrating an axial resolution of 25.7 μm. (B) Signal to noise ratio (SNR) computed as described in operational SNR Eq. (1) as a function of imaging depth. The inset displays representative M-mode images from a mirror without (left) and with (right) dispersion compensation at a depth of z = 4.2 mm. (C) Beam width variation as a function of the distance away from the catheter tip. Inset: representative image of a point-like scatterer used in these measurements (distance of 4.4 mm)). (D) Representative Gaussian-fitted profile of the normalized intensity of the transverse point spread function at an axial distance of 4.4 mm.
The challenge in aOCT system design is to obtain an increased depth range over that of traditional endoscopic OCT systems, in order to enable imaging of the airway lumen. Fundamentally, the SSaOCT signal-to-noise ratio (SNR) rolls off as function of depth due to the effects of limited confocal range, limited coherence length, and the dispersion effects discussed above. We estimated the true, operational SNR by measuring the peak aOCT signal amplitude S(z) from an aligned mirror for depths z = 2.5–14.5 mm. To prevent saturation of the photodetector the sample beam was attenuated, while the attenuated power was recorded as P(z) and the un-attenuated power that was back-reflected from the mirror was recorded as P 0(z). To account for any additional shot noise that would exist in an un-attenuated image during normal operation, the noise, N(z), was computed as the standard deviation at depth z from an image with no sample but when the sample beam was un-attenuated. Thus, the operational SNR in the absence of attenuation is estimated by the following relation:
| (1) |
The results of our SNR measurements for no compensation (Fig. 2(B)) indicate a total roll-off of 21 dB at a depth of z = 14.5 mm from the maximum value of 90.2 dB. Shown in the same plot, the digitally compensated results exhibited a reduced roll-off of 15 dB at the same depth of z = 14.5 mm. As discussed in our previous publication [23], this remaining rolloff can be attributed to a combination of the finite coherence length of the light source (17.5 mm) and by the beam divergence displayed in Fig. 2(C).
By imaging the test sample containing a sparse distribution of particles, we measured the beam width as a function of the distance away from the catheter tip, which ranged from 89 μm at the focus, to 384 μm at a distance of 12 mm (Fig. 2(C)). This increase is consistent with the expected Gaussian beam divergence as it propagates from the focus. The Gaussian-like profile of a representative particle is depicted in Fig. 2(D), representing the transverse point-spread function of the system at that axial position. Importantly, future work on extending the focal length is expected to improve the SNR roll-off, but will cause a concomitant tradeoff in the transverse resolution. While further study is needed, we note that quantitative measures of the cross-sectional airway profile are significantly less sensitive to transverse resolution compared to axial resolution. Thus, our pancake-like coherence volumes (25.7 μm axial × 100–400 μm transverse) may still provide large improvements over airway geometries obtained in CT and MRI.
3.2 Scanning accuracy
The ability to accurately measure airway luminal geometry is crucial for informing predictive models such as those based on computational fluid dynamics, which can be highly sensitive to small differences [11]. Here we chose to quantify CSA because it is the primary factor affecting airflow resistance. Results of aOCT imaging of the cylindrical tubes are displayed in Fig. 3 . Three independent helical scans, 17 rotations each, were obtained for each tube while the fiber catheter was operated through the 1.2 mm endoscope channel. The aOCT-derived CSA for each rotation were then compared against the true CSA determined by caliper measurements of the inner tube diameters, as shown in Fig. 3. We estimated the theoretical accuracy by assuming that the standard deviation of the radius, σR, is equivalent to the axial resolution of the aOCT system. Thus by propagation, the error in the CSA becomes: σCSA = 2πRσR. The region bounded by this anticipated error is displayed in grey in the bottom panel of Fig. 3.
Fig. 3.
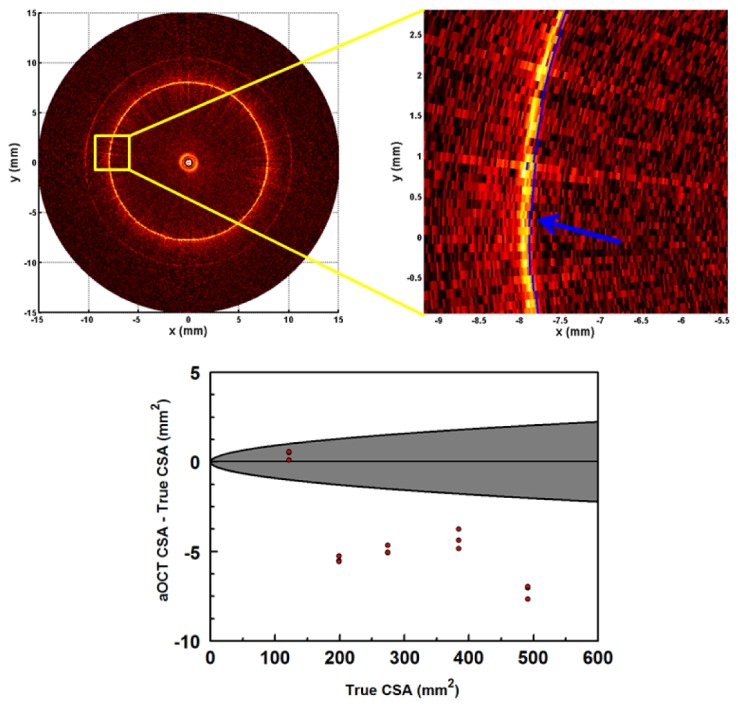
Determining the accuracy of CSA in aOCT from images of tubes of varying diameters. Top left: example aOCT image of a 15.9 mm diameter tube. Top right: corresponding close-up, where the segmentation line has been overlaid in blue. Bottom: Plot of accuracy versus true tube CSA (3 measurements per tube). The gray region represents the < ± 1 standard deviation region expected based upon the axial resolution of the aOCT system.
Overall, we found that the accuracy of aOCT for measuring CSA had a mean value of −1.4 ± 1.0% (all values are given as ± 1 standard deviation), while the slice-to-slice precision (repeatability) was < ± 0.3%. The data in Fig. 3 indicates that there may be some systematic error for CSA > 150 mm2 that causes aOCT to predict a lower CSA with error 2–3 × larger than would be expected by random chance. We also determined that vibration of the probe tip, to the extent that it exists, was negligible when comparing the aOCT data to the ideal tube shape. Putting these values into context, subglottic airway stenosis in infants is defined by an airway diameter < 3–4 mm depending on the developmental stage [2], which corresponds to CSA on the order of 10 mm2. The accuracy obtained here is already significantly improved from what would be expected for a CT scan (e.g., with a resolution of 500 μm one would expect, at a CSA of 300 mm2, an accuracy of 10%). Also, these results are comparable to a previous time-domain aOCT study where the mean difference in the CSA of tubes was measured to be −0.3 ± 1.75% [25], while noting that the rotation rate in this study is 4 × faster.
3.3 Airway phantom imaging
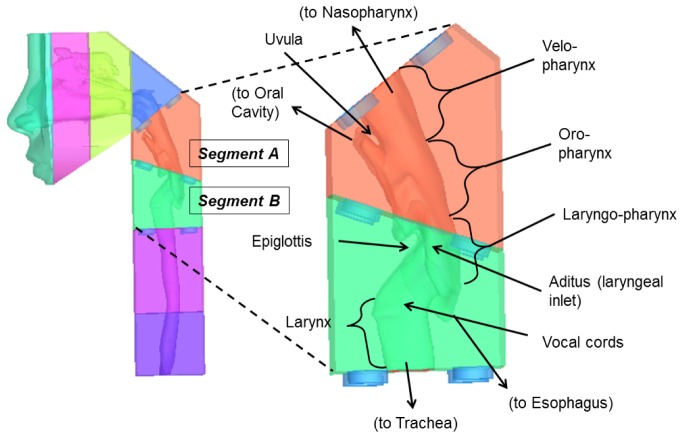
To test the feasibility of scanning pediatric airways, we fabricated an upper airway phantom as described in 2.3 above. Figure 4 shows the airway geometry used for the phantom as visualized utilizing Mimics (Materialise, Ann Arbor, MI). The phantom was 3D printed into several interlocking segments. Segments A and B (Fig. 4) were imaged by aOCT and represent the parts of the neck anterior to the vertebral column, and include the pharynx, larynx, and the upper trachea.
Fig. 4.
Airway phantom derived from a CT scan of a 10 year old boy. Left: Phantom composed of interlocking segments. Right: Close-up of segments A and B which were imaged by aOCT in this study.
It is important to note that the collected 2D aOCT data (A-lines versus time) were resampled into the 3D Cartesian object space using a nearest-neighbor algorithm. Also, correction for the slightly forward-directed angle of the beam (6.6° from true perpendicular) was performed during the resampling.
Cross-sectional aOCT scans of segment A of the phantom are shown in Fig. 5 . For comparison, corresponding luminal surfaces obtained directly from the phantom stereolithography (STL) data are also shown. Working downward from the top of the velopharynx, aOCT reveals a gradually increasing CSA with a widened shape as the opening to the oral cavity is reached. Near the bottom of the scan at the laryngeal inlet, the tissue of the epiglottis appears at the anterior surface, and partially obstructs the line-of-sight of the light beam to portions of the anterior luminal surface. This highlights one drawback of aOCT in that folds cause shadowing and line-of-sight issues that result in underestimation of the CSA; this may be partially mitigated by the fact that the same line of sight issues exist with the current clinical “gold” standard endoscopy and that these obscured regions do not exhibit as much airflow. Overall, aOCT provides excellent visualization of the upper airway anatomy. In future work, adding an electromagnetic position sensor to the aOCT fiber tip will enable tracking of the location and rotation axis of the beam, allowing for precise alignment of aOCT images with the known phantom geometry.
Fig. 5.
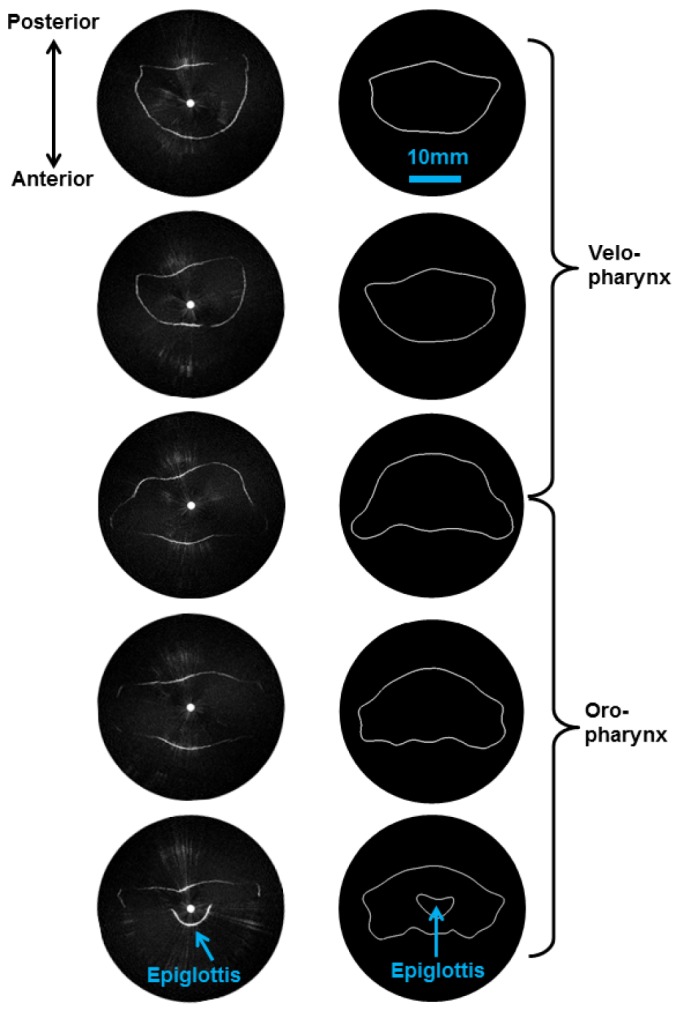
aOCT of the pediatric upper airway phantom, (segment A of Fig. 4). Left column: aOCT image slices obtained every 3.5 mm in translation, working from the top down (top of velopharynx to the laryngeal inlet). Right column: Corresponding airway segments obtained from the stereolithography data reveal that aOCT obtains qualitatively similar shape and size.
aOCT helical scans were also collected of segment B of the airway phantom which includes the larynx from the aditus down to the upper portion of the trachea. Resampled 3D data was imported into ImageSurfer (developed by the Center for Computer-Integrated Systems for Microscopy and Manipulation, UNC) to visualize the 3D geometry at different viewing angles in Fig. 6(a) -6(c). In comparison to Fig. 4, we observe the same overall anatomical features, especially the esophageal opening posteriorly, and the overall curvature in the upper airway.
Fig. 6.
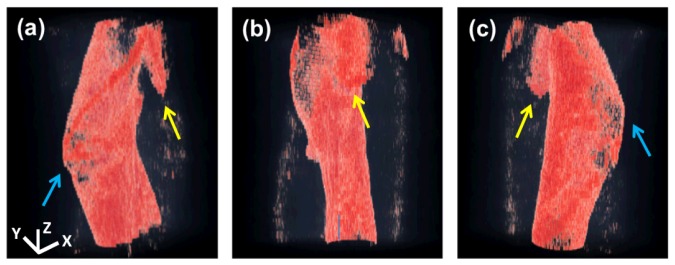
3D reconstruction of aOCT of segment B displayed at 3 different viewing angles (a)-(c). Anatomical features including the esophageal opening (yellow arrows) and anterior laryngeal “knee” (blue arrows) are part of phantom segment B as shown in Fig. 4. The x, y, and z scale bars represent 8 mm, 8 mm, and 4 mm, respectively.
3.4 Ex vivo swine airways
Swine have increasingly been utilized as biomedical research models due to their comparatively similar anatomy and physiology to those of humans; they can also be readily obtained in a size which approximates a human child. For these reasons, swine are also used as general surgical models of many organs and systems. For validation we compared the aOCT results of imaging the ex vivo swine airway to a high-resolution CT scan on the same tissue (Fig. 7 ). While the CT data was reconstructed into a 50 μm isotropic voxel, the aOCT data was reconstructed into a 25 μm isotropic voxel in order to adequately sample the axial resolution.
Fig. 7.
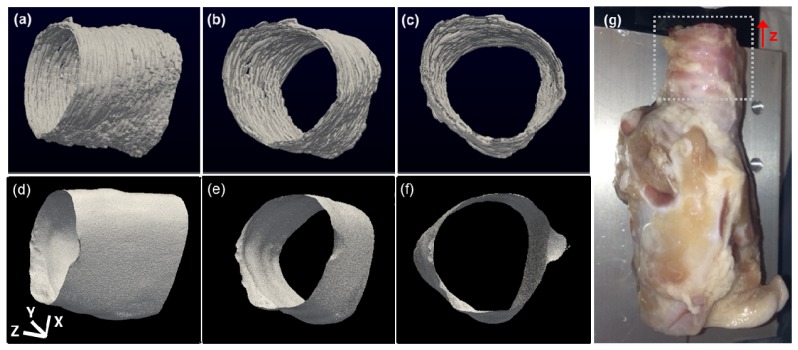
(a)-(c) aOCT images of a swine trachea displayed in three different viewing angles. (d)-(f): corresponding CT images. (g): photograph of the swine airway; the region that was imaged is indicated by the dotted square. The x, y, and z scale bars each represent 3 mm.
First, we determined the CSA for each slice within an 8 mm scan range co-registered between aOCT and CT. The aOCT CSA was computed via automated segmentation as above, while the CT CSA was computed by simple thresholding and boundary sizing. The average aOCT CSA over the scan was 266 ± 4 mm2, in comparison to 247 ± 8 mm2 for CT. When comparing co-registered slices, there was a mean difference (CSA of CT minus that of aOCT) of −7.8 ± 2.8%, or 19.2 ± 6.3 mm2 in units of area. In comparison, a previous study of in vivo human airways demonstrated a mean CSA difference of −15.1 ± 16.3% between CT and aOCT [25], while another reported a mean CSA difference in area units of 14.1 ± 25.4 mm2 [10]. We also note that these previous studies employed manual segmentation, which may slightly impact the measured CSA due to intra-observer variability, which was estimated to be 0.5 ± 1.5% [25].
For qualitative comparison, ImageSurfer was used to threshold and visualize the airway luminal surfaces obtained by aOCT and CT at different viewing angles (Fig. 7). Overall, the area and shape of the airway is consistent between the modalities, while bearing in mind that the aOCT scan required <10s, compared to >1 hour for the CT scan. While CT is a current standard for quantifying airway luminal geometry, aOCT can potentially provide a scenario with less risk due to the dramatically shorter imaging time and eliminating the use of ionizing radiation.
4. Conclusion
In summary, we have investigated an aOCT system designed for use with a standard flexible pediatric endoscope in order to provide a platform with which clinicians are already familiar, and which also offers concomitant video imaging and haptic feedback via the scope tip. We have shown that the aOCT system provides accurate CSA measurements in tubes, and that airway luminal imaging in phantoms and ex vivo tissues is consistent with the known geometries. Furthermore, improved accuracy in 3D reconstructions may be obtained in future work by position tracking of the fiber tip; in particular, previously reported magnetic tracking methods for freehand imaging [26, 27] may be appropriate to account for the arbitrary curvature of the fiber tip during a pullback scan in the airways.
While the speed of this aOCT system is sufficient to produce a pullback scan within <10s, the translation to in vivo studies requires the ability to track dynamic respiratory motion and therefore may necessitate further increase to the sweep rate of the long-coherence length light source. This may be enabled by employing one of the VCSEL-based wavelength-swept light sources that have been recently reported [28–30]. For clinical translation, it will also be important to offer real-time display of the 2D luminal cross-section and 3D airway anatomy, which can be accomplished using accelerated computing via graphics processing units (GPUs) [31].
Importantly, the high accuracy of the upper airway luminal geometries obtained by aOCT can inform more accurate models for computational fluid dynamics (CFD) of airflow. As previously seen in aOCT-based studies of obstructive sleep apnea [11], aOCT can provide unprecedented dynamic airway imaging that, in conjunction with CFD, gives new insight into obstructive breathing disorders. These high resolution aOCT-derived geometries can also lead to methods for predictive modeling of airway disorders which can aid in medical and surgical decision-making. Also, this aOCT system design will allow clinicians to collect images whenever airway endoscopy would normally be performed, which is the current standard used for diagnosis of airway obstruction.
Acknowledgments
We thank Prof. Russell Taylor and Dr. Cory Quammen at UNC for their help with 3D visualization using ImageSurfer. This work was supported by funding from the National Institutes of Health, National Heart, Blood, and Lung Institute via grants R01 HL105241 (Stephanie Davis, Richard Superfine, Carlton Zdanski, PIs), R21 HL111968 (Oldenburg, PI), R21 HL109832 (Oldenburg, PI), and P41 EB002025 (Richard Superfine, PI).
References and links
- 1.AlGhanim N., Comondore V. R., Fleetham J., Marra C. A., Ayas N. T., “The economic impact of obstructive sleep apnea,” Lung 186(1), 7–12 (2008). 10.1007/s00408-007-9055-5 [DOI] [PubMed] [Google Scholar]
- 2.Daniel S. J., “The upper airway: congenital malformations,” Paediatr. Respir. Rev. 7(Suppl 1), S260–S263 (2006). 10.1016/j.prrv.2006.04.227 [DOI] [PubMed] [Google Scholar]
- 3.Mihaescu M., Murugappan S., Gutmark E., Donnelly L. F., Kalra M., “Computational modeling of upper airway before and after adenotonsillectomy for obstructive sleep apnea,” Laryngoscope 118(2), 360–362 (2008). 10.1097/MLG.0b013e31815937c1 [DOI] [PubMed] [Google Scholar]
- 4.Abramson Z., Susarla S., Troulis M., Kaban L., “Age-related changes of the upper airway assessed by 3-dimensional computed tomography,” J. Craniofac. Surg. 20(5Suppl 1), 657–663 (2009). 10.1097/SCS.0b013e318193d521 [DOI] [PubMed] [Google Scholar]
- 5.Arens R., McDonough J. M., Corbin A. M., Hernandez M. E., Maislin G., Schwab R. J., Pack A. I., “Linear dimensions of the upper airway structure during development: assessment by magnetic resonance imaging,” Am. J. Respir. Crit. Care Med. 165(1), 117–122 (2002). 10.1164/ajrccm.165.1.2107140 [DOI] [PubMed] [Google Scholar]
- 6.Huang D., Swanson E. A., Lin C. P., Schuman J. S., Stinson W. G., Chang W., Hee M. R., Flotte T., Gregory K., Puliafito C. A., Fujimoto J. G., “Optical coherence tomography,” Science 254(5035), 1178–1181 (1991). 10.1126/science.1957169 [DOI] [PMC free article] [PubMed] [Google Scholar]
- 7.Armstrong J. J., Leigh M. S., Walton I. D., Zvyagin A. V., Alexandrov S. A., Schwer S., Sampson D. D., Hillman D. R., Eastwood P. R., “ In vivo size and shape measurement of the human upper airway using endoscopic longrange optical coherence tomography,” Opt. Express 11(15), 1817–1826 (2003). 10.1364/OE.11.001817 [DOI] [PubMed] [Google Scholar]
- 8.McLaughlin R. A., Armstrong J. J., Becker S., Walsh J. H., Jain A., Hillman D. R., Eastwood P. R., Sampson D. D., “Respiratory gating of anatomical optical coherence tomography images of the human airway,” Opt. Express 17(8), 6568–6577 (2009). 10.1364/OE.17.006568 [DOI] [PubMed] [Google Scholar]
- 9.McLaughlin R. A., Williamson J. P., Phillips M. J., Armstrong J. J., Becker S., Hillman D. R., Eastwood P. R., Sampson D. D., “Applying anatomical optical coherence tomography to quantitative 3D imaging of the lower airway,” Opt. Express 16(22), 17521–17529 (2008). 10.1364/OE.16.017521 [DOI] [PubMed] [Google Scholar]
- 10.Armstrong J. J., Leigh M. S., Sampson D. D., Walsh J. H., Hillman D. R., Eastwood P. R., “Quantitative upper airway imaging with anatomic optical coherence tomography,” Am. J. Respir. Crit. Care Med. 173(2), 226–233 (2006). 10.1164/rccm.200507-1148OC [DOI] [PubMed] [Google Scholar]
- 11.Cisonni J., Lucey A. D., Walsh J. H., King A. J., Elliott N. S., Sampson D. D., Eastwood P. R., Hillman D. R., “Effect of the velopharynx on intraluminal pressures in reconstructed pharynges derived from individuals with and without sleep apnea,” J. Biomech. 46(14), 2504–2512 (2013). 10.1016/j.jbiomech.2013.07.007 [DOI] [PubMed] [Google Scholar]
- 12.Coxson H. O., Mayo J., Lam S., Santyr G., Parraga G., Sin D. D., “New and current clinical imaging techniques to study chronic obstructive pulmonary disease,” Am. J. Respir. Crit. Care Med. 180(7), 588–597 (2009). 10.1164/rccm.200901-0159PP [DOI] [PubMed] [Google Scholar]
- 13.Williamson J. P., McLaughlin R. A., Noffsinger W. J., James A. L., Baker V. A., Curatolo A., Armstrong J. J., Regli A., Shepherd K. L., Marks G. B., Sampson D. D., Hillman D. R., Eastwood P. R., “Elastic properties of the central airways in obstructive lung diseases measured using anatomical optical coherence tomography,” Am. J. Respir. Crit. Care Med. 183(5), 612–619 (2011). 10.1164/rccm.201002-0178OC [DOI] [PubMed] [Google Scholar]
- 14.Williamson J. P., McLaughlin R. A., Phillips M. J., Armstrong J. J., Becker S., Walsh J. H., Sampson D. D., Hillman D. R., Eastwood P. R., “Using optical coherence tomography to improve diagnostic and therapeutic bronchoscopy,” Chest J. 136(1), 272–276 (2009). [DOI] [PubMed] [Google Scholar]
- 15.Delacrétaz Y., Shaffer E., Pavillon N., Kuhn J., Lang F., Depeursinge C., “Endoscopic low-coherence topography measurement for upper airways and hollow samples,” J. Biomed. Opt. 15(6), 066014 (2010). 10.1117/1.3512218 [DOI] [PubMed] [Google Scholar]
- 16.Coxson H. O., Eastwood P. R., Williamson J. P., Sin D. D., “Phenotyping airway disease with optical coherence tomography,” Respirology 16(1), 34–43 (2011). 10.1111/j.1440-1843.2010.01888.x [DOI] [PubMed] [Google Scholar]
- 17.Choma M., Sarunic M., Yang C., Izatt J., “Sensitivity advantage of swept source and Fourier domain optical coherence tomography,” Opt. Express 11(18), 2183–2189 (2003). 10.1364/OE.11.002183 [DOI] [PubMed] [Google Scholar]
- 18.Jing J., Zhang J., Loy A. C., Wong B. J., Chen Z., “High-speed upper-airway imaging using full-range optical coherence tomography,” J. Biomed. Opt. 17(11), 110507 (2012). 10.1117/1.JBO.17.11.110507 [DOI] [PMC free article] [PubMed] [Google Scholar]
- 19.Yin J., Liu G., Zhang J., Yu L., Mahon S., Mukai D., Brenner M., Chen Z., “In vivo early detection of smoke-induced airway injury using three-dimensional swept-source optical coherence tomography,” J. Biomed. Opt. 14(6), 060503 (2009). 10.1117/1.3268775 [DOI] [PMC free article] [PubMed] [Google Scholar]
- 20.Yu L., Liu G., Rubinstein M., Saidi A., Wong B. J. F., Chen Z., “Office-based dynamic imaging of vocal cords in awake patients with swept-source optical coherence tomography,” J. Biomed. Opt. 14(6), 06402 (2009). [DOI] [PMC free article] [PubMed] [Google Scholar]
- 21.Stefano G. T., Bezerra H. G., Mehanna E., Yamamoto H., Fujino Y., Wang W., Attizzani G., Chamié D., Simon D. I., Costa M. A., “Unrestricted utilization of frequency domain optical coherence tomography in coronary interventions,” Int. J. Cardiovasc. Imaging 29(4), 741–752 (2013). 10.1007/s10554-012-0135-0 [DOI] [PubMed] [Google Scholar]
- 22.Dhalla A.-H., Izatt J. A., “Complete complex conjugate resolved heterodyne swept-source optical coherence tomography using a dispersive optical delay line,” Biomed. Opt. Express 2(5), 1218–1232 (2011). 10.1364/BOE.2.001218 [DOI] [PMC free article] [PubMed] [Google Scholar]
- 23.Wijesundara K. C., Iftimia N. V., Oldenburg A. L., “Design of a swept-source, anatomical OCT system for pediatric bronchoscopy,” Proc. SPIE 8571, 85713K (2013). 10.1117/12.2004226 [DOI] [PMC free article] [PubMed] [Google Scholar]
- 24.Marks D. L., Oldenburg A. L., Reynolds J. J., Boppart S. A., “Autofocus algorithm for dispersion correction in optical coherence tomography,” Appl. Opt. 42(16), 3038–3046 (2003). 10.1364/AO.42.003038 [DOI] [PubMed] [Google Scholar]
- 25.Williamson J. P., Armstrong J. J., McLaughlin R. A., Noble P. B., West A. R., Becker S., Curatolo A., Noffsinger W. J., Mitchell H. W., Phillips M. J., Sampson D. D., Hillman D. R., Eastwood P. R., “Measuring airway dimensions during bronchoscopy using anatomical optical coherence tomography,” Eur. Respir. J. 35(1), 34–41 (2010). 10.1183/09031936.00041809 [DOI] [PubMed] [Google Scholar]
- 26.Lau B., McLaughlin R. A., Curatolo A., Kirk R. W., Gerstmann D. K., Sampson D. D., “Imaging true 3D endoscopic anatomy by incorporating magnetic tracking with optical coherence tomography: proof-of-principle for airways,” Opt. Express 18(26), 27173–27180 (2010). 10.1364/OE.18.027173 [DOI] [PubMed] [Google Scholar]
- 27.Yeo B. Y., McLaughlin R. A., Kirk R. W., Sampson D. D., “Enabling freehand lateral scanning of optical coherence tomography needle probes with a magnetic tracking system,” Biomed. Opt. Express 3(7), 1565–1578 (2012). 10.1364/BOE.3.001565 [DOI] [PMC free article] [PubMed] [Google Scholar]
- 28.Ahsen O. O., Tao Y. K., Potsaid B. M., Sheikine Y., Jiang J., Grulkowski I., Tsai T.-H., Jayaraman V., Kraus M. F., Connolly J. L., Hornegger J., Cable A., Fujimoto J. G., “Swept source optical coherence microscopy using a 1310 nm VCSEL light source,” Opt. Express 21(15), 18021–18033 (2013). 10.1364/OE.21.018021 [DOI] [PMC free article] [PubMed] [Google Scholar]
- 29.Grulkowski I., Liu J. J., Potsaid B., Jayaraman V., Jiang J., Fujimoto J. G., Cable A. E., “High-precision, high-accuracy ultralong-range swept-source optical coherence tomography using vertical cavity surface emitting laser light source,” Opt. Lett. 38(5), 673–675 (2013). 10.1364/OL.38.000673 [DOI] [PMC free article] [PubMed] [Google Scholar]
- 30.Jayaraman V., Cole G. D., Robertson M., Burgner C., John D., Uddin A., Cable A., “Rapidly swept, ultra-widely-tunable 1060 nm MEMS-VCSELs,” Electron. Lett. 48(21), 1331–1333 (2012). 10.1049/el.2012.3180 [DOI] [PMC free article] [PubMed] [Google Scholar]
- 31.Jian Y., Wong K., Sarunic M. V., “Graphics processing unit accelerated optical coherence tomography processing at megahertz axial scan rate and high resolution video rate volumetric rendering,” J. Biomed. Opt. 18(2), 026002 (2013). 10.1117/1.JBO.18.2.026002 [DOI] [PubMed] [Google Scholar]


