Abstract
Volume regulation under osmotic loading is one of the most fundamental functions in cells and organelles. However, the effective method to detect volume changes of a single organelle has not been developed. Here, we present a novel technique for detecting volume changes of a single isolated mitochondrion in aqueous solution based on the transmittance of the light through the mitochondrion. We found that 70% and 21% of mitochondria swelled upon addition of a hypotonic solution and Ca2+, respectively. These results show the potential of the present technique to detect the physiological volume changes of individual small organelles such as mitochondria.
OCIS codes: (170.2655) Functional monitoring and imaging, (000.1430) Biology and medicine
1. Introduction
Volume regulation is one of the most important functions in cells and organelles. When osmolality in the environment decreases, most cells extrude cytosolic solutes and water to reduce the osmotic imbalance between the internal and external environments of the cell [1,2]. Following an increase in environmental osmolality, C11-MDCK cells alter protein phosphorylation and ion transport properties, while bacteria accumulate organic osmolytes [3,4]. In mitochondria, osmotic imbalance across the inner membrane leads to outer membrane rupture [5,6]. This can result in the release of proapoptotic proteins such as cytochrome c and Smac/DIABLO, which are present in the intermembrane space, and may thus lead to cellular apoptosis [7].
To elucidate the mechanism underlying volume regulation, volume changes of active cells and organelles should be detected in aqueous solutions. For small substances such as bacteria and mitochondria, light scattering experiments of the suspensions have been performed to detect volume changes [1,8]. However, since light scattering studies have been performed using mitochondria or bacteria ensemble, the results represent average values for a large number of mitochondria or bacteria. Therefore, when measuring the light scattering of suspensions, information such as how the volume of a single substance changes in response to osmotic challenges cannot be measured. To overcome this limitation, it is necessary to simultaneously and time-dependently measure volume changes and other phenomena that occur prior to or after the change in volume. Optical microscopy has significant advantages over other optical or microscopic methods for resolving these issues.
Measurements of mitochondrial volume and morphology using optical microscopy have primarily been performed for intracellular mitochondria. However, when examining mitochondrial responses to osmotic loading, isolated mitochondria have several advantages over intracellular mitochondria. Because mitochondrial morphology frequently changes in living cells, it is difficult to determine whether the observed volume changes are due to typical morphological changes or whether they are responses to osmotic loading. Additionally, because the environment around intracellular mitochondria cannot be controlled, it is difficult to identify factors affecting mitochondrial volume changes. Despite these advantages, volume changes of single isolated mitochondria have not been detected using optical microscopy, possibly because isolated mitochondria are so small with the diameter of approximately 1 μm that diameter changes in response to osmotic loading cannot be detected using this method.
In the present study, we developed a novel method for detecting volume changes of single isolated mitochondria using optical microscopy and successfully detected the swelling of single mitochondrion in response to hypotonic solution and Ca2+. Optical microscopy is an excellent method for measuring objects in aqueous solutions; therefore, this method will be useful for elucidating the mechanism underlying volume regulation of bacteria and small membrane-surrounded organelles such as mitochondria.
2. Methods
2.1 Imaging of mitochondria
To detect swelling of a single mitochondrion, we obtained transmitted light images of individual mitochondria adsorbed on a coverslip by using an inverted epifluorescence microscope (IX-70; Olympus Corporation, Tokyo, Japan) equipped with a 40 × objective lens (Uapo40 × /340; NA = 0.90; Olympus Corporation) and a cooled CCD camera (Sensicam QE, PCO AG; Kelheim, Germany). As the illumination optics, the conventional Koehler illumination setup with a 100W halogen lamp was used. For the microscopic field, we acquired 20xy planes by changing the focus at 0.2-μm z-spacing as shown in Fig. 1 . Each image was obtained with binning pixel of 1 × 1 and exposure time of 1 s. One stack of images consisting of 20xy planes were acquired within 1 min, and acquisition of the stack was repeated at intervals of 2 min. The wavelength used for the measurements was selected using a 10-nm bandpass filter centered at 546 nm [13], because the effects of redox changes of mitochondrial proteins on the absorption of mitochondrial suspensions are small within this range of the wavelength. Actually, the absorption change of a mitochondrion upon addition of reducing reagent was not detected under the present conditions.
Fig. 1.
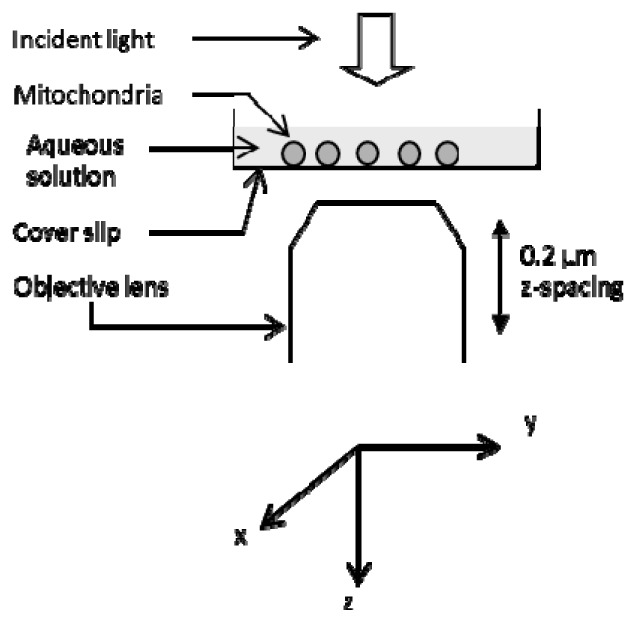
Image acquisition for analysis of transmitted light. Mitochondria on a coverslip were illuminated using a light from a 100-W halogen lamp. Transmitted light images of individual mitochondria were acquired by changing the positions of the objective lens along the optical axis (z-axis). The details are described in the text.
Calcein fluorescence in mitochondria was monitored after swelling measurements with exposure by a 75-W xenon lamp through a 20-nm bandpass filter centered at 480 nm. Illumination intensity was reduced to 6% using a neutral density filter. Light emitted between 515 and 550 nm was collected using a cooled CCD camera described above. Binning and the exposure time of the CCD camera were 1 × 1 and 1 s, respectively.
2.2 Effects of swelling on the light transmitted through a mitochondrion
Mitochondrial swelling is caused by the influx of water from the medium to mitochondria. Since major components of mitochondria are protein, lipid and water, the influx of water into mitochondria leads to the decrease in the refractive index of mitochondria. This is because the refractive indices of protein solution and hydrogenated oil (a model of physiological lipid) are larger than the refractive index of water [10,11].
The curvature and the refractive index of the mitochondrion decrease upon swelling; hence, the angle between the incident light and transmitted light should decrease as shown in Figs. 2(A) , 2(B). In addition, the reflection of the incident light on the mitochondrial surface should decrease. Taken together, the intensity of transmitted light at a small region within a mitochondrion image should increase upon swelling.
Fig. 2.
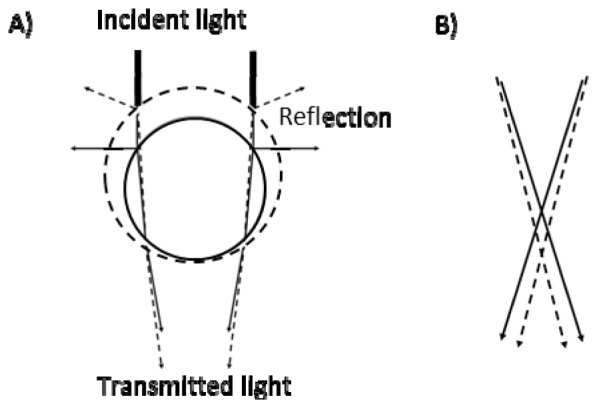
Trace of the light passing through a mitochondrion. A) Reflection and refraction of the light. Circles drawn in a solid line and a broken line shows mitochondria before and after swelling, respectively. Bold lines indicate the incident light. Solid lines indicate the reflection by or transmitted light through mitochondria before swelling. Broken lines indicate the reflection by or transmitted light through swelled mitochondria. B) The trace of the light near the focus. Solid and broken lines indicate the light after passing through a mitochondrion before and after swelling, respectively.
2.3 Analysis of the transmitted light images of a mitochondrion
To analyze the transmitted light images of a mitochondrion, we selected a mitochondrion near the center of the field of view, and encompassed the mitochondrion with a square that was 30 pixels on each side as shown in Fig. 3(A) . The average intensity within in a 3x3 pixel zone was computed for every pixel across a 30x30 region centered on the mitochondrion. This resulted in a total of 784 average intensities. Then, the minimum intensity among 784 intensities was divided by the average intensity of the blank area (15x15 region) near the mitochondrion. The ratio at the mitochondrion in the plane was termed Rplane. Since there were 20 images per mitochondrion in the stack as shown in Fig. 3(B), we analyzed these 20 values of Rplane for each mitochondrion as a function of the z-position.
Fig. 3.

Analysis of transmittance. A) An image of a single mitochondrion and a square region (30 × 30 pixels) to be analyzed. This region encompassing a single mitochondrion was scanned with a small region (3 × 3 pixels). Average intensities within the small regions were calculated. Bar, 1 μm. B) Obtained stack consisting of the 20xy planes. A square shown in a dotted line demonstrates the region in which the average intensity was at the minimum
In the present study, we acquired one stack of images consisting of 20xy planes at different z-positions of the objective lens. As shown in Fig. 4(A) , when the objective lens was close to the mitochondrion, the transmitted light image of the mitochondrion was small and bright because the mitochondrion played the role of a condenser lens. When the objective lens was away from mitochondria, image contrast strengthened and the image became bigger. When the objective lens was even further away from the mitochondrion, image contrast weakened. As shown in Fig. 4(B), most mitochondria showed a local minimum value of Rplane. The local minimum value of Rplane was termed the transmittance of light at the mitochondrion (T). When the local minimum value did not exist within the examined regions of z-positions, we omitted the mitochondrion from the analysis. These analyses enabled us to obtain the transmittance that was not affected by the slight drift in the z-position of the objective lens.
Fig. 4.
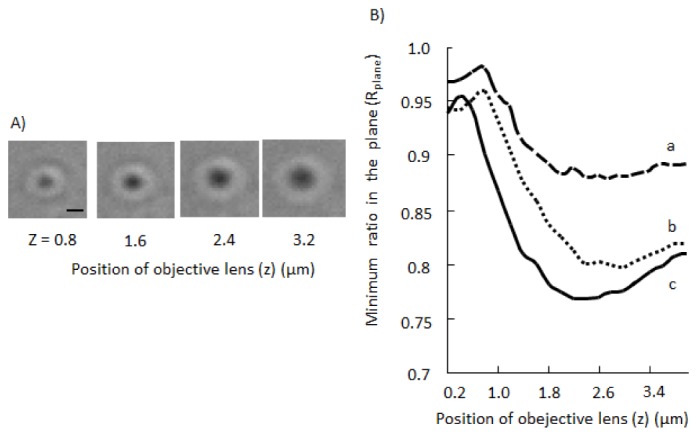
Effects of the z-position of the objective lens on a transmitted light image of a mitochondrion. A) Transmitted light images of a mitochondrion at different z-positions of the objective lens. We set z = 0 at an appropriate position. Bar, 1 μm. B) Dependence of Rplane on the z-position. Rplanes of 3 different mitochondria (a, b, c) in the same microscopic field are shown. Definition of Rplane is written in “Methods” section
2.4 Preparation of mitochondria
Mitochondria were isolated from porcine hearts obtained from a local slaughterhouse by differential centrifugation as previously described [12]. Each preparation was assayed for ATP production [13] upon addition of 5 mM Na-malate, giving a rate of 370 ± 32 nmol ATP/mg of protein/min (mean ± SE, n = 5), which was comparable to the values reported previously [14]. For microscopic measurements, mitochondria were adsorbed onto a glass-bottom culture dish (35 mm in diameter) at approximately 106 mitochondria/dish. Mitochondria were then incubated for 90 min in an isotonic solution (10 mM Tris-HCl, 250 mM sucrose, 1 mM EGTA, 1 mM KH2PO4, pH 7.4) and were washed twice before microscopic measurements [15]. Adsorption and washing were performed at 4°C. Protein content was determined using a protein assay with BSA as a standard. To examine whether the inner mitochondrial membrane was ruptured after induction of swelling, calcein, a hydrophilic fluorescent dye, was entrapped in mitochondria prior to the induction of swelling. For this purpose, mitochondria on a cover slip were incubated with 1 μM calcein-AM for 30 min at room temperature and washed twice with the isotonic solution.
2.5 Induction of swelling
To induce swelling of mitochondria, osmolality of the solution in which mitochondria were bathed was decreased by addition of a hypotonic solution (10 mM Tris-HCl, 1 mM EGTA, 1 mM KH2PO4, pH 7.4). The final concentration of sucrose was 50 mM. To measure Ca2+-induced swelling of mitochondria, Ca2+ was added to the isotonic solution with 2mM phosphate, 2nM TMRE, 3mM sodium malate, 3mM glutamate to obtain a final Ca2+ concentration of 200 μM in the isotonic solution. Cyclosporin A (CsA) was added at 1 μM. All procedures described above were performed at 25°C.
2.6 Reagents
Calcein-AM was purchased from Dojindo Laboratories (Kumamoto, Japan). CsA was obtained from Sigma-Aldrich Co. (St. Louis, MO). All other chemicals were of the highest purity commercially available.
2.7 Statistical analysis
The results are expressed as mean ± SEM. Data was analyzed by analysis of variance followed by the Student-Newman-Keuls test. Differences were considered statistically significant when P values were less than 0.05.
3. Results
3.1 Hypotonic solution-induced changes in transmitted light images of a single mitochondrion
To examine whether swelling of a single mitochondrion can be detected as a change in transmitted light images, we added a hypotonic solution to mitochondria adsorbed on a coverslip and obtained transmitted light images. Figure 5(A) shows that addition of the hypotonic solution to mitochondria weakened the contrast of the images. Figure 5(B) demonstrates that addition of the hypotonic solution increased T within 2 min. Five minutes after adding the hypotonic solution, T reached a plateau. The increase in the diameter of the transmitted light image of the mitochondrion was not observed. On the other hand, addition of the isotonic solution did not induce significant changes in T or the diameter. When we inhibited the swelling of mitochondria by fixing mitochondrial proteins with formaldehyde, we did not observe the increase in T upon addition of the hypotonic solution. These results support the hypothesis that swelling of a single mitochondrion can be detected as an increase in T.
Fig. 5.
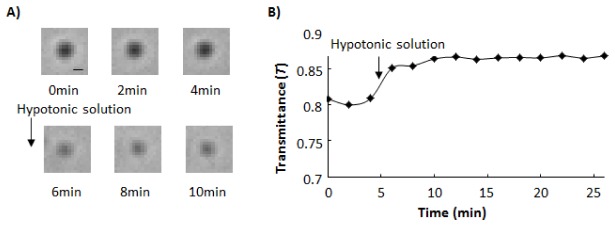
Time-course of changes in transmittance (T) at a mitochondrion. Hypotonic solution was added to mitochondria at t = 5 min. A) Sequential images of a single mitochondrion before and after addition of hypotonic solution. Time interval between each image was 2 min. Each image was obtained in the plane where Rplane showed the local minimum value. Bar, 1 μm. B) Time-course of changes in T at the single mitochondrion. Definitions of Rplane and T are written in “Methods” and “Results” section, respectively
3.2 Determination of the threshold for the significant increase in T
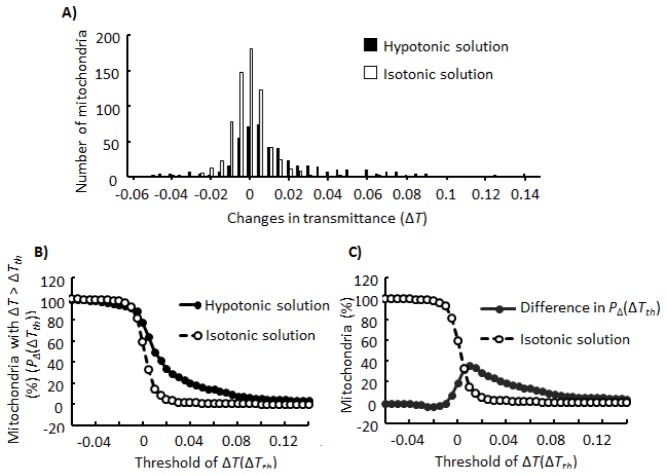
To decide whether a mitochondrion swelled in response to a stimulus, it is necessary to fix the threshold of the significant increase in T. For this purpose, we examined the distribution of changes in T (ΔT) as shown in Fig. 6(A) . Following addition of the isotonic solution to mitochondria, ΔTs were mainly distributed between −0.020 and 0.020, with a distribution peak at ΔT = 0.000. In contrast, following addition of the hypotonic solution, the distribution peak was shifted to ΔT = 0.005, and the percentage of mitochondria with ΔT > 0.020 was increased. Next, we analyzed the percentage of mitochondria for which ΔT s were larger than the threshold ΔTth. Here, we term this percentage PΔ(ΔTth). As shown in Fig. 6(B), between ΔTth = 0.005 and 0.040, PΔ(ΔTth) upon addition of the hypotonic solution was larger than PΔ(ΔTth) upon addition of the isotonic solution. Although Fig. 6(C) demonstrates that the difference between these 2 PΔ(ΔTth)s showed a peak at ΔTth = 0.010, we fixed ΔTth at 0.020 as the threshold of the significant increase in T to enable selection of mitochondria that showed swelling in response to osmotic imbalance. This is because PΔ(0.010) following addition of the isotonic solution was not low (15%) as shown in Fig. 6(B), although PΔ(0.020) following addition of the isotonic solution was 4%.
Fig. 6.
Distributions of ΔTs. A) Distributions of ΔTs upon addition of the hypotonic or isotonic solution. B) The percentage of mitochondria for which ΔTs are larger than ΔTth that is indicated on the horizontal axis (PΔ(ΔTth)). C) Difference between PΔ(ΔTth) upon addition of the hypotonic solution and PΔ(ΔTth) upon addition of isotonic solution (closed circles). Open circles indicate PΔ(ΔTth) upon addition of the isotonic solution. Definitions of ΔT, ΔTth, and PΔ(ΔTth) are described in the “Results” section.
3.3 Determination of mitochondrial population to be analyzed
In order to precisely characterize mitochondria swelling using ΔTth = 0.020, a mitochondria population to be analyzed must be identified. Thus, we examined the dependence of ΔT on the initial transmittance (Tinit), which is the transmittance before a stimulus is applied. Figure 7(A) shows that, in the range of Tinit > 0.90, the number of mitochondria showing a ΔT < 0.020 following addition of the hypotonic solution was much higher than the number of mitochondria showing a ΔT > 0.020. This result indicates that mitochondria for which Tinits were high had a tendency not to show ΔT > 0.020. Next, we examined the percentage of mitochondria with ΔT > 0.020 following addition of the hypotonic solution when mitochondria used for analysis were limited to mitochondria with Tinits less than the indicated Tinit,th as shown in Fig. 7(B). Here, we term this percentage P0.02(Tinit,th). When Tinit,th was between 0.74 and 0.90, P0.02(Tinit,th) did not significantly depend on Tinit,th and remained at approximately 65%. In contrast, when Tinit,th was greater than 0.90, P0.02(Tinit,th) significantly decreased as Tinit,th increased. The mitochondrial population analyzed should be sufficiently large and the range of Tinit,th where P0.02(Tinit,th) does not significantly change may to some extent depend on mitochondria preparation used; hence, we used 0.87 as Tinit,th to determine the population of mitochondria to be analyzed. With a Tinit,th = 0.87, we obtained high reproducibility for the percentage of mitochondria with ΔT > 0.020 following addition of the hypotonic solution.
Fig. 7.

Dependence of PΔ(0.02) upon addition of hypotonic solution on Tinit. All mitochondria images recognized as single mitochondria were analyzed. A) The distributions of Tinits. Mitochondria with ΔT > 0.02 and mitochondria with ΔT < 0.02 are indicated separately. B) P0.02(Tinit,th) and the percentage of mitochondria with Tinits < Tinit,th indicated in the horizontal axis. Definitions of ΔT, PΔ(ΔTth), Tinit, Tinit,th, and P0.02(Tinit,th) are described in the “Results” section.
3.4 The absence of release of the mitochondrial solutes
In addition to swelling, the release of solutes from mitochondria might contribute to increased transmittance. To examine whether mitochondrial solutes were released upon addition of the hypotonic solution, we observed calcein fluorescence in mitochondria after addition of the hypotonic or isotonic solution. Mitochondria images with Tinit < 0.87 were analyzed. As shown in Fig. 8 , the fluorescence intensity of mitochondrial calcein after adding the hypotonic solution was similar to that after adding the isotonic solution. Additionally, there was no significant correlation between ΔT and calcein fluorescence in mitochondria after adding the hypotonic solution. Because calcein fluorescence should decrease when mitochondrial solutes are released, our results indicate that mitochondrial solutes were not significantly released upon addition of the hypotonic solution. Taken together, the observed increase in transmittance for single mitochondria suggests swelling of mitochondria.
Fig. 8.
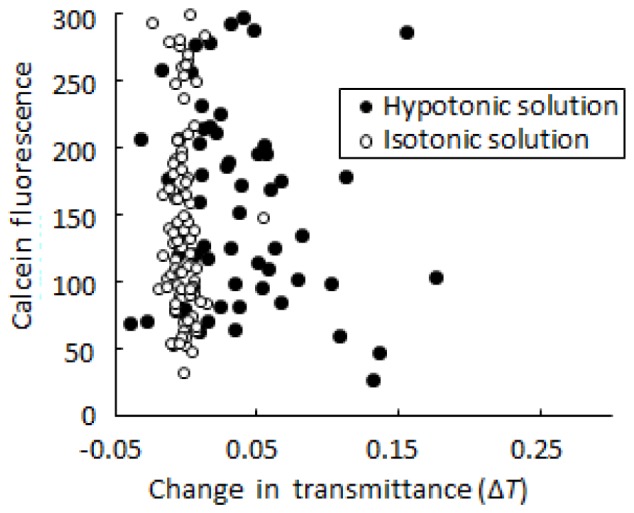
Scatter diagram of ΔT and calcein fluorescence. Closed circles, mitochondria to which hypotonic buffer was added; open circles, mitochondria to which isotonic buffer was added.
3.5 Swelling of mitochondria upon addition of hypotonic solution or Ca2+
Ca2+ is known to induce the swelling of mitochondria [16]. To compare Ca2+-induced and hypotonic solution-induced swelling of mitochondria, we examined the percentage of mitochondria that underwent swelling upon addition of Ca2+ or hypotonic solution. The thresholds used were ΔTth = 0.02 and Tinit,th = 0.87; the results are shown in Figs. 9(A) , 9(B). Upon addition of isotonic solution without Ca2+ to mitochondria, 6% of mitochondria underwent swelling (P0.02 (0.87)). For hypotonic solution without Ca2+, this percentage increased to 70%. Upon addition of the isotonic solution with Ca2+ at 200 μM, 21% of mitochondria showed swelling. CsA decreased the percentage to 13%. The observed CsA-dependent swelling of mitochondria induced by Ca2+ is consistent with the results of previous studies [14].
Fig. 9.
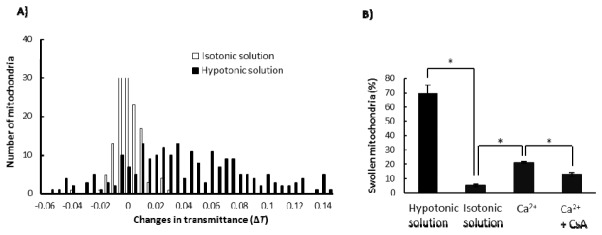
Swelling of mitochondria with Tinit < 0.87. A) Distributions of ΔTs upon addition of the hypotonic and isotonic solutions. B) Percentages of swollen mitochondria P0.02 (0.87). Values represent the mean ± SEM (n >4). *, P < 0.05.
4. Discussions
In the present study, we developed a novel method for detecting swelling of a single mitochondrion in response to osmotic loading. In this method, swelling of a mitochondrion was detected as an increase in light transmittance through a mitochondrion. Additionally, by determining thresholds for ΔT and Tinit, the percentages of mitochondria showing swelling in response to stimuli were calculated.
This is the first method that has been developed to detect swelling of single isolated mitochondrion in an aqueous solution. Since this procedure is performed using a conventional optical microscope, in combination with fluorescence microscopy, mitochondrion swelling can be measured time-dependently and simultaneously with other phenomena that occur before or after volume changes in the same mitochondrion. Therefore, this method will be useful for the study on the mechanism underlying the swelling of mitochondria. Thus far, mitochondrial volume changes have been primarily examined using mitochondrial suspensions by monitoring scattering or light transmittance [8,13,17]. Although these experiments have promoted our understanding of mitochondrial behaviors, dynamic behaviors not synchronized among mitochondria cannot be precisely detected using these methods. This is because information obtained using these methods is based on behaviors averaged over a number of mitochondria. Electron microscopy has been used to detect volume changes of mitochondria. However, it is impossible to detect the response to osmotic loading using electron microscopy because this method requires water to be removed from the sample. Recently, atomic force microscopy has been used to compare sizes of mitochondria isolated from cells [18]. Although atomic force microscopy is a promising technique for simultaneously observing plural events, it must be used in combination with another technique such as optical microscopy. Thus, the systems for measuring mitochondrial responses to osmotic loading are complicated.
In the present study, we selected mitochondria with ΔT > 0.020 as those that underwent swelling. However, slight swelling of mitochondria with ΔT < 0.020 can occur, as the peak of distribution of ΔTs upon addition of the hypotonic solution was ΔT = 0.005 and higher than the peak upon addition of the isotonic solution. Therefore, although we set the threshold at ΔT = 0.020 to precisely select mitochondria that swelled in response to the hypotonic solution, the percentage of swollen mitochondria was possibly underestimated. For Tinit, we used Tinit,th = 0.87 as a threshold of initial transmittance. Using this value, the percentage of mitochondria analyzed is limited to approximately 30% of total mitochondria. However, mitochondria already broken or swollen before addition of the hypotonic solution would show high Tinit and should be omitted from the analysis.
To determine light transmittance through a single mitochondrion, we acquired 20 images of a mitochondrion by changing the position of the objective lens along the optical axis. This procedure limits the time resolution of the swelling measurements. However, this is required to eliminate the effects of possible bending of a coverslip upon addition of the hypotonic solution and the effects of possible drift of the objective lens on the transmittance.
5. Conclusions
We found that swelling of a single mitochondrion could be detected as an increase in the light transmittance through the mitochondrion. Although we cannot quantitatively analyze volume changes, the percentage of mitochondria (P0.02(0.87)) and changes in transmittance (ΔT) can be analyzed. Additionally, because swelling can be measured simultaneously with other phenomena, the present method will be useful for elucidating the mechanism underlying volume regulation of small membrane-surrounded cells or organelles such as mitochondria and bacteria.
Acknowledgments
We thank Ms. S. Ishii for her technical assistance. This research was supported by the Ministry of Education, Science, Sports and Culture, Grant-in-Aid for Scientific Research (B)22310078 and (C) 22570158.
References and links
- 1.Boer M., Anishkin A., Sukharev S., “Adaptive MscS gating in the osmotic permeability response in E. coli: the question of time,” Biochemistry 50(19), 4087–4096 (2011). 10.1021/bi1019435 [DOI] [PMC free article] [PubMed] [Google Scholar]
- 2.Sun X., Chen L., Luo H., Mao J., Zhu L., Nie S., Wang L., “Volume-activated chloride currents in fetal human nasopharyngeal epithelial cells,” J. Membr. Biol. 245(2), 107–115 (2012). 10.1007/s00232-012-9419-5 [DOI] [PubMed] [Google Scholar]
- 3.Koltsova S. V., Akimova O. A., Kotelevtsev S. V., Grygorczyk R., Orlov S. N., “Hyperosmotic and isosmotic shrinkage differentially affect protein phosphorylation and ion transport,” Can. J. Physiol. Pharmacol. 90(2), 209–217 (2012). 10.1139/y11-119 [DOI] [PubMed] [Google Scholar]
- 4.Wood J. M., Bremer E., Csonka L. N., Kraemer R., Poolman B., van der Heide T., Smith L. T., “Osmosensing and osmoregulatory compatible solute accumulation by bacteria,” Comp. Biochem. Physiol. A Mol. Integr. Physiol. 130(3), 437–460 (2001). 10.1016/S1095-6433(01)00442-1 [DOI] [PubMed] [Google Scholar]
- 5.Bernardi P., “Mitochondrial transport of cations: channels, exchangers, and permeability transition,” Physiol. Rev. 79(4), 1127–1155 (1999). [DOI] [PubMed] [Google Scholar]
- 6.Bernardi P., Scorrano L., Colonna R., Petronilli V., Di Lisa F., “Mitochondria and cell death. Mechanistic aspects and methodological issues,” Eur. J. Biochem. 264(3), 687–701 (1999). 10.1046/j.1432-1327.1999.00725.x [DOI] [PubMed] [Google Scholar]
- 7.B. Alberts, A. Johnson, J. Lewis, M. Raff, K. Roberts, and P. Walter, “Apoptosis” in Molecular Biology of THE CELL V ed., (Garland Science, New York, 2008). [Google Scholar]
- 8.Garlid K. D., Beavis A. D., “Swelling and contraction of the mitochondrial matrix. II. Quantitative application of the light scattering technique to solute transport across the inner membrane,” J. Biol. Chem. 260(25), 13434–13441 (1985). [PubMed] [Google Scholar]
- 9.N. Zamzami, C. Maisse, D. Métivier, and G. Kroemer, “Measurement of Membrane Permeability and Permeability Transition of Mitochondria,” in: L.A. Pon, E.A. Schon (Eds.), Methods in Cell Biol. 65, 147–158 (2001) [DOI] [PubMed] [Google Scholar]
- 10.Ball V., Ramsden J. J., “Buffer Dependence of Refractive Index Increments of Protein Solutions,” Biopolymers 46(7), 489–492 (1998). [DOI] [Google Scholar]
- 11.M. M. Chakrabarty, Chemistry and Technology of Oils and Fats (Allied Publishers, 2009), Chap.11. [Google Scholar]
- 12.Nakayama S., Sakuyama T., Mitaku S., Ohta Y., “Fluorescence imaging of metabolic responses in single mitochondria,” Biochem. Biophys. Res. Commun. 290(1), 23–28 (2002). 10.1006/bbrc.2001.6185 [DOI] [PubMed] [Google Scholar]
- 13.Wibom R., Lundin A., Hultman E., “A sensitive method for measuring ATP-formation in rat muscle mitochondria,” Scand. J. Clin. Lab. Invest. 50(2), 143–152 (1990). 10.3109/00365519009089146 [DOI] [PubMed] [Google Scholar]
- 14.Hattori T., Watanabe K., Uechi Y., Yoshioka H., Ohta Y., “Repetitive transient depolarizations of the inner mitochondrial membrane induced by proton pumping,” Biophys. J. 88(3), 2340–2349 (2005). 10.1529/biophysj.104.041483 [DOI] [PMC free article] [PubMed] [Google Scholar]
- 15.Uechi Y., Yoshioka H., Morikawa D., Ohta Y., “Stability of membrane potential in heart mitochondria: Single mitochondrion imaging,” Biochem. Biophys. Res. Commun. 344(4), 1094–1101 (2006). 10.1016/j.bbrc.2006.03.233 [DOI] [PubMed] [Google Scholar]
- 16.Broekemeier K. M., Dempsey M. E., Pfeiffer D. R., “Cyclosporin A is a potent inhibitor of the inner membrane permeability transition in liver mitochondria,” J. Biol. Chem. 264(14), 7826–7830 (1989). [PubMed] [Google Scholar]
- 17.Hunter D. R., Haworth R. A., “The Ca2+-induced membrane transition in mitochondria. I. The protective mechanisms,” Arch. Biochem. Biophys. 195(2), 453–459 (1979). 10.1016/0003-9861(79)90371-0 [DOI] [PubMed] [Google Scholar]
- 18.Lee G. J., Chae S. J., Jeong J. H., Lee S. R., Ha S. J., Pak Y. K., Kim W., Park H. K., “Characterization of mitochondria isolated from normal and ischemic hearts in rats utilizing atomic force microscopy,” Micron 42(3), 299–304 (2011). 10.1016/j.micron.2010.09.002 [DOI] [PubMed] [Google Scholar]


