Abstract
Sweet basil, Ocimum basilicum., is one of the most important and wildly used spices and has been shown to have antioxidant, antibacterial, and anti-diarrheal activities. In this study, high performance liquid chromatographic (HPLC) and flow-injection mass spectrometric (FIMS) fingerprinting techniques were used to differentiate organic and conventional sweet basil leaf samples. Principal component analysis (PCA) of the fingerprints indicated that both HPLC and FIMS fingerprints could effectively detect the chemical differences in the organic and conventional sweet basil leaf samples. This study suggested that the organic basil sample contained greater concentrations of almost all the major compounds than its conventional counterpart on a per same botanical weight basis. The FIMS method was able to rapidly differentiate the organic and conventional sweet basil leaf samples (1 min analysis time), whereas the HPLC fingerprints provided more information about the chemical composition of the basil samples with a longer analytical time.
Keywords: HPLC fingerprint, Flow injection, Mass spectral fingerprint, Principal component analysis, Sweet Basil (Ocimum basilicum)
1. Introduction
Sweet basil (Ocimum basilicum) is a popular food seasoning ingredient in the United States and Mediterranean diets. Both organic and conventional sweet basils are commercially available and differ significantly in their prices, primarily because of the consumer desire of organic foods (OTA, 2007; OTA, 2011). A recent study from our laboratory investigated the phenolic acid compositions and antioxidant and anti-inflammatory activities of commercial organic and conventional peppermints (Mentha piperita L.) and cinnamons (Cinnamomum verum) (Lv et al., 2012). The organic peppermint contained greater level of insoluble bound and total caffeic acid, and soluble free p-coumaric acid than the conventional counterpart, whereas the conventional peppermints had greater amounts of total and insoluble syringic and ferulic acids (Lv et al., 2012). The organic and conventional cinnamons had no difference in their total phenolic contents or radical scavenging capacities under the same experimental conditions, though the organic cinnamon contained greater amount of insoluble bound catechin and syringic acid, as well as soluble free ferulic acid (Lv et al., 2012). Interestingly, the organic peppermints had stronger DPPH radical scavenging and anti-inflammatory activities than their conventional counterparts, but the conventional cinnamons generally had greater anti-inflammatory properties than the organic ones (Lv et al., 2012). These data indicated the potential difference between organic and conventional peppermints or other edible botanicals in their chemical components and health properties, suggesting that it is critical for improving food consumption and human health to be able to differentiate organic and conventional foods of the same type.
Recently, chromatographic and flow-injection mass spectrometric (FIMS) fingerprints have been successfully used in combination with statistical approaches, such as principal component analysis (PCA), to differentiate organic and conventional botanicals (Gao et al., 2012; Gao et al., 2013). For instance, our recent study successfully differentiated commercial organic and conventional peppermints and sages (Salvia officinalis L.) using high performance liquid chromatography-ultraviolet (HPLC-UV) and FIMS fingerprinting technique (Gao et al., 2012; Gao et al., 2013). The FIMS fingerprinting technique was also successfully used to differentiate the organic and conventional Rio red grapefruits (Citrus paradisi) (Chen & Harnly, 2010). In addition, the diploid and tetraploid Gynostemma pentaphyllum, as well as the different parts from the same Gynostemma pentaphyllum genotype, were differentiated using HPLC fingerprints combined with PCA (Xie, Zhao, Chen, Jing, Yue, & Yu, 2011). However, either HPLC-UV or FIMS fingerprints has not been investigated for their potential in differentiating commercial organic and conventional sweet basils.
In the present study, commercial organic and conventional sweet basil leaves were characterized by principal component analysis of their chromatographic and FIMS spectrometric fingerprints. Ten organic and ten conventional sweet basil leaf samples were used in this study. The results will be used for quality assurance and control for commercial sweet basils.
2. Material and methods
2.1 Standard compounds and other chemicals
Caffeic acid, rutin, chicoric acid, rosmarinic acid, ursolic acid, and MS grade formic acid were purchased from Sigma/Aldrich (St. Louis, MO, USA). Optima grade water and acetonitrile were obtained from Fisher Scientific (Pittsburgh, PA, USA).
2.2 Plant materials and sample preparation
Ten commercially available USDA-certified organic and conventional sweet basil (Ocimum basilicum) leaf samples produced in the United Sates were gifts from Frontier Natural Products Co-op (Norway, IA, USA). The sweet basil leaf samples were ground to 20 mesh particle size, and stored at -20 °C until analysis. One hundred mg of each basil powder were weighed and extracted with 10 ml H2O-MeOH (1:1, v/v) by sonication at ambient temperature for 30 min. The extracts were filtered through a 0.45 µm Nylon syringe filter (Alltech Associates, Deerfield, IL, USA). Each extract was analyzed in triplicate.
2.3 HPLC and FIMS conditions
Both HPLC-UV and FIMS analyses were performed according to a previously reported laboratory procedure (Gao et al., 2012). Briefly, a LC/MS system consisted of an Agilent 1100 HPLC system with a binary pump, a diode array detector (DAD), a vacuum degasser, a column oven, and an autosampler (Agilent Technologies, Palo Alto, CA, USA) in combination with a LCQ Deca ion-trap mass spectrometer (Thermo Fisher Scientific Inc., Waltham, MA, USA) was used for both HPLC chromatographic and FIMS fingerprints.
The HPLC conditions were as follows: a symmetry C18 column (2.1 mm i.d. × 150 mm, 3.5 μm) (Waters, Milford, MA, USA) was used with a column temperature set to 40 °C. Mobile phase A consisted of 0.1% formic acid in H2O and mobile phase B consisted of 0.1% formic acid in acetonitrile. The initial percent of B was 20%; this was changed linearly to 40% B in 10 min, increased linearly to 50% B in 20 min, to 75% B in 45 min, and to 95% B linearly at 60 min. The gradient was kept at 95% B for 5 min washing, and returned to initial conditions for 5 min to re-equilibrate the column for the next injection. The flow rate was 0.2 ml/min and injection volume was 10 μl. The DAD wavelength was set to 290 nm since the highest absorbance for the reference peak was observed at this wavelength. The MS in full scan mode (mass range 150 -700) was also used to assist peak identification.
The conditions for FIMS were as follows: a guard column (Adsorbosphere All-Guard Cartridge, C18, 5 μm, 4.6 × 7.5 mm, Alltech Associates, Inc., Deerfield, IL, USA) was used to minimise potential contamination to the MS system. The mobile phase used was 0.1% formic acid in H2O and 0.1% formic acid in acetonitrile 60:40 (v/v), at a flow rate of 0.5 ml/min (isocratic elution). Sheath gas flow rate 80 arb; aux gas flow rate 10 arb; spray voltage, 3.5 kV; heated capillary temperature, 250 °C; capillary voltage, -4.0 V; and tube lens offset, 20 V. Basil extractions were diluted 10 times with water and the injection volume was 2 μl. MS Spectra were collected from 0.2 to 1.2 min and the mass range was from 150 to 700 m/z. Electrospray ionization (ESI) in negative ion mode was used. Triplicate analyses of the 20 basil leaf samples provided 60 MS spectra.
2.4 Data Processing
Twelve peaks from the chromatographic fingerprints were selected as the characteristic peaks. Peak 1, the largest peak in both the organic and conventional basil samples, was selected as the reference peak (RP). Both absolute peak areas of the 12 peaks and the relative ratios of the other 11 peaks to the RP were used for principal component analysis (PCA). For absolute peak area analyses, a matrix of 12 × 60 (the 12 peak areas of the 60 chromatographs, 20 samples with triplicate analyses each) were analyzed with PCA. For relative ratios analyses, and a matrix of 11 by 60 (the areas of the other 11 peaks divided by RP areas in each chromatograph) were used.
The FIMS fingerprint data (m/z 150-700 vs ion intensities) were imported into Excel (Microsoft, Inc., Belleview, WA, USA) for data pre-processing: deleting information not relevant to PCA, combining all the 60 spectra, sorting the data by sample names, and filling the mass matrix with zero for each missing m/z in the mass list so that the data points of each mass spectrum were aligned at 551. The resulting two-dimensional matrix (60 × 551, 60 samples and 551 masses) was used for PCA. The PCA was performed using SIMCA-P 11.5 (Umetrics, Sweden) with the parameter set to “PAR”. Differences between means were determined by analysis of variance (ANOVA) with Tukey's HSD post hoc test (P<0.05), using SPSS (SPSS for Windows, Version Rel. 10.0.5., 1999, SPSS Inc., Chicago, IL, USA).
3. Results and discussion
3.1 Chromatographic and FIMS fingerprints
Typical chromatographic fingerprints for organic and conventional sweet basil leaf samples are shown in Fig. 1. A total of 12 major peaks were detected. Peak No. 1 was the largest peak in both the organic and conventional sweet basil groups and was selected as the reference peak (RP) for calculating the relative peak ratios of other peaks. Other major peaks were defined as at least 5% of the area of RP. Nine peaks were identified using MS data and commercial reference standards and literature reports (Table 1). In addition, the average total area under the 12 peaks was 2168.90 for organic sweet basil samples, which was two times more than that of 1181.33 for their conventional counterparts, on a per same botanical weight equivalent basis. These data suggested that organic basil samples might have greater amounts of the twelve major components.
Fig. 1.
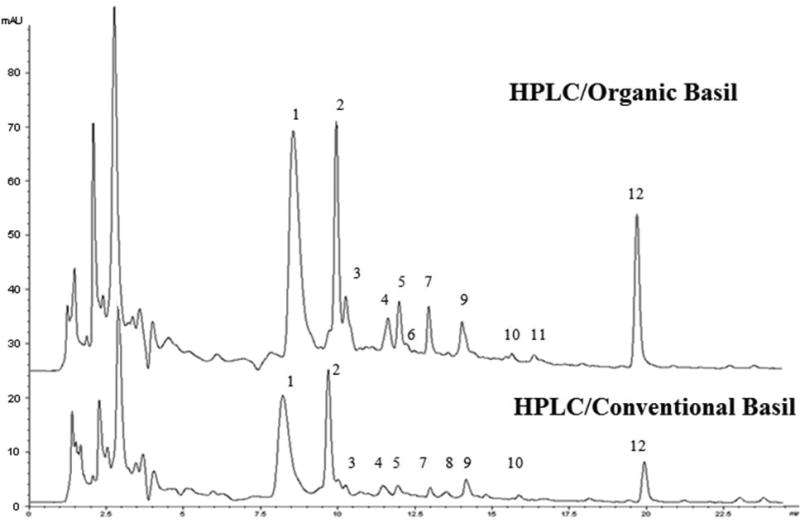
High performance liquid chromatographic (HPLC) fingerprints of organic and conventional sweet basil leaf samples. Peaks 1, 2, 3, 4, 5, 6, 7, 10 and 12 were luteolin 5-O-glucoside, caffeic acid derivative, caffeic acid, rutin, chicoric acid, kaempferol 3-O- maonylglucoside, luteolin acetyl-glucuronide, rosmarinic acid, and ursolic acid, respectively. The peaks before 3 min were recognized as solvent or ghost peaks.
Table 1. Mass spectrometry (MS) fragmentation of the basil components by high performance liquid chromatography (HPLC)-MS.
| Peak number | RTa | [M-H]- | Compound | Reference |
|---|---|---|---|---|
| 1 | 8.17 | 447 | luteolin 5-O-glucoside | Literature Data (Grayer et al., 2002) |
| 2 | 10.4 | 395 | caffeic acid derivative | Literature Data (Jaiswal & Kuhnert, 2011; Jayasinghe, Gotoh, Aoki, & Wada, 2003) |
| 3 | 10.7 | 179 | caffeic acid | Commercial Standard |
| 4 | 11.3 | 609 | rutin | Commercial Standard |
| 5 | 12.1 | 473 | chicoric acid | Commercial Standard |
| 6 | 12.4 | 537 | kaemperol 3-O-maonylglucoside | Literature Data (Grayer et al., 2002) |
| 7 | 13.4 | 503 | luteolin acetyl-glucuronide | Literature Data (Jayasinghe, Gotoh, Aoki, & Wada, 2003) |
| 8 | 14.0 | 548 | unknown | / |
| 9 | 14.5 | 411 | unknown | / |
| 10 | 16.1 | 359 | rosmarinic acid | Commercial Standard |
| 11 | 16.8 | 307 | unknown | / |
| 12 | 20.2 | 456 | ursolic acid | Commercial Standard |
RT stands for retention time (unit: minutes).
Typical FIMS fingerprints for the organic and conventional basils are shown in Fig. 2. The average of total ion counts of FIMS spectra for organic sweet basil leaf sample was 2.45 × 10⁷, over 2 times greater than that of 1.07 × 10⁷ for their conventional counterparts, on a per same botanical weight equivalent basis. This agreed to the results from the HPLC analysis.
Fig. 2.
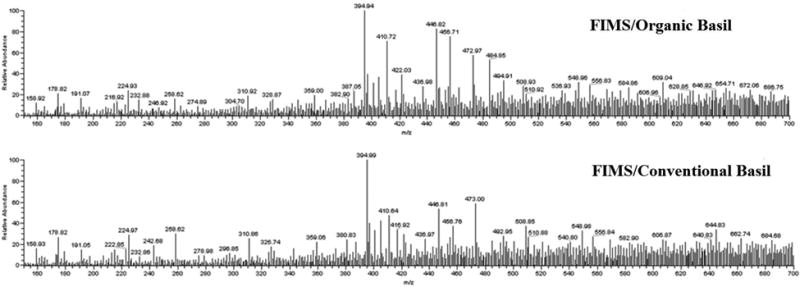
Flow-injection mass spectrometric (FIMS) fingerprints of organic and conventional sweet basil leaf samples.
3.2 PCA of chromatographic fingerprints
PCA uses a mathematical procedure to transform a number of correlated variables into a smaller group of uncorrelated variables, the principle components, to make it easy to visually compare significant differences and avoids subjective decisions. PCA has been commonly used for summarizing chromatographic fingerprint data and may reveal more relationships of the data in a better way showing the variance of the data (Chen et al, 2008).
The PCA scores plot and loading plot of the chromatographic absolute peak areas are shown in Fig. 3A and 3B, respectively. In these two figures, the absolute areas of the 12 peaks were used for PCA. The organic basil samples were located on the right side in the positive PC 1 area, and were separated from their conventional counterparts located on the left side in the negative PC1 area.
Fig. 3.
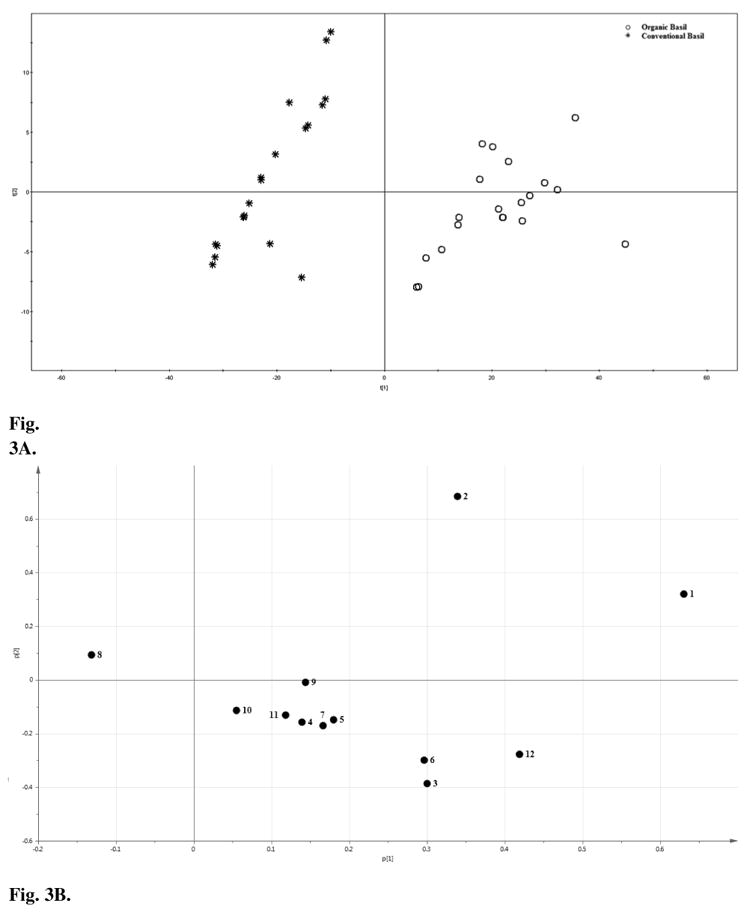
Principal component analysis (PCA) A) scores plot, and B) loading plot for absolute peak areas in HPLC fingerprints of organic and conventional sweet basil leaf samples.
The loading plot of PCA for HPLC absolute peak areas indicated that peaks 1 (luteolin 5-O-glucoside), 2 (caffeic acid derivative), 6 (kaemperol 3-O-maonylglucoside) and 12 (ursolic acid) contributed positively to PC 1. The concentrations of these components were significantly greater in the organic basil samples than their conventional counterparts (P < 0.05) (Fig. 3A and 3B). Peak 8 contributed negatively to PC 1, and its level was significantly greater in the conventional basil samples than that in the organic basils. Combined with the result of Fig. 1, the PCA results indicated that peak 1, 2, 6, 8 and 12 contributed most in separating organic basils from the conventional ones.
Fig. 4A and 4B showed the PCA scores plot and loading plot of the relative peak areas of the organic and conventional basils. In Fig. 4A, organic basils (on the right side, the positive PC 1 area) were well separated from the conventional basils (on the left side, the negative PC1 area). The two groups of samples in the PCA score plots clustered more tightly compared to the PCA of the absolute peak areas. This indicated that the relative peak ratio approach was more effective in differentiating the basil samples in comparison to the score plots of the HPLC absolute peak areas.
Fig. 4.
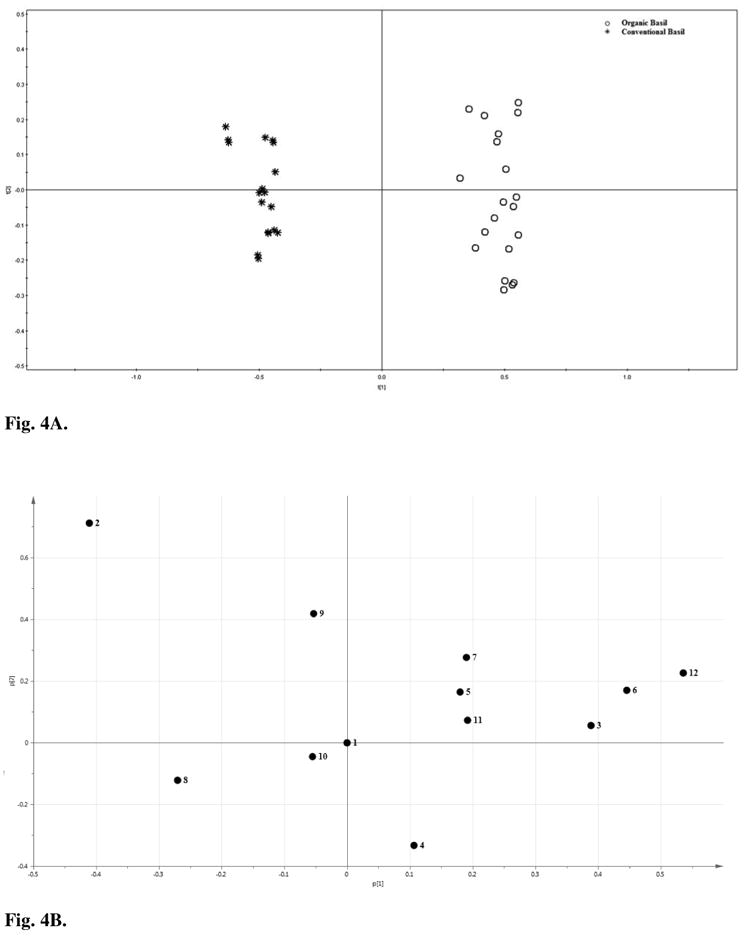
Principal component analysis (PCA) A) scores plot and B) loading plot for relative peak areas in HPLC fingerprints of organic and conventional sweet basil leaf samples. All peak areas were divided by the area of the peak 1 in the same spectrum, and the resulted relative peak areas were used for PCA.
Since peak 1 was selected as the RP, its loading plot was found at 0 position on both x and y axes (Fig. 4B). Peaks 2 (caffeic acid derivative) and 8 at the left corner yielded a significant negative PC1 loading and would lead to positions to the left side of the PCA scores plot. Interestingly, although the absolute peak areas of both peaks 1 and 2 were greater in the organic basils, the ratio of peaks 2 to 1 was significantly greater in the conventional basils than that in the organic basils (P < 0.05), and caused a negative contribution to PC1. Peaks 3 (caffeic acid), 6 (kaemperol 3-O-maonylglucoside) and 12 (ursolic acid) contributed positively to PC 1, and the levels of these components were also significantly greater in the organic basil samples than in their conventional counterparts (P < 0.05) (Fig. 4A and 4B). All of these peaks contributed significantly to the differences in all basil samples in the loading plot and they were the most important peaks to decide if a basil sample was organically or conventionally produced using HPLC chromatographic fingerprinting technique.
3.3 PCA of FIMS fingerprints
The PCA scores plot and loading plot for FIMS finger prints are shown in Fig. 5A and 5B, respectively. There was an excellent separation between organic (positive PC 1 area) and conventional (negative PC 1 area) groups by the PC1 (Fig. 5A).
Fig. 5.
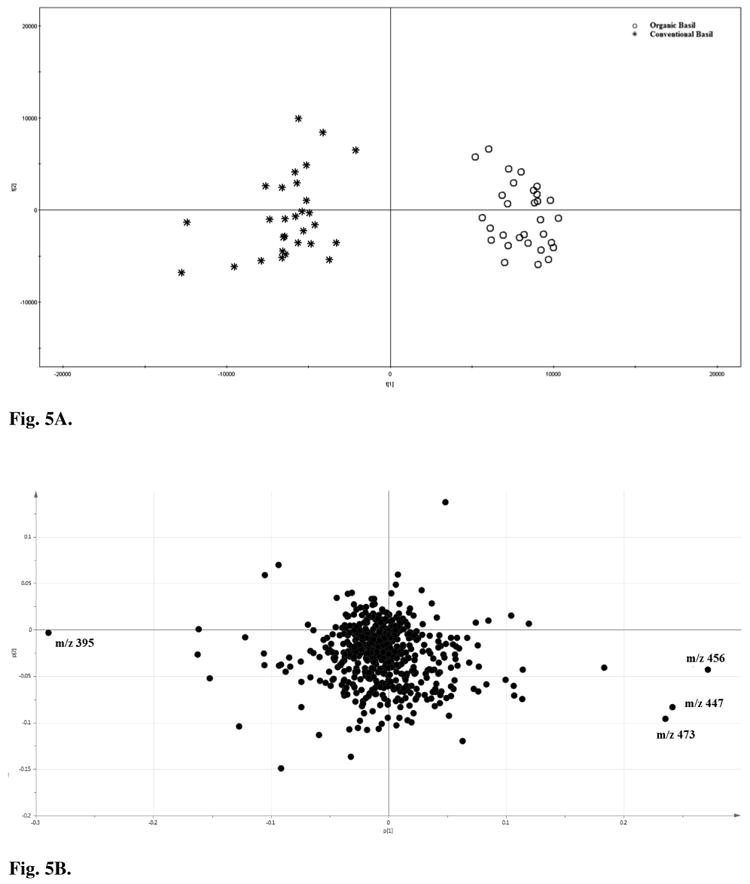
Principal component analysis (PCA) A) scores plot and B) loading plot for flow-injection mass spectrometric (FIMS) fingerprints of organic and conventional sweet basil leaf samples.
In the loading plot of FIMS fingerprints, the ion m/z 395 (peak 2, caffeic acid derivative) contributed negatively to PC1 (Fig. 5B). This indicated that m/z 395 (peak 2) was relatively more prominent in the conventional basils (negative PC 1 area) than in the organic basils, agreeing to the result of PCA for the HPLC relative peak ratio of peaks 2 to 1. In addition, ions m/z 456 (peak 12, ursolic acid), m/z 447 (peak 1, luteolin 5-O-glucoside), and m/z 473 (peak 5, chicoric acid) contributed positively to PC 1. Combined with the result of Fig. 2, m/z 395 (peak 2, caffeic acid derivative) was the greatest natural abundance peak and followed by m/z 447 (peak 1, luteolin 5-O-glucoside), 456 (peak 12, ursolic acid), and 473 (peak 5, chicoric acid) in the spectrum of organic basil samples. The m/z 395 was also the greatest natural abundance peak in the spectrum of conventional basil, followed by m/z 473, 447 and 456. The loadings of these ions indicated that these ions contributed most in the differentiation of organic and conventional basil samples.
The results from this study indicate that organic and conventional sweet basil leaf samples may have significantly different chemical profiles. Overall, luteolin 5-O-glucoside, caffeic acid derivative, chicoric acid, kaemperol 3-O-maonylglucoside and ursolic acid contributed most significantly in differentiating organic and conventional basil samples by PCAs of both chromatographic and FIMS spectrometric fingerprints. A previous study showed that isolated caffeic acid derivatives exhibited antioxidant properties (Dalby-Brown, Barsett, Landbo, Meyer, & Molgaard, 2005). Chicoric acid has been reported to enhance insulin secretion and glucose uptake (Tousch et al, 2008). In addition, ursolic acid exhibited anti-inflammation and anti-cancer activities by targeting signal pathways, especially in the prevention of breast cancer (Venugopal & Liu, 2012). The demonstration that organic basils contain greater amounts of these health compounds may be important in evaluating and comparing organic and conventional foods.
4. Conclusion
HPLC and FIMS fingerprints combined with PCA were able to clearly demonstrate the chemical profile differences between the organic and conventional sweet basil leaf samples, and effectively differentiated these basil samples. The FIMS fingerprinting technique provided a rapid test and could be used for possible high-throughput applications. On the other hand, HPLC fingerprinting technique provided more detailed information about sample chemical compositions, but might require longer analysis time and take longer time to be developed. It needs to be pointed out that the botanicals were obtained from a single company and may not fully represent the basil samples on the market. Other factors, such as growing location, post-harvest treatment and storage conditions, may also contribute to the sample difference and make the differentiation more challenging.
Research Highlights.
Differentiating the organic and conventional basils by HPLC and FIMS fingerprints
The organic basils contained greater major compounds than their conventional counterparts
The FIMS method provided a rapid test to differentiate the organic and conventional basils
Acknowledgments
This research was partially supported by SJTU 985-III disciplines platform and talent fund (Grant No. TS0414115001; TS0320215001), a special fund for Agro-scientific Research in the Public Interest (Grant No. 201203069), as well as by the Agricultural Research Service of the U.S. Department of Agriculture and an Interagency Agreement with the Office of Dietary Supplements of the National Institutes of Health (Grant NO. Y01 OD001298-01).
Footnotes
Publisher's Disclaimer: This is a PDF file of an unedited manuscript that has been accepted for publication. As a service to our customers we are providing this early version of the manuscript. The manuscript will undergo copyediting, typesetting, and review of the resulting proof before it is published in its final citable form. Please note that during the production process errors may be discovered which could affect the content, and all legal disclaimers that apply to the journal pertain.
Contributor Information
Pei Chen, Email: Pei.Chen@ars.usda.gov.
Liangli (Lucy) Yu, Email: lyu5@umd.edu.
References
- Chen P, Harnly JM. Flow injection mass spectral fingerprints demonstrate chemical differents in rio red grapefruit with respect to year, harvest time, and conventioanl versus organic farming. Journal of Agricutural and Food Chemistry. 2010;58:4545–4553. doi: 10.1021/jf904324c. [DOI] [PMC free article] [PubMed] [Google Scholar]
- Chen Y, Zhu SB, Xie MY, Nie SP, Liu W, Li C, et al. Quality control and original discrimination of Ganoderma lucidum based on high-performance liquid chromatographic fingerprints and conbined chemometrics methods. Analytica Chimica Acta. 2008;623:146–156. doi: 10.1016/j.aca.2008.06.018. [DOI] [PubMed] [Google Scholar]
- Dalby-Brown L, Barsett H, Landbo AR, Meyer AS, Molgaard P. Synergistic antioxidative effects of alkamides, caffeic acid derivatives, and polysaccharide fractions from Echinacea purpurea on in vitro oxidation of human low-density lipoproteins. Journal of Agricultural and Food Chemistry. 2005;53:9413–9423. doi: 10.1021/jf0502395. [DOI] [PubMed] [Google Scholar]
- Gao B, Lu Y, Qin F, Chen P, Shi H, Charles D, et al. Differentiating organic from conventional peppermints using chromatographic and flow injection mass spectrometric (FIMS) fingerprints. Journal of Agricultural and Food Chemistry. 2012;60:11987–11994. doi: 10.1021/jf303415d. [DOI] [PMC free article] [PubMed] [Google Scholar]
- Gao B, Lu Y, Sheng Y, Chen P, Yu L. Differentiating organic and conventional sage by chromatographic and mass spectrometry flow-injection fingerprints combined with principal component analysis. Journal of Agricultural and Food Chemistry. 2013;61:2957–2963. doi: 10.1021/jf304994z. [DOI] [PMC free article] [PubMed] [Google Scholar]
- Grayer RJ, Kite GC, Veitch NC, Eckert MR, Marin PD, Senanayake P, et al. Leaf flavonoid glycosides as chemosystematic characters in Ocimum. Biochemical Systematics and Ecology. 2002;30:327–342. [Google Scholar]
- Jaiswal R, Kuhnert N. Identification and characterization of two new derivatives of chlorogenic acids in Arnica (Arnica montana L.) flowers by high-performance liquid chromatography/tandem mass spectrometry. Journal of Agricutural and Food Chemistry. 2011;59:4033–4039. doi: 10.1021/jf103545k. [DOI] [PubMed] [Google Scholar]
- Jayasinghe C, Gotoh N, Aoki T, Wada S. Phenolics composition and antioxidant activity of sweet basil (Ocimum basilicum L.) Journal of Agricutural and Food Chemistry. 2003;51:4442–4449. doi: 10.1021/jf034269o. [DOI] [PubMed] [Google Scholar]
- Lv J, Huang H, Yu L, Whent M, Niu Y, Shi H, et al. Phenolic composition and nutraceutical properties of organic and conventional cinnamon and peppermint. Food Chemistry. 2012;132:1442–1450. doi: 10.1016/j.foodchem.2011.11.135. [DOI] [PubMed] [Google Scholar]
- Tousch D, Lajoix A, Hosy E, Azay-Milhau J, Ferrare K, Jahannault C, et al. Chicoric acid, a new compound able to enhance insulin release and glucose uptake. Biochemical and Biophysical Research Communications. 2008;377:131–135. doi: 10.1016/j.bbrc.2008.09.088. [DOI] [PubMed] [Google Scholar]
- Venugopal R, Liu R. Phytochemicals in diets for breast cancer prevention: The importance of resveratrol and ursolic acid. Food Science and Human Wellness. 2012;1:1–13. [Google Scholar]
- Xie Z, Zhao Y, Chen P, Jing P, Yue J, Yu L. Chromatographic fingerprint analysis and rutin and quercetin compositions in the leaf and whole-plant samples of di- and tetraploid Gynostemma pentaphyllum. Journal of Agricutural and Food Chemistry. 2011;59:3042–3049. doi: 10.1021/jf104329v. [DOI] [PubMed] [Google Scholar]
- Organic Trade Association (OTA) [Accessed 15.12.12];2007 Organic Industry Survey. 2007 URL http://www.ota.com/pics/documents/2007ExecutiveSummary.pdf.
- Organic Trade Association (OTA) [Accessed 17.12.12];2011 Organic Industry Survey. 2011 URL http://www.ota.com/pics/documents/2011OrganicIndustrySurvey.pdf.


