Abstract
Periodic collection of field data, analysis and interpretation of data are key to a good healthcare service. This data is used by the subsequent decision makers to recognize preventive measures, provide timely support to the affected and to help measure the effects of their interventions. While the resources required for good disease surveillance and proactive healthcare are available more readily in developed countries, the lack of these in developing countries may compromise the quality of service provided. This combined with the critical nature of some diseases makes this an essential issue to be addressed. Taking advantage of the rapid growth of cell phone usage and related infrastructure in developed as well as developing countries, several systems have been established to address the gaps in data collection. Android, being an open sourced platform, has gained considerable popularity in this aspect. Open data kit is one such tool developed to aid in data collection. The aim of this paper is to present a prototype framework built using few such existing tools and technologies to address data collection for seasonal influenza, commonly referred to as the flu.
Keywords: Android, Open data kit, Influenza, Data collection and surveillance
Introduction
Public healthcare services rely on accurate and efficient surveillance of public’s health for providing proactive and timely measures to prevent and control a disease. This information is not only used to target interventions and start investigations of a disease, but also for alerting the public on possible outbreaks and guide them through essential preventive measures. The bi-directional communication allows for higher chances to control a disease [1].
The means of data collection and analysis have undergone several changes in the last few years. Paper based modes of information gathering are slowly being replaced with the use of emerging technologies for better, faster and more error-free processes. Health care business analytics are also growing towards the use of cloud computing due to the lower financial risks involved and the flexibility which it offers. Using traditional means such as paper forms or personal digital assistants for information gathering is not only time consuming but also adds an additional cost to the organization collecting the data. The widespread nature of these tasks makes them economically taxing as well. The distribution, maintenance, ease of use etc. are other factors which need to be handled.
Many health departments recognize the need for adapting the emerging technology for improving notifiable condition reporting (also known as case reporting – case reporting from healthcare providers to public health agencies) and public health alerting. In recent years, the Center for disease control and prevention (CDC) in collaboration with the Council for state and territorial epidemiologists (CSTE) have proposed a model for the exchange, sharing and retrieval of notifiable condition reporting from an electronic health record [1]. This suggests that electronic notifiable condition reporting may soon be feasible at larger scales.
The use of mobile phones for data collection has also seen a considerable growth. Adapting the mobile data collection to work with standard used in health care domain for data reporting could very well be a futuristic way of case reporting.
Mobile phones, including smartphones, are becoming very popular in most parts of the world. Quoting an IHS iSuppli Wireless Communications Market Tracker Report from information and analytics provider IHS (NYSE: IHS), ‘The Smartphone shipments in 2013 are forecast to account for 54 percent of the total cellphone market, up from 46 percent in 2012 and 35 percent in 2011 [2]. By 2016, smartphones are expected to represent 67.4 percent of the total cellphone market’, as shown in the fig 1 below.
Figure 1.
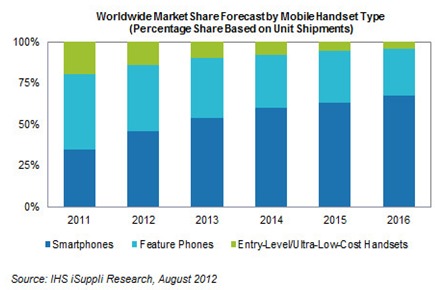
Smartphone market share forecast by iSuppli [2]
With the rapid growth in the mobile industry, the capability of phones has also tremendously increased. Mobile phones now have built in features to capture media, GPS, share information seamlessly and have enhanced display. Technologies such as Bluetooth, SMS, Wi-Fi and web are well integrated together. There has also been significant increase in the data holding capacity in these devices and their processing powers. Another significant advantage is that competition and the huge market for smart mobiles has rendered these devices more affordable than laptops, computers and tablets.
Android, being an open source project has inspired various developers to use the API for designing need based applications. In the field of data surveillance and analysis, various applications such as Pendragon forms [3], Open data kit (ODK) [4], Epicollect [5], eCAALYX [6] have been talked about and explored. Open data kit in particular has exposed a few open source generic tools which can be used either individually or together [7]. This is mentioned more in detail in the framework section. The advantage of open data kit is that the tools are open source and are based on open standard interfaces, which allows us to leverage them for our needs.
In this report we talk about REACap. REACap is a part of a framework designed to use the computational capability of smart phones for the process of information collection, modeling and analysis for infectious diseases. Providing means for easier form design, form retrieval and storage, analysis and modeling, all using the capability and features of smartphones is demonstrated. In this report we focus on REACap – the surveillance application.
In order to build a prototype application showing the advantages of this framework we chose Influenza or seasonal flu as the disease to demonstrate the application. Influenza, also known as flu is a contagious respiratory illness spread through the air. The severity of the disease usually varies with one season to the other depending on the type of flu virus, availability of the vaccines and how well the flu vaccine is matched to the virus. It is often confused with common cold due to the similarity between their symptoms. The disease affects thousands of individuals every year. In Arizona USA alone, where the project was developed, the number of lab reported cases of influenza for the 2012-2013 season was 10304 [8].
The first section in this report covers the framework technologies used in the development of this project. The second section is the application description. It talks about the design of the application and the various processes followed in its implementation. The third section talks about the advantages and disadvantages seen in this approach. Section 4 presents the summary and conclusion.
Framework technologies
This section describes the core technologies used in the development of REACap. REACap as mentioned before is the data collection interface for a framework comprising of surveillance, analysis, forecast and collaboration, developed for monitoring and analysis of seasonal Influenza. The technologies describe here provide the foundations on which REACap was built. They are described in detail below.
XML is an established standard that has been around for several years, and has reached a level of maturity that greatly enhances software applications compatibility. If fact, the power of XML is that it can enhance interoperability among disparate software applications even without XML being an end goal to any of them; it can work as a middle ground [9]. Without XML, any application can still communicate with another application by writing a special “transformation code” that reads the output format of the source application, and generate the equivalent input format of the “destination” application. For bi-directional communication, another set of transformation code will be needed to support the reverse direction of communication (from destination to source). With a large number of software application standards around, the number of transformation classes needed would be prohibitively large. Assuming that we have N software applications written with different standards, the number of transformation classes needed for bi-directional communication would be 2 *(N (N-1)) as per figure 2 [10].
Figure 2.
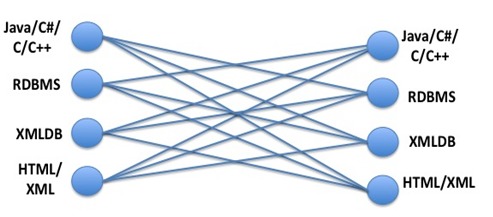
Transformation Code
XML is the only standard format that is used as a middle ground between other software standards (See Figure 3). If any software application is capable of using XML as a communication middle ground (that would still require one transformation code to XML and one from XML back to the application), we can reduce the number of transformation codes to 2N. This can be a significant reduction in complexity looking at the large number of software standards (N) we have today. Furthermore, any new software standard will only need to use XML as a common ground rather than having to write transformation code to all existing standards.
Figure 3.
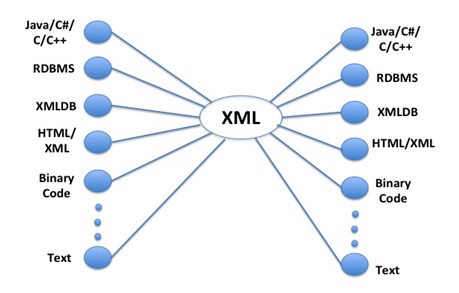
XML as a Common Ground
For this reason, we focus on using XML as a base for our approach. With the widespread versatility in mobile standards, XML will allow us to be compatible with any one of them. On the back end, additional savings exist since the data collected will be written as XML data, which is platform independent.
The XML Space
XML itself is text based, allowing it to be human readable, without the need of any specialized software. We often refer to it as “Document Oriented XML”. However, greater advantages can be attained beyond that. Being fully structured, XML could also be processed by software tools as a “formal document” following well-defined models [11], [12]. Unlike HTML, XML is written using a formal structure using several document descriptions (like the XML Schema, the Data Object Model) to describe a strict document structure needed for software tools. The XML document itself is validated against these rules to ensure that the document can be parsed by software tools to correctly extract the semantics [13]. This allows developers to write several XML-based tools to automatically parse and process an XML document for different needs. Therefore, in the realm of XML, numerous applications have been written to transform XML document in many different ways, making it suitable to compile and run xml-based application in the same way we do any other software.
XML document can work as a base, carring all necessary information and structure. It can then be transformed by parsing it using XSL transformation, and then presented in any of the known formats (Presentation) on the right. Marshalling and unmarshalling allows for structural compatibility between linear (serial) formats (like HTML, PDF, and XML itself), and parallel formats of high-level programming languages (like Java, C/C++).Sub-Heading 1
XFORMS
Xforms is a model view controller based XML format. It was developed by the World Wide Web consortium (W3C) to overcome the limitations of older HTML forms [14]. Traditional HTML web forms do not distinguish between the content and the presentation of a form. Xforms on the other hand, is comprised of two parts, the Xforms Model (describing the form's purpose, logic and initial data) and the Xforms User Interface (describing the forms presentation).
The connection between the Xforms model and the Xforms user interface is called the binding, and it uses a common W3C technology called XPath. XPath uses path expressions to identify nodes in an XML document. In Xforms this is done by using the 'ref' or 'bind' attribute. Fig 4below describes the main components of an Xform.
Figure 4.
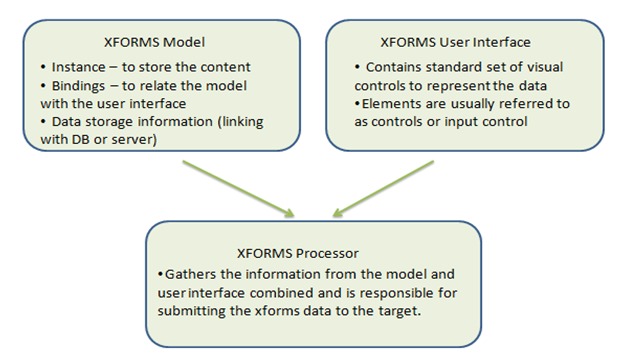
Components of Xform
Xforms allow for flexible presentation options. The Xforms model is capable of working with variety of standard or proprietary user interfaces in order to render the form. The presentation of an Xform can be interpreted differently by different interfaces. For instance, based on the style sheet used by a browser, the interpretation of xforms by a mobile browser and web browser would be different. Controls in a cell phone are easier when described by lists and menus as opposed to traditional pop-up choice boxes. Xforms also allow for form validation and data restraints. A particular field could be defined read only or the restraints in data entered would prevent erroneous inputs. This acts a light validation mechanism before the data is sent to the data manager/database [14].
Xforms have been demonstrated for usage in many different settings. Their use has been explored in web services, xforms processors and even for linking data models to forms in insurance industry. In the healthcare domain, the specification is still underutilized but is starting to be recognized for its advantages [1]. Researchers in Australia used Xforms for developments of decision system support. In Germany, developers implemented an information system to maintain details of prescription drug formulary [1]. OpenMRS is an example of the usage of Xforms in clinical and public health systems.
To read the Xforms and present the form document to the user, Xform clients are used. In this project, the xform client we are using is Javarosa [15]. JavaRosa is a mobile based Xform client. Due to the limited capability of cell phones as compared to desktops/laptops, Javarosa only supports a subset of Xforms. Additional customizations, specific to mobile use, have also been introduced. This will be covered in more detail in the section below.
JAVAROSA
JavaRosa is an Xforms client developed for mobile phones. It is written in J2ME. It was developed as a product of the OpenRosa consortium. It is basically a mobile application platform which can be tailored by developers to suit their needs. It contains an Xform engine at its core. The Xform engine is responsible for reading the form elements, use the binding specified in Xform to interpret the elements and present the element to the user [15]. The logic behind the nature of the element and how it is presented to the user is determined by the Xform engine.
Mobile devices differ greatly from conventional desktops in their computational power and their user interface. They are limited in power and have enhanced UI. This prompted the adaptation of JavaRosa to tailor their Xform support to the mobile market. They support only a subset of Xform specification and in some cases support a feature only in a particular way. JavaRosa has also introduced some additional form features which enhances the Xform experience on mobiles. This includes additional features as well as redefining preexisting Xform features.
One of the core components on which REACap was built, Open Data Kit Collect, utilizes Javarosa for form Logic and form processing. Designing a form for REACap requires a good understanding of the underlying Javarosa specifications.
Forms can be developed by writing raw XML or by using a form designer such as ODK Build [7], PurcForms [11], XLS2XForm [16]. In the current implementation of REACap, forms were developed using XLS2XFORM. These will be talked about in more detail below
Open data kit (ODK)
Open data kit is an open source suite of tools which was designed to help users build information services for developing nations. ODK started as a google.org sponsored sabbatical project and was continued back at the University of Washington Seattle. It currently supports various tools, most notable of which are ODK build, ODK collect and ODK aggregate. The tools are designed to be used independently or together. Being built on existing open standards, they enable users to build services to collect and distribute information in places where user limitations or limitations on infrastructure has long posed problems [4].
For the design of REACap, we evaluated the a few of the ODK tools for compatibility. ODK build [4] is a drag and drop web based form designer. Even though ODK build is a developing application, It was best suited for designing simple forms. In order to allow flexibility in our Influenza survey form, we decided to use ODK build only as a starting point in the design of our form and allow for design of more complex forms.
ODK collect is an android based mobile client which acts as the interface between the user and the underlying form. Collect takes the Xform logic of the form and displays it to the user in a one prompt at a time format. Javarosa provides the form processing and form logic which ODK uses. In disconnected mode, ODK Collect stores the application logic and the form data on the phone in a xml format and as binary files for media. The user can choose to synchronize with a server as required. Files are sent using standard HTTP POST to any Open Rosa compatible server [4].
Since REACap is a prototype application developed to aid in data collection for Influenza, using ODK collect to design the android client seemed appropriate. Simple, ease of navigate, ease of comprehension and thoroughness were some of the characteristics which we were looking at for REACap. ODK collect was a good match. The form processing logic, its display and offline storage were some of the features of ODK collect which was used in REACap. ODK is also supported by an open source community that has contributed training documents, localization support as well as additional tools. These advantages made ODK collect a suitable choice for this project.
EpiCollect
Epicollect is a free, open source, data collection tool developed by researchers in the Imperial college at London and the University of Bath in UK. It allows an mobile user to submit geotagged forms with or without images to central server located within www.spatialepidemiology.net. The server, allows the mapping and visualization (to Google maps or earth) and analysis of the data. The data can also be downloaded or viewed on the phone using Google maps [5]. Fig 5 below captures one of the use cases of epicollect. Data collected by registered users is sent to a central database. Data can then be viewed on Google maps/earth or on phones. Epicollect also allows the user to filter the data as shown in the figure.
Figure 5.
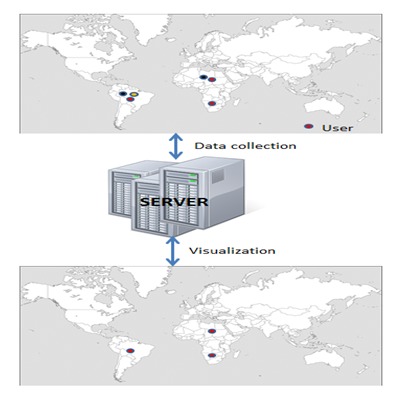
Data collection, collation and visualisation framework using EpiCollect and www.spatialepidemiology.net [5]
Epicollect provides a generic framework for point data collection and analysis, both for Android and iOS. The analysis is sorely done on the server/visualization platform and has to be communicated back to the users. While this application can be widely adapted for simple data collection and viewing, it lacks the engine to process complex forms which was seen in ODK. The form interface presented to the users is made to suit the needs of informed data collection agents. ODK presents a more intuitive form suitable for easier use. These factors led to the preference of ODK over epicollect.
Dropbox
A central server or database as shown in Fig 6, having the ability to store information securely and reliably is of prime importance in a multi-client application. This allows the clients to synchronize information more easily and provide a storage space which is limited in mobiles. Availability of data from all clients in one place also aids in better analysis and decision making. The restriction of access based on privilege is also a good feature to have.
Figure 6.
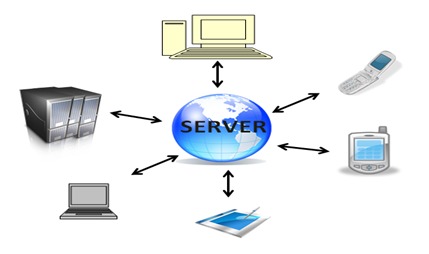
Depiction of a centralized global server for a variety of devices
One of the disadvantages of having a standalone private server is the cost of maintaining the server. This usually plays a huge role in the operational costs. The question of reliability and security also exist. The need to keep with emerging technologies, constant updates, security checks, maintaining synchronization between users are other factors due to which the popularity of cloud computing is on the rise [17]. Cloud computing allows the enabling of convenient access to a shared pool of computing resources, available on demand.
They require minimum management effort or service provider information. In huge organizations, the use of cloud computing leads to much lower financial risks as well. The following Table I illustrates some of the pros and cons of cloud computing.
TABLE I. Pros and cons of cloud computing.
| Pros | Cons |
| Scalabiliy and Cost | Lock-In |
| Encapsulated change management | Reliability |
| Next generation architectures | Lack of control |
| Choice and Agility | Security |
Dropbox is a cloud storage service provided to store and share your data among many applications. It provides inbuilt encryption security and access restrictions. The API allows the user to build the features of Dropbox directly into a mobile application or a desktop application. It is compatible with Windows, Mac, Linux, iPhone, iPad, BlackBerry, and Android devices. The API provides methods to read and write from Dropbox securely, any changes made can be synchronized back to shared devices. Other notable features include simple sharing, search, and restoring files to past revisions [18].
In the scope of this project, Dropbox serves two purposes. It acts as the storage medium for the information collected by users using REACap. All the information is stored in a format which would make the retrieval and analysis of data more efficient. It is also used to store information which is the output of the REAView engine, to enable viewing the data gathered from REACap across multiple users. The synchronization feature of dropbox ensures that with the availability of network, all users will be notified of the availability of new information.
EpiMl
EpiML is a new XML based document interchange protocol which was developed on the AREA project. EpiML is being designed to allow data exchange between AREA apps and mobile devices. EpiML is also the protocol to upload/download data to REAcloud. Data gateways can be developed to translate EpiML data to Health Level 7 (HL7) protocol allowing data interchange with MHS such as the Navy Marine Corps EpiData Center and other health databases. EpiML is the core enabler of the AREA systems to interchange input data, configurations, and output data allowing for full collaborations between AREA users and data/analysis reporting to AREA cloud servers.
Application description
REACap, an information capture and survey application, is a part of overall project named AREA which is aimed to research the use of mobile applications for health surveillance, data analysis and forecasting. Applications for Rapid Epidemiological analysis, also know an AREA, were targeted to study the feasibility of the using mobile devices for this purpose. Mobile devices, smartphones in particular, have gained huge popularity in the last few years. They have become more user programmable, allowing users to mould mobile devices to their taste. They are now capable of capturing media, have inbuilt GPS capabilities, and provide numerous means of sharing information. Communication modes amongst devices include Wi-Fi, Bluetooth, sms, 3G, touch and so on. These make smartphones a sought after choice for use as field instruments.
AREA apps consist of 5 main components. REACap, the focus of this paper, is the surveillance app for collecting field information of the patients. It is built for Android and uses Open data kit's Collect as its base. REACap allows the user to download pre built forms from the server and display them to the user. Users can collect geospatial coordinates, photographs, video, audio, and any number of structured data types as their inputs. The forms can be saved at any stage and on completion, allow the user to submit the form to the server (REACloud).
The other components of AREA include REAView, REAModel, REACould and REAConfig. REACap was developed to work in collaboration with these components. REAView is the platform to view the analysis and forecast done on the information collected. REAModel is the forecast engine available as an application on the smartphone. REAConfig is the mobile and web based configuration tool which allows the user to design forms which will then be used in REACap. The final component of AREA, REACloud, is the cloud based server which acts as the core to all the other applications. EpiMl is the data interchange format designed to talk between all these components.
The output from REACap is in the EpiML format. This data exchange format has the ability to contain all information required for the forms and also the modeling and viewing of the information collected. This information is stored in REACloud. REACloud also contains the forms developed by the users which are sent to REACap on request. As of the current implementation, the other components of AREA use the information collected from REACap through the REACloud. Fig 7 shows the current peripherals of REACap.
Figure 7.

Current peripherals of REACap
The intent of REACap is to enable the collection of information for any canonical disease. A prototype using Influenza (Seasonal flu) was built to demonstrate this. The scope of this project involved studying influenza to determine the information to be collected. This information was then translated into a format which was suitable to be read by REACap. JavaRosa complaint Xforms were used for this purpose. The forms were stored in the server (Dropbox). On request by a REACap user, the forms were downloaded to REACap. The user could then fill the forms offline and send the forms back in EpiML format to the server. The other AREA components use this information for their functions. Fig 8 depicts the process followed. The sections below describe each of the components required for this project in detail.
Figure 8.
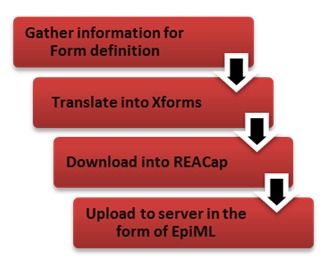
Current peripherals of REACap
Gathering Information for form definition
Influenza was chosen to demonstrate the need for simple data surveillance and analysis in our case. Influenza or seasonal flu is an airborne disease whose most common symptoms consist of chills, fever, sore throat, muscle pains, severe headache, coughing and fatigue [19]. It is often confused with other influenza like diseases such as common cold but Influenza is more severe and is caused by a different kind of virus. The numbers of people affected vary depending on season and the severity depends upon the circulating influenza types and subtypes and existing immunity in the community. The survey below from the Arizona department of health services show the number of influenza cases by season and age group in Arizona alone.

TABLE II. Age Group of Reported Influenza Cases, 2010-2011 through 2012-2013 Seasons [8]
In order to design a form to gather information about influenza, the following parameters were considered.
What are the most common symptoms?
How does the disease spread? What kind of environmental conditional facilitate the survival of the virus?
What makes a person more susceptible for influenza related complications?
What kind of information do we need in order for us to do preventive analysis i.e. analyze the information available and use it for precautionary measures. E.g. The influenza has an average of 2 days incubation period and virus shedding, depending on the age of person, vary from one day before symptoms through 6-11 days after the symptoms for an adult to several days before symptoms for children and can be infectious up to two weeks.
What clinical conditions are available for necessary tests in the vicinity?
Two types of users were considered. First - A health care professional. These people are trained medical professionals well versed with the disease and are capable of making note of additional information which can help provide a better analysis (Fig 9). Information such as the requirement for the patient to seek medical assistance or the clinical tests which would aid the diagnosis can be suggested by them. The second use case is for anyone to use the form for everyday analysis (Fig 10). An example of the two use cases are shown below
Figure 9.
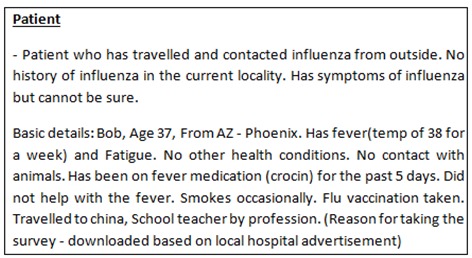
Use case - Individual
Figure 10.
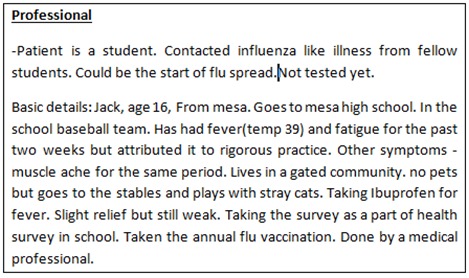
Use case - Health care professional
Table IIIbelow depicts the form contents which were determined based on our analysis. It includes information on how the form is presented to the user as well as information on conditional forwarding. Depending on the type of user and the previous inputs the next set of information to be displayed is determined.
TABLE III.

Influenza form flow logic information
The next section describes the conversion of this information into a suitable format which can be read by REACap.
Defining the Influenza form using Xforms
Xforms as mentioned earlier is a model to represent form data using xml. But the Xforms specification is long and complex. To have an engine running to read and translate Xforms would require a lot of memory and CPU resources. This is usually not available and not sought after when designing mobile applications. Javarosa is the mobile client used in this project for Xforms. It is tailored to run on devices with limited computational capability. It performs the task of rendering the form to the user.
There are numerous tools such as PurcForms designer, ODK build, Vellum, Kobo etc which are available which help create Xforms that work on Javarosa platform. In this project, we have used XLS2Xform to help create our Xform. XLS2Xform is a tool which simplifies the creation of Xforms by letting us design the form with Microsoft excel and then converting this to a Javarosa compatible Xform on their web based tool [16].
The working of XLS2Xform tool is as follows - The excel workbook contains two worksheets - survey and choices. The survey describes the contents and the structure of the Xform. Control structures such as groups or loops are specifies in this sheet as well. The questions which need to be posed to the user, related media, and how it is resented is defined in the survey sheet.
The choices worksheet is used to define the choices for the multiple choice questions. A row represents an entry for a multiple choice. Choices are grouped be ‘list name’ column in Table VII and the corresponding entries in the ‘Name’ column are displayed to the user. This design allows the user to reuse the same set of multiple choice options (specified by list name). The elements (columns) of the worksheets need to be maintained in order for the validity of the Xform. Certain columns are mandatory. In addition, the worksheet contains optional columns which allow the user to specify constraints for each row. For example, type, name and label entries are mandatory columns in the worksheet. But other columns entries such as image, constraint etc need not be specified at all times. The order of these columns is irrelevant. Optional columns could be left out if not required. Blank rows are not processed. Another useful feature is that the xls formatting is ignored while processing the sheet. User could highlight the entries to make it more readable but this would not affect the creation of Xforms.
Some examples from the designing of Influenza form are shown below
Metadata - At the beginning of the form, we collect information in the background. This metadata includes the Start time of the survey, the device id and the day of the survey (Table IV).
TABLE IV. Example of metadata.
| Type | Name | Label |
| Start | Start | |
| Today | Day | |
| Deviceid | ID |
Branching - The user type selected by the mobile user is stored in the <profession> tag as either
patient
professional
Based on the value in the tag, the locality information is displayed. This is done by using the relevant column in the XLS form as shown below. Note the highlighted section. The locality information is grouped and the constraint is applied on the entire group.
Repeating a particular set of questions based on previous answer - At many instances, the need to repeat a particular set of questions arises. If a person has taken many prior tests and we need to record details of all of them, we can use the repeat feature of XLSForm. This is shown in Table V.
TABLE V. Example of branching based on condition.
| Type | Name | Label | Hint | constraint | constraint_message | Relevant |
| begin group | locality_info | Locality Information | ${profession}='professional' | |||
| select one from yes_no | Detected | Has infection been detected? | ||||
| begin group | infection_info | Infection data | ${detected}='yes' | |||
| decimal | Rate | Infection rate | Enter percentage of people infected | |||
| select one from inf_types | Type | Type detected | Choose the influenza type | |||
| select one from infection_type | Infection | Prevelent Infections | ||||
| end group | ||||||
| begin group | env_info | Environment information | ||||
| Text | Food | Food | Enter comments on the food (dietary habits - meat?/vegetarian?, Livestock condition) | |||
| Text | Water | Water | Enter comments on the water in the locality (hygiene, supply source etc) | |||
| end group | ||||||
| end group |
TABLE VI. Example of repetition based on condition.
| type | Name | label | Hint | constraint | constraint_message | Relevant |
| begin group | prior_tests | Prior tests | ${fever}='yes' | |||
| select one from yes_no | test_taken | Any prior influenza tests taken in the last 3-4 days? | ||||
| begin repeat | Test | Test | ${test_taken}='yes' | |||
| begin group | test_details | Test details | ||||
| Text | test_name | Name of the test | ||||
| Text | test_result | Results | ||||
| end group | ||||||
| end repeat | ||||||
| end group |
Image names can be provided in the excel to specify which images to associate with a particular screen. These Images must be stored in the corresponding <form name>-media folder in the forms folder of ReaCap (ODK Collect)
The below table (Table VII) shows images associated with choices in the choices sheet of our excel.
TABLE VII. Association of images with screens.
| list name | Name | label | image |
| user_type | patient | Patient | |
| user_type | professional | Professional | |
| gender | Male | Male | |
| gender | female | Female | |
| fever_opts | Yes | Yes | |
| fever_opts | No | No | |
| fever_opts | Idk | I don’t know | fever.png |
| yes_no | Yes | Yes | |
| yes_no | No | No | |
| cough_yes_no | Yes | Yes | |
| cough_yes_no | No | No | cough.png |
| shiver_yes_no | Yes | Yes | |
| shiver_yes_no | No | No | sweating.png |
Once the form has been created in the excel format, we can convert it to Xforms by uploading it Formhub.com and publishing it. The web based tool lets you download the Xform when done. All the media mentioned in the form needs to be in a folder named <Form name>-media, located at the same level as the Xform. This is necessary for the reading of the form in the current implementation. The next section describes the main features of the REACap application.
REACap
REACap is a data surveillance application designed for Android. As mentioned earlier, REACap is built on top of Open data kit’s Collect application. It uses Javarosa engine to process its form logic and display it to the user.
REACap allows the user to download the forms from a centralized server. The forms are stored in the server along with the form media. Since these forms are to be used in mobile applications, they need to be Javarosa compatible. Availability of network is necessary for downloading of the forms. Once downloaded, the user can fill the form in an offline mode. The following fig 11 displays the capabilities of REACap.
Figure 11.
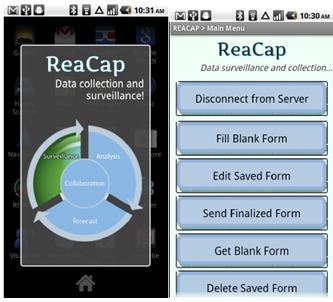
Screen depicting the capabilities of REACap
Connect to server establishes an authorization check for the user. Each healthcare worker will have a separate login. This will allow us to track the locations which have been surveyed and organize surveillance teams better. Health care workers will also have certain privileged access to the server contents. General users will be provided a common logging to gain access to the storage server.
Get blank form will allow the user to download forms from the server once they are authorized to access it (i.e. once they are able to login to the server). The forms are stored as xml documents and their corresponding media need to be stored in a folder with the same name with a '-media' appended to the end. This enables the application to download the corresponding media along with the form.
Fill blank form and Edit saved forms allow the user to fill the downloaded forms and edit forms respectively. User can save the form at completion or in the middle. This will be stored on the device till the user decides to send it to the server. Send finalized form button allows the user to do that. There is a slight difference between saved forms and finalized forms. Finalized forms are indicated by the user while filling the form. They tell the application that the forms are ready to be sent. Saving forms while filling lets the user get back to them when they want but these forms cannot be sent to the server unless the user specifically marks them finalized. Finalized forms can be edited as well. This distinction is necessary to avoid confusion while dealing with multiple forms and avoid flooding the servers with incomplete forms by error.
The last button, delete saved forms, helps clear the devices memory of the unnecessary forms and media.
The javarosa engine and ODK collect displays the prompts to the user in a one prompt at a time format. Users can navigate from one prompt by a simple swipe motion. The form logic determines the sequence of prompts shown and the input variables. The Fig 12 below illustrate a few screens.
Figure 12.
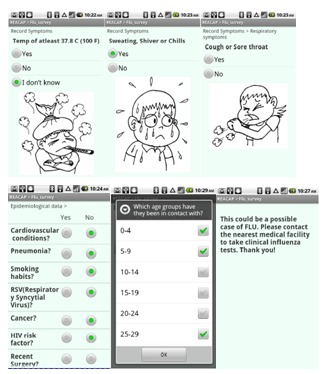
Few screens from the Influenza form on REACap
The form is saved in an XML format on the device. The output of REACap is a simple tag based xml output. A sample output is shown in Fig 13.
Figure 13.
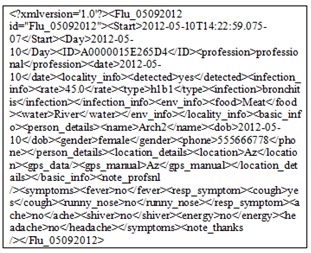
XML output from ODK collect/REACap
As seen in the above figure, the value filled in the prompts are stored within their corresponding name tags. This is enough to enable us to parse the information and analyze it. But in order to enable the reuse of forms, we want to package the form structure as well as the form output. For this purpose, we used EpiMl to convey the information to the server. This is covered in the section below.
Uploading the form to the server
EpiML is the proposed data interchange format between AREA devices. Access to other health, environmental, and geographic information sources by the AREA systems will be accomplished through a centralized data server (REAcloud) for uniform and timely data distribution to AREA equipped mobile devices. More information on EpiMl is out of scope of this report.
Network connection is required to download or send forms to the server. Once uploaded to the server, the information can be analyzed and stored back in the EpiMl format. This information can then be used to view the finished form, analyze the information in the form of charts and graphs, model the information to predict the spread etc.
Analysis
Many factors played a part in the design of this approach. First and foremost was the need for efficient surveillance and analysis in the public health domain. Lack of awareness and adequate medical response has a huge impact on the spread of the illness. This can be controlled to an extent by taking proactive measures such as creating awareness and using analytics to model the illness. With the growing popularity of smartphones, their role in this aspect has seen considerable growth. It has been observed that the use of smartphones as opposed to traditional modes of surveillance and analysis is not only quicker but also less expensive [20,21].
The decision for use of Xforms for data transfer was based on the flexibility and portability that the specification provides. In addition to this, though it is not a defined standard used in healthcare right now, there is an increasing adaptation of Xforms in the industry [1].
The application in itself has two audiences - health care organizations and the general public. While the intent of the application is to enable faster data collection and analysis, it also serves an a awareness tool among the general population. When working with bigger groups, the design of the application allows the ability to track and coordinate information. Information can be shared using EpiMl and REACloud.
The simple layout of the forms ensures that the application is usable by a wider audience. Another advantage is that the network connection is only required while downloading or uploading the forms. Android and Xforms allow metadata collection as well. This eliminates the need for the user to enter information such as device identity, time etc. Taking advantages of Android features, we can use the gps to record the location coordinates instead of manually entering such information. Using Xforms as the format to read the data also gives more freedom to the users. Since XML is used as the mode of storage, the application does not impose memory issues on the device.
At this stage, the form is created using the XLSTool. With the availability of REAConfig, this process will also be simplified. This design in itself imposes certain restrictions as well. Although REACap can be used as a standalone tool, the complete potential can only be realized when used in conjunction with other AREA apps. The use of EpiMl makes it simpler to design the interface targeting epidemiological data and hence makes it more efficient when parsing and analyzing the data. Cloud storage allows the ability to store large quantities of data which can then be used for analysis. Using mobile devices to interact this information, allows updated information to be available faster to the users.
SUMMARY AND CONCLUSIONS
The AREA framework on the whole tries to use the capability of mobile applications to create a framework for efficient data collection and analysis. Existing data collection frameworks tend be of a very generic nature. We want to add to this and create a framework suitable for the surveillance, analysis and modeling of infectious diseases. We have implemented a prototype capable of handling complex form logic, displaying data and provide analysis. We have tried to be generic and at the same time not compromise on the final product.
In this project, we have created the prototype for one of the AREA apps – REACap. REACap as mentioned before is an android based data collection application. It allows the user to gather information based on the form presented and uploads the data to the cloud based server once submitted. In this project, we have depicted the use of REACap for monitoring influenza. As mentioned before, the application has its strengths in its simplicity in the way the data is presented and shown to the user. It caches the information on the device when there is no data connectivity, thereby removing the complete dependency on the network. Another key advantage is the use of Xforms and Javarosa engine for rendering complex form logic.
The computing power of smartphones is constantly increasing. Using this to our advantage, the project is designed to allow to interaction between each of the AREA components. In the absence of data connectivity, partial analysis can still be done using the mobile phone’s processing capability. This can be very advantageous in regions with little or no network. In conclusion we have tried to show that mobile devices can be used to a large extent in the healthcare industry. They are not only already prevalent but have untapped potential which can help make the process faster and more effective.
References
- 1.Hills RA, Baseman JG, Revere D, Boge CL, Oberle WM, et al. 2011. Applying the XForms Standard to Public Health Case Reporting and Alerting. Online J Public Health Inform. 3(2). . 10.5210/ojphi.v3i2.3656 [DOI] [PMC free article] [PubMed] [Google Scholar]
- 2.Lam W, "iSuppli press release - Smartphones See Accelerated Rise to Dominance," August. 2012.
- 3.Pendragon Software Corporation, "Pendragon forms," .
- 4.Hartung C, Lerer A, Anokwa Y, Tseng C, Brunette W, et al. 2010, Open data kit: Tools to build information services for developing regions, Proceedings of the 4th ACM/IEEE International Conference on Information and Communication Technologies and Development, pp. 18. [Google Scholar]
- 5.Aanensen DM, Huntley DM, Feil EJ, Spratt BG. 2009. EpiCollect: linking smartphones to web applications for epidemiology, ecology and community data collection. PLoS ONE. 4, e6968 10.1371/journal.pone.0006968 [DOI] [PMC free article] [PubMed] [Google Scholar]
- 6.Boulos MN, Wheeler S, Tavares C, Jones R. 2011. How smartphones are changing the face of mobile and participatory healthcare: an overview, with example from eCAALYX. Biomed Eng Online. 10, 24 10.1186/1475-925X-10-24 [DOI] [PMC free article] [PubMed] [Google Scholar]
- 7.Anokwa Y, Hartung C, Brunette W, Borriello G, Lerer A. 2009. Open source data collection in the developing world. Computer. 42, 97-99 10.1109/MC.2009.328 [DOI] [Google Scholar]
- 8.Arizona department of health services, Infectious disease epidemiology program influenza & RSV surveillance. http://www.azdhs.gov/phs/oids/epi/flu/
- 9.Gaffar A, Seffah A. An XML multi-Tier Pattern Dissemination System, 2005. Encyclopedia of Database Technologies and Applications. 740-744. Hershey, PA Information Science Reference. 10.4018/978-1-59140-560-3.ch121 [DOI] [Google Scholar]
- 10.Gaffar A, Moha A, Seffah A. 2005, User- Centered Design Practices Management and Communication, Proceedings of HCII 2005, Human Computer Interaction International, Las Vegas, Nevada, USA. [Google Scholar]
- 11.Gaffar A, Sinnig D, Seffah A, Forbrig P. 2004, Modeling patterns for task models. In proceedings of TAMODIA. In 3rd International Workshop on Task Models and DIAgrams for user interface design, pp. 99-104. [Google Scholar]
- 12.Sinnig, D., Gaffar, A., Seffah, A., and Forbrig, P. 2004, Patterns, Tools and Models for Interaction Design. MBUI 103.
- 13.Metzker E, Seffah A, Gaffar A. 2003, Towards a Systematic and Empirical Validation of HCI Knowledge Captured as Patterns. Proceedings of HCI International, the 10th International Conference on Human-Computer Interaction 2003, Crete, Greece, appeared in Julie Jacko and Constantine Stephanidis (Eds.), Human Computer Interaction: Theory and Practice, Lawrence Erlbaum Associates LEA Publishing, 2003, ISBN 0-805-84930-0, vol. 1, pp. 168-172. [Google Scholar]
- 14.World Wide Web Consortium's Xform wiki Available: http://www.w3.org/MarkUp/Forms/wiki/Main_Page
- 15.JavaRosa Wiki Available: https://bitbucket.org/javarosa/javarosa/wiki/Home
- 16.Modi Research Group at Columbia University. Formhub, Available: http://formhub.org/
- 17.Bhattacharya I. Healthcare Data Analytics on the Cloud, 2012, Online Journal of Health and Allied Sciences, vol. 11. [Google Scholar]
- 18.Dropbox, "Rest API," .
- 19.Department of Health and Human Services. Center for disease control and prevention (CDC) Available: http://www.cdc.gov/flu/about/disease/index.htm
- 20.Schmoldt D, Rösch A, Hasenkamp U, Mondorf W, Pollmann H. 2012, Improved surveillance of haemophilia home treatment using mobile phones, in ETELEMED 2012, the Fourth International Conference on eHealth, Telemedicine, and Social Medicine, pp. 143-146. [Google Scholar]
- 21.Bredican J, Mills AJ and Plangger K,, 2013, iMedical: Integrating Smartphones into medical practice design, Journal of Medical Marketing: Device, Diagnostic and Pharmaceutical Marketing, 2013.
- 22.PurcForms. Broswer based Xforms form designer and runtime engine, Available: https://code.google.com/p/purcforms/


