Abstract
Administration of streptozotocin (STZ) and nicotinamide (NA) to adult rats allows for the induction of mild diabetes. However, this experimental model has not been fully characterized. This study was undertaken to determine the metabolic and secretory activity of adipose tissue in rats with STZ-NA-induced diabetes. Experiments were performed using epididymal adipocytes isolated from control and mildly diabetic rats. Lipogenesis, glucose transport as well as glucose and alanine oxidation, lipolysis, anti-lipolysis, cAMP levels and adipokine secretion were compared in cells isolated from the control and diabetic rats. Lipogenesis, glucose transport and oxidation were diminished in the adipocytes of diabetic rats compared with the fat cells of control animals. However, alanine oxidation appeared to be similar in the cells of non-diabetic and diabetic animals. Lipolytic response to low epinephrine concentrations was slightly increased in the adipocytes of diabetic rats; however, at higher concentrations of the hormone, lipolysis was similar in both groups of cells. The epinephrine-induced rise in cAMP levels was higher in the adipocytes of STZ-NA-induced diabetic rats, even in the presence of insulin. Lipolysis stimulated by dibutyryl-cAMP did not significantly differ, whereas anti-lipolytic effects of insulin were mildly decreased in the cells of diabetic rats. Secretion of adiponectin and leptin was substantially diminished in the adipocytes of diabetic rats compared with the cells of control animals. Our studies demonstrated that the balance between lipogenesis and lipolysis in the adipose tissue of rats with mild diabetes induced by STZ and NA is slightly shifted towards reduced lipid accumulation. Simultaneously, adiponectin and leptin secretion is significantly impaired.
Keywords: adipocytes, diabetes, nicotinamide, rat, streptozotocin
Diabetes is a serious metabolic disease affecting about 5% of people all over the world. Diabetes is divided into different types. Among them, type 1 diabetes, accounting for 5–10% of all diabetic cases, usually results from an autoimmune destruction of pancreatic B cells, leading to frank hyperglycaemia, and patients with type 1 diabetes are dependent on exogenous insulin. Type 2 diabetes is more frequent, accounts for 90–95% of diabetic cases and is characterized by defective insulin secretion and action. Insulin resistance, developing in type 2 diabetics, is initially compensated by increased insulin secretion, and blood glucose levels are near normal or moderately increased. However, prolonged overstimulation of B cells leads to B-cell failure (American Diabetes Association 2006). Pathogenesis of type 2 diabetes is complex and involves genetic predisposition and environmental factors, including a lack of physical activity and high-calorie diet (Leahy 2005).
Adipose tissue dysfunction is known to play an important role in the development of type 2 diabetes. Adipocytes store energy in the form of neutral lipids, but excessive lipid accumulation in fat tissue leads to overweight and obesity, which, in turn, impairs insulin action and is associated with increased risks of type 2 diabetes. An important role in the development of type 2 diabetes is ascribed to adipocyte-derived fatty acids. It is well established that chronically increased blood levels of free fatty acids contribute to insulin resistance and worsening of B-cell function (Cusi 2010; Capurso & Capurso 2012).
Adipose tissue is also known to secrete adipokines possessing a broad spectrum of regulatory functions in the whole organism. Some adipokines have beneficial effect in the prevention of diabetes by improving B-cell function and insulin action. However, the others were demonstrated to exert detrimental effects because increased secretion and action of these adipokines contributes to insulin resistance and B-cell failure (Dunmore & Brown 2013). Reciprocal relationships between adipose tissue dysfunction and diabetes are still intensively studied using various animal models.
Masiello et al. (1998) proposed an experimental model in which diabetes is induced in the rat by the administration of streptozotocin (STZ) and nicotinamide (NA). STZ is known to induce pancreatic B-cell damage, whereas NA is given to rats to partially protect insulin-secreting cells against STZ (Szkudelski 2001, 2012; Lenzen 2008). Therefore, STZ-NA-treated rats are characterized by relatively mild diabetes with moderately increased blood glucose and partially reduced B-cell mass. Glucose tolerance in these animals is reduced; however, some compounds increasing insulin secretion and improving B-cell function were demonstrated to ameliorate glucose intolerance. Blood insulin levels in rats with STZ-NA-induced diabetes are usually slightly decreased and the animals do not need to be treated with exogenous insulin. Insulin secretory response of B cells to glucose and some other secretagogues in these rats is only moderately attenuated compared with the animals with diabetes induced by STZ alone (Masiello et al. 1998; Masiello 2006; Szkudelski 2012).
Apart from the defects in pancreatic islets, dysfunctions in many other tissues were described in STZ-NA-induced diabetic rats (Fierabracci et al. 2002; Palsamy & Subramanian 2009; Pari & Sankaranarayanan 2009; Szkudelski 2012). However, very little is known about the metabolism of adipose tissue in animals with this experimental model. Other aspects of adipose tissue functions, such as adipokine secretion, were also not studied. The present study was undertaken to characterize the metabolic and secretory activity of adipocytes in STZ-NA-induced diabetic rats.
Materials and methods
Reagents
D-glucose, L-alanine, L-leucine, epinephrine, dibutyryl-cAMP, bovine serum albumin (BSA, fraction V), collagenase (from Clostridium histolyticum, type II), insulin (from bovine pancreas), phloretin and all reagents used to determine glycerol and blood glucose level and to prepare Krebs–Ringer buffer were from Sigma (St Louis, MO, USA). Hyamine hydroxide and scintillation cocktail (Hi Safe, OptiPhase) were from Perkin Elmer (Boston, MA, USA), 2-deoxy-d-[1-3H]-glucose (specific activity, 296 GBq/mmol) was from GE Healthcare (Buckinghamshire, UK), [U-14C]glucose (specific activity, 9.80 GBq/mmol) was from New England Nuclear Research Products, and l-[U-14C]alanine (specific activity, 132 mCi/mmol) was from Hartmann Analytic (Brunswick, Germany). Insulin, leptin and adiponectin levels were determined radioimmunologically using kits provided by Millipore Co., St. Charles, Missouri (USA). cAMP kit (EIA) was purchased from GE Healthcare UK Limited (Little Chalfont, Buckinghamshire, UK).
The composition of Krebs–Ringer buffer was the following (in mM): 118 NaCl, 4.8 KCl, 1.3 CaCl2, 1.2 KH2PO4, 1.2 MgSO4 and 24.8 NaHCO3.
Ethical approval
The experiments were performed according to the rules and protocols accepted by the Local Ethical Commission for Investigation on Animals.
Animals and induction of diabetes
Male Wistar rats obtained from Brwinow (Poland) were used in all experiments. Animals were maintained in cages in an air-conditioned room at a constant temperature (21 ± 1 °C) with a 12:12-h dark/light cycle, were fed ad libitum a standard laboratory diet Labofeed (Poland) and had free access to tap water.
Diabetes was induced by the administration of 90 mg/kg body weight NA followed by the administration of 60 mg/kg STZ 15 min later. NA and STZ were dissolved in saline and citrate buffer (0.1 mM, pH = 4.5), respectively, and both compounds were given intraperitoneally to overnight fasted rats weighing 160–180 g. Experimental conditions were chosen to induce relatively mild diabetes (Szkudelski et al. 2013). A week later, rats were fasted overnight and were treated intragastrically with 2 g glucose per kg body weight. After 30 min, blood samples were taken from the tail vein and glycaemia was determined using a glucometer (HemoCue Glucose 201+, Ängelholm, Sweden). STZ-NA-treated animals with blood glucose between 12 and 15 mM were used in this study. In the control rats, blood glucose 30 min after glucose load was about 7–8 mM. Four to 6 weeks after the induction of diabetes, non-fasted rats were killed by decapitation and the adipocytes were isolated. Moreover, blood serum samples were taken to determine the glucose (Bergmeyer & Bernt 1974), insulin, adiponectin and leptin levels. The mean blood glucose level in STZ-NA-induced diabetic rats used in the present study was increased by 60% compared with the control animals. Simultaneously, blood insulin level in diabetic animals was reduced by 25% (Table 1).
Table 1.
Blood glucose, insulin, adiponectin and leptin levels in control and streptozotocin–nicotinamide-induced diabetic rats
| Parameters | Control rats | Diabetic rats |
|---|---|---|
| Glucose (mM) | 7.501 ± 0.29 | 12.11 ± 0.89* |
| Insulin (ng/ml) | 4.649 ± 0.25 | 3.486 ± 0.47* |
| Adiponectin (μg/ml) | 3.865 ± 0.25 | 3.018 ± 0.21* |
| Leptin (ng/ml) | 5.540 ± 0.20 | 4.701 ± 0.27* |
Values represent means ± SEM (n = 30);
differences statistically significant between the control and diabetic rats, P < 0.05.
Isolation of adipocytes
Adipocytes were isolated from non-diabetic and diabetic rats according to the Rodbell (1964) method with some modifications (Szkudelska et al. 2000). Rats were slaughtered by decapitation and the epididymal fat tissue was collected. The tissue was rinsed with saline, cut into small pieces and incubated with gentle shaking for 90 min at 37 °C in Krebs–Ringer buffer containing 3% BSA, 3 mM glucose, 10 mM HEPES and 2 mg/ml collagenase. Before use, the buffer was gassed for 20 min with a mixture of O2/CO2 (95%/5%) and its pH was adjusted to 7.4. At the end of incubations, cells were filtered through a nylon mesh, rinsed with the buffer without collagenase and counted under the microscope with a Bürker–Türk counting chamber.
Lipogenesis
To compare lipogenesis in the adipocytes of control and diabetic rats, fat cells isolated from both groups of animals were incubated in Krebs–Ringer buffer containing 3 mM glucose, 0.5 μCi d-[U-14C]glucose, 10 mM HEPES and 3% BSA without insulin (basal lipogenesis) or in the presence of 1, 10 or 50 nM insulin (stimulated lipogenesis). Adipocytes were incubated at 37 °C with gentle shaking for 90 min. After this time, cold Dole's extraction mixture containing isopropanol–heptane–1N H2SO4 (40:10:1) was added to each tube, tubes were shaken, and H2O and heptane were added. Then, the tubes were shaken once again, and the upper phase was transferred into scintillation vials containing scintillation fluid. The radioactivity of total lipids was measured using the β-counter (Szkudelska et al. 2000).
Glucose transport
Freshly isolated adipocytes derived from the control and diabetic rats were preincubated for 10 min in Krebs–Ringer buffer containing 0.5 mM glucose. Then, cells were incubated without insulin or in the presence of 1 or 10 nM insulin. After 20 min, 2-deoxy-d-[1-3H]-glucose was added to each tube and adipocytes were incubated for additional 3 min. The reaction was stopped by the addition of ice-cold Krebs–Ringer buffer with phloretin. Then, silicone oil was added and the tubes were centrifuged. In the next step, adipocytes were transferred into scintillation vials containing scintillation cocktail and the radioactivity was measured using the β-counter. The results were corrected for simple diffusion and non-specific uptake by measuring the glucose uptake by a separate group of cells, which was pretreated with 1.5 mM phloretin before the addition of 2-deoxy-D-[1-3H]-glucose (Szkudelska et al. 2011).
Glucose and alanine oxidation
Adipocytes obtained from the control and diabetic rats were incubated for 90 min in the buffer containing 3 mM glucose and 0.5 μCi d-[U-14C]glucose or 3 mM alanine and 0.25 μCi l-[U-14C]alanine without insulin or in the presence of 1 or 10 nM insulin. Cells were incubated in tubes containing pieces of blotting paper saturated with hyamine hydroxide and capped with rubber membranes. At the end of incubation, 1 N H2SO4 was added to each tube and the capped tubes were kept for incubation for additional 60 min. Then, the blotting papers were transferred into the vials with scintillation fluid, and the radioactivity was measured using the β-counter (Szkudelska et al. 2011).
Lipolysis and cAMP levels
To determine basal lipolysis, fat cells were incubated in Krebs–Ringer buffer containing 3 mM glucose without lipolytic agents. The stimulated lipolysis was determined when adipocytes were exposed to 0.06, 0.125, 0.25, 0.5 or 1 μM epinephrine or to 0.06, 0.125, 0.25, 0.5 or 1 mM dibutyryl-cAMP. Moreover, the inhibitory effects of insulin on epinephrine-induced lipolysis were compared in the adipocytes of control and diabetic rats. For this purpose, the isolated cells were incubated with 0.5 μM epinephrine or 0.5 μM epinephrine with 1 or 10 nM insulin.
In each experiment, adipocytes were incubated at 37 °C with gentle shaking for 90 min. Then, cells were removed and glycerol release to the incubation medium was measured (Foster & Dunn 1973).
To determine cAMP levels in adipocytes, the cells isolated from the control and diabetic rats were incubated for 30 min in Krebs–Ringer buffer alone, in the buffer containing 0.5 μM epinephrine or epinephrine with 1 nM insulin. Then, the lysis buffer was added to each tube, and the mixture was shaken and incubated for 10 min at room temperature (Szkudelska et al. 2009; Szkudelski & Szkudelska 2011). Cell lysate was transferred to the assay plate, and total cAMP was measured using non-acetylation EIA procedure according to the manufacturer's instruction.
Adiponectin and leptin secretion
To compare adiponectin and leptin secretion in the adipocytes of control and STZ-NA-induced diabetic rats, the cells isolated from both groups of animals were incubated in Krebs–Ringer buffer alone or in the presence of 5 mM glucose and 1 nM insulin, 5 mM glucose and 10 nM insulin, 10 mM glucose and 10 nM insulin, 10 mM alanine and 10 nM insulin or 10 mM leucine and 10 nM insulin. After 2 h, the cells were removed and the adiponectin and leptin levels in the incubation medium were determined.
Statistical analysis
The results represent the means ± SEM from 3–4 independent experiments in quadruplicate. In the case of blood glucose and hormone levels, the means ± SEM represent the values obtained from the control and diabetic rats (n = 20). The results were evaluated statistically using analysis of variance and Duncan's multiple-range test. Differences were considered significant at P < 0.05.
Results
Lipogenesis and glucose transport
Experiments using freshly isolated epididymal adipocytes demonstrated that glucose metabolism is affected in the fat cells of diabetic rats. Compared with the adipocytes of non-diabetic rats, glucose conversion to total lipids induced by 1, 10 or 50 nM insulin was significantly attenuated in the cells of STZ-NA-induced diabetic rats. In these cells, lipogenesis was reduced by 16%, 14% and 20% respectively (Figure 1). Basal lipogenesis did not significantly differ in the adipocytes of control (0.698 ± 0.19 μmol/106 cells/90 min) and diabetic (0.606 ± 0.20 μmol/106 cells/90 min) rats.
Figure 1.
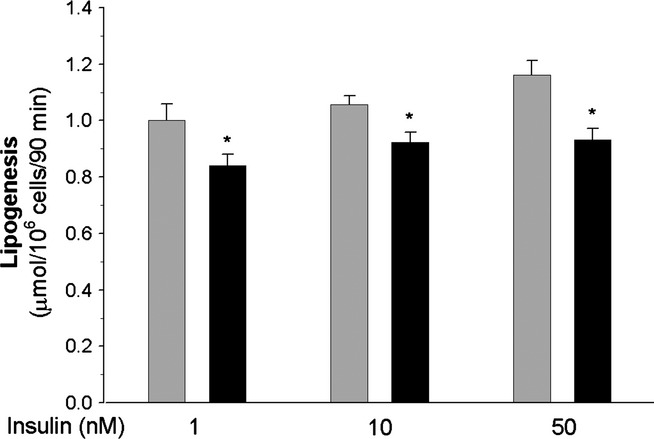
Insulin-induced glucose conversion to total lipids in the adipocytes of control (grey bars) and diabetic (black bars) rats. Values represent means ± SEM of 12 determinations from three separate experiments. *-differences statistically significant between the cells of control and diabetic rats, P < 0.05.
In the further experiments, it was demonstrated that 1 and 10 nM insulin increased intracellular glucose transport in the adipocytes of control rats by 225% and 280%, respectively, compared with basal glucose uptake. However, in the adipocytes of diabetic rats, insulin-induced glucose transport appeared to be significantly lower. It was found that in the presence of 1 or 10 nM insulin, glucose transport was increased by 80% and 140%, respectively, compared with basal values (Figure 2). Basal values were similar in the adipocytes of control and diabetic rats (1.250 ± 14 and 1.105 ± 0.19 nmol/106 cells/3 min respectively).
Figure 2.
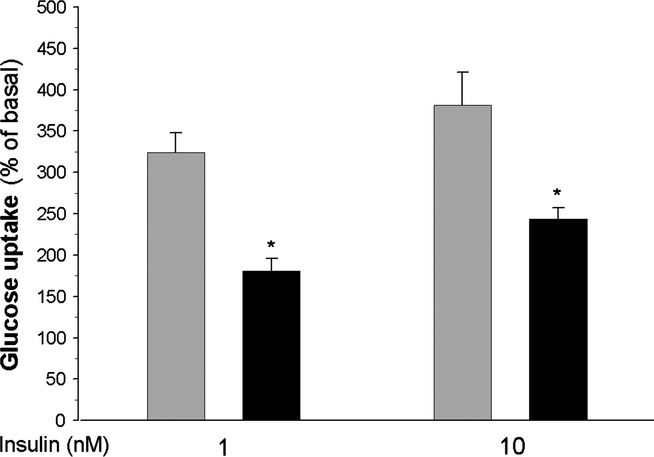
Glucose transport in the adipocytes of control (grey bars) and diabetic (black bars) rats. Values represent means ± SEM of 12 determinations from three separate experiments. Basal glucose uptake was taken as 100%. *-differences statistically significant between the cells of control and diabetic rats, P < 0.05.
Glucose and alanine oxidation
The comparison of glucose oxidation in isolated adipocytes derived from the control and diabetic rats demonstrated that the release of glucose-derived CO2 was diminished in the case of fat cells of diabetic rats, indicating reduced glucose oxidation. In the presence of 1 or 10 nM insulin, glucose oxidation in these cells appeared to be decreased by 12% compared with the adipocytes of non-diabetic rats. However, basal glucose oxidation did not significantly differ in the cells of control (4.23 ± 0.78 nmol/106 cells/90 min) and diabetic (4.01 ± 0.99 nmol/106 cells/90 min) animals.
Conversely to insulin-induced glucose oxidation, alanine oxidation did not significantly differ in the fat cells of normal and diabetic animals (Figure 3).
Figure 3.
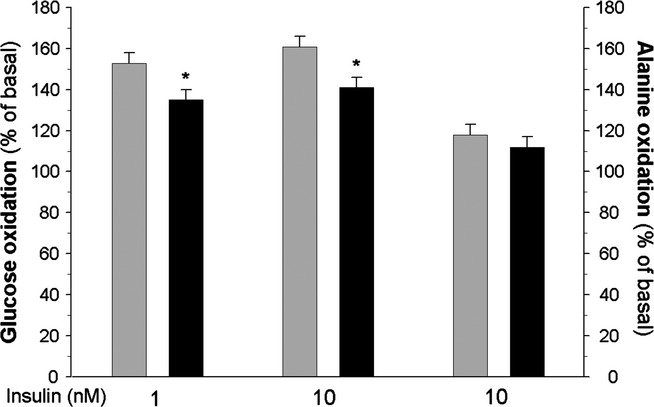
Insulin-induced glucose (left and middle) or alanine (right) oxidation in the adipocytes of control (grey bars) and diabetic (black bars) rats. Values represent means ± SEM of 16 determinations from four separate experiments. Basal oxidation was taken as 100%. *-differences statistically significant between the cells of control and diabetic rats, P < 0.05.
Lipolysis and cAMP content
As expected, exposure of adipocytes to epinephrine increased glycerol release from these cells. However, incubations of adipocytes with increasing concentrations of the hormone allowed us to demonstrate that the lipolytic response to 0.06, 0.125 and 0.25 μM epinephrine was higher (by 80%, 45% and 30%, respectively) in the cells of diabetic rats compared with the adipocytes of control animals. The difference in lipolysis between the adipocytes of control and diabetic rats was not observed in the presence of higher epinephrine concentrations. It was also found that lipolysis induced by dibutyryl-cAMP did not significantly differ in the cells of control and diabetic rats (Figure 4). The inhibitory effects of insulin on lipolysis induced by 0.5 μM epinephrine tended to be lower in the adipocytes of diabetic rats. In the presence of 1 and 10 nM insulin, epinephrine-induced lipolysis was reduced by 48% and 68%, respectively, in the fat cells of non-diabetic rats and by 43% and 57% in the adipocytes of diabetic rats. The difference was statistically significant only in the case of 10 nM insulin (Figure 5).
Figure 4.
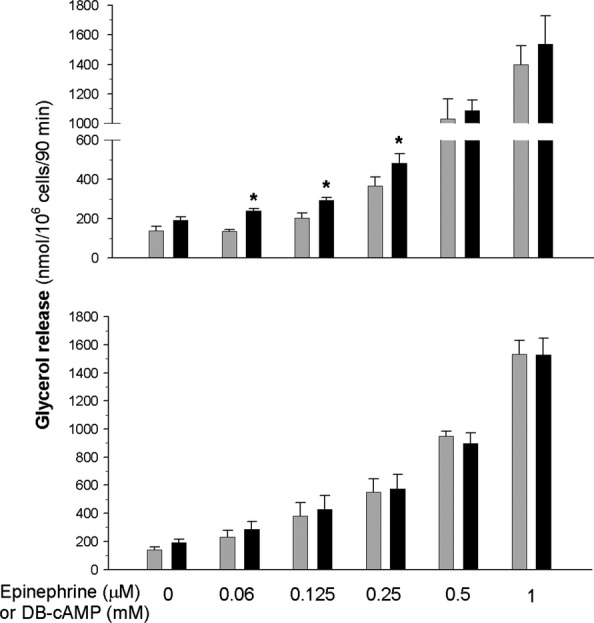
Lipolysis induced by epinephrine (top) or dibutyryl-cAMP (DB-cAMP, bottom) in the adipocytes of control (grey bars) and diabetic (black bars) rats. Values represent means ± SEM of 16 determinations from four separate experiments. *-differences statistically significant between the cells of control and diabetic rats, P < 0.05.
Figure 5.
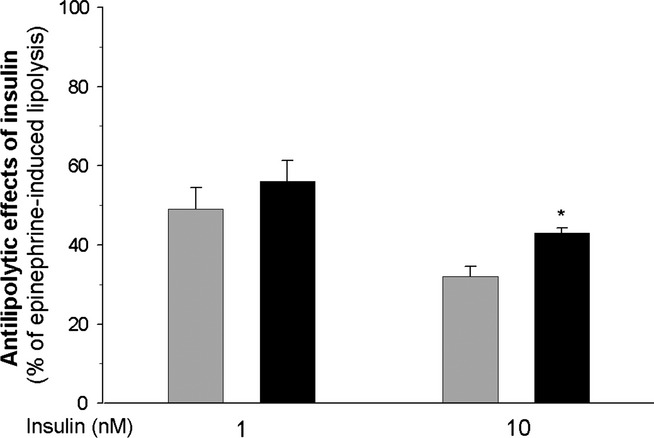
Anti-lipolytic effects of insulin on lipolysis induced by 0.5 μM epinephrine in the adipocytes of control (grey bars) and diabetic (black bars) rats. Values represent means ± SEM of 16 determinations from four separate experiments. Epinephrine-induced lipolysis was taken as 100%. *-differences statistically significant between the cells of control and diabetic rats, P < 0.05.
Basal cAMP levels were similar in the adipocytes isolated from the control and diabetic rats. Exposure of adipocytes for 30 min to 0.5 μM epinephrine significantly increased cAMP levels in both groups of cells. However, compared with basal values, epinephrine increased cAMP by 170% and 270% in the adipocytes of control rats and in the cells of diabetic animals respectively. Similar effects were found in the presence of 0.5 μM epinephrine and 1 nM insulin. It was demonstrated that under these conditions, cAMP was increased by 130% and 240% in the adipocytes of non-diabetic and diabetic rats respectively (Figure 6).
Figure 6.
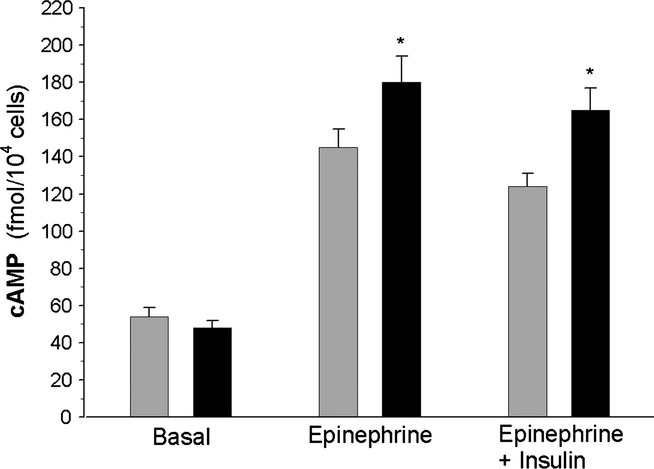
cAMP levels in the adipocytes of control (grey bars) and diabetic (black bars) rats. Cells were incubated for 30 min without epinephrine, in the presence of 0.5 μM epinephrine or in the presence of 0.5 μM epinephrine and 1 nM insulin. Values represent means ± SEM of 16 determinations from four separate experiments. *-differences statistically significant between the cells of control and diabetic rats, P < 0.05.
Adiponectin and leptin secretion
In this study, blood adiponectin and leptin levels were slightly lower in the diabetic rats compared with the control animals. In STZ-NA-induced diabetic rats, blood adiponectin and leptin levels were decreased by 20% and 15% respectively (Table 1). In agreement with these results, experiments on isolated adipocytes revealed impaired secretory activity of cells derived from the diabetic animals. It was observed that adiponectin secretion induced by insulin and glucose or insulin in combination with alanine or leucine was decreased in the cells derived from STZ-NA-induced diabetic rats by 20–25% compared with the adipocytes of control rats. Leptin secretion, determined under the same experimental conditions, appeared to be decreased by 15–45% in the adipocytes of diabetic animals (Figure 7).
Figure 7.
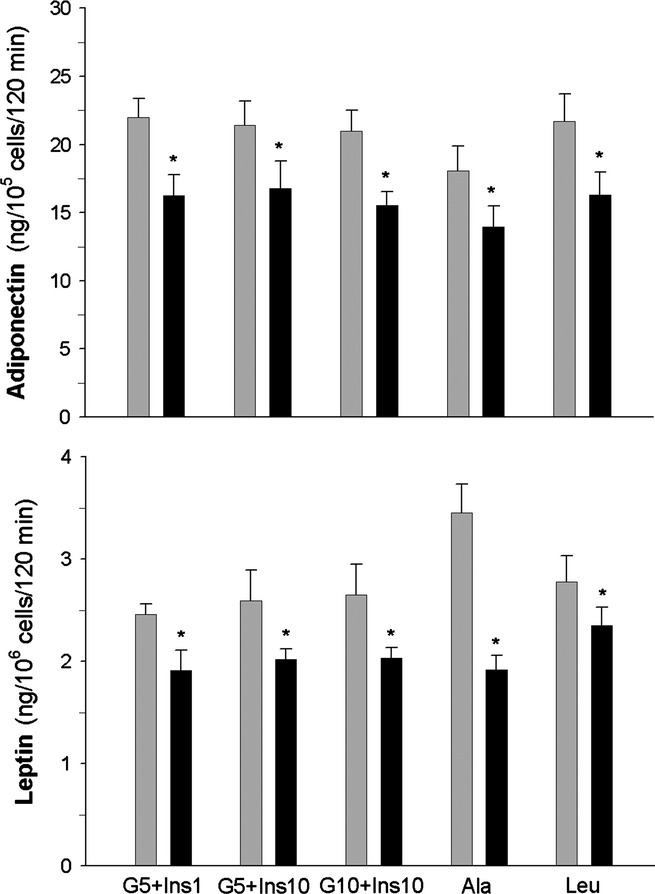
Adiponectin (top) and leptin (bottom) secretion from the adipocytes of control (grey bars) and diabetic (black bars) rats. Cells were incubated in the presence of 5 mM glucose and 1 nM insulin (G5+Ins1), 5 mM glucose and 10 nM insulin (G5+Ins10), 10 mM glucose and 10 nM insulin (G10+Ins10), 10 mM alanine and 10 nM insulin (Ala) or 10 mM leucine and 10 nM insulin (Leu). Values represent means ± SEM of 12 determinations from three separate experiments. *-differences statistically significant between the cells of control and diabetic rats, P < 0.05.
Discussion
Rats with diabetes induced by STZ and NA are known to have reduced B-cell mass and concomitant dysfunction of residual insulin-secreting cells. However, the severity of diabetes in these animals is different depending on experimental conditions (Masiello et al. 1998; Masiello 2006; Szkudelski 2012). In the present study, blood glucose and insulin levels were only slightly changed in the diabetic rats compared with the control animals. This indicates that relatively mild diabetes was induced. Our results provided evidence that both metabolism of epididymal adipose tissue and adipokine secretion are affected in STZ-NA-induced diabetic rats.
It was demonstrated that insulin-induced lipogenesis from glucose is impaired in the fat cells of diabetic rats. The decrease in glucose conversion to lipids in the adipocytes may be due to defective intracellular transport and/or metabolism of glucose. In our present work, both insulin-induced glucose transport and oxidation were significantly reduced in the adipose cells of diabetic rats. Therefore, in the further part of the study, glucose was replaced by alanine and oxidation of this amino acid was compared in the fat cells of control and diabetic rats. Alanine transport differs from that of glucose (Hatanaka et al. 2006), and the use of alanine allowed us to bypass potential defects in glucose transport. Conversely to glucose oxidation, alanine metabolism to CO2 appeared to be similar in the adipocytes of control and diabetic rats. Although some defects in glucose metabolism cannot be excluded, these results indicate that the decrease in both glucose oxidation and conversion to lipids is mainly due to reduced glucose transport in the adipocytes of diabetic rats. It is known that glucose transport into adipose cells is potentiated by insulin and this effect is preceded by increased transcription and translation of glucose transporter (GLUT4). Insulin also increases the translocation of GLUT4 to the plasma membrane (Thoidis et al. 1993). Therefore, reduced glucose transport found in the fat cells of STZ-NA-induced diabetic rats may result from slight, but long-term decrease in blood insulin levels in these animals. This assumption is supported by the results of the previous studies. Fierabracci et al. (2002) also demonstrated reduced lipogenesis in the adipocytes of STZ-NA-induced diabetic rats, and this effect was suppressed by in vivo treatment of the animals with vanadyl sulphate, a compound with the insulin-mimetic activity. It is also known that in rats with diabetes induced by STZ alone, GLUT4 transcription and glucose transport in the adipocytes are decreased. These abnormalities are thought to be mediated via a rise in intracellular cAMP levels (Gerrits et al. 1993; Marti et al. 2001). In our present study, basal cAMP levels did not differ in the adipocytes of control and diabetic rats; however, epinephrine-induced rise in cAMP was higher in the latter cells, even in the presence of insulin. This indicates an increased sensitivity to cAMP-generating agents in the epididymal adipocytes of STZ-NA-induced diabetic rats. Moreover, increased cAMP levels may contribute to diminished glucose transport in these cells.
Apart from changes in lipid synthesis, triglyceride breakdown was also demonstrated to be affected in the fat cells of diabetic rats. It was found that lipolytic response to epinephrine was increased in the adipocytes of STZ-NA-induced diabetic rats compared with the cells of control animals. This effect was observed at lower concentrations of the hormone. It is known that lipolytic rate in the adipocytes strongly depends on cAMP levels. The rise in cAMP levels activates protein kinase A (PKA), leading to the phosphorylation of both perilipin 1 and hormone-sensitive lipase and to increase in triglyceride breakdown (Carmen & Víctor 2006). Our present study revealed that in the presence of epinephrine, intracellular cAMP levels were higher in the adipocytes of diabetic rats. This may explain increased lipolytic response to epinephrine in the fat cells of these animals. Moreover, it was also demonstrated that lipolysis induced by dibutyryl-cAMP, a non-metabolizable cAMP analogue and a direct activator of PKA, did not significantly differ in the adipocytes of control and diabetic rats. This observation supports the notion that higher lipolysis elicited by low epinephrine concentrations in the adipocytes of diabetic rats is dependent on a rise in intracellular cAMP levels.
The inhibitory action of insulin on epinephrine-induced lipolysis was demonstrated to be slightly deteriorated in the adipocytes of STZ-NA-induced diabetic rats compared with the cells of control animals. Because the activation of cAMP phosphodiesterase with a concomitant reduction in intracellular cAMP level is essential for the anti-lipolytic action of insulin (Eriksson et al. 1995), this effect may result from increased cAMP levels in the adipocytes of diabetic rats.
Apart from lipid storage, adipose tissue is well known to secrete adipokines. In rats with STZ-NA-induced diabetes, blood adiponectin levels were demonstrated to be reduced (L'Abbate et al. 2007; Palsamy & Subramanian 2011) or unchanged (Li et al. 2011). In our present study, blood adiponectin concentrations were slightly diminished in diabetic animals. Additionally, it was demonstrated that blood leptin level was also slightly reduced. Because fat tissue is the main source of circulating adiponectin and leptin, secretion of these adipokines was compared in the isolated adipocytes derived from the control and diabetic rats. It was found that the epididymal adipocytes of STZ-NA-induced diabetic rats released less adiponectin and leptin compared with the cells of non-diabetic animals. This indicates that the decrease in blood adiponectin and leptin levels in diabetic rats is due to the diminished secretion of these adipokines from adipose tissues. The difference in adiponectin and leptin secretion between the adipocytes of control and diabetic rats was observed when cells were exposed to 5 mM glucose and 1 nM insulin and was not suppressed by higher concentrations of these stimulators. It is very likely that the worsening of adipokine secretion observed in the adipocytes of diabetic rats in the presence of glucose and insulin results from reduced glucose transport and metabolism found in our present study. This is in agreement with data demonstrating that glucose metabolism providing ATP in adipocytes is a prerequisite for adiponectin and leptin secretion (Levy et al. 2000; Cammisotto et al. 2005; Szkudelski 2007; Szkudelski et al. 2011).
In the further part of the study, adipokine secretion was stimulated by alanine in combination with insulin or by leucine with insulin. Alanine and leucine were previously demonstrated to enhance leptin release from the isolated rat adipocytes; however, the mechanism of their action differs (Cammisotto et al. 2005, 2006; Szkudelski et al. 2005). Alanine is converted to pyruvate and is used to replace glucose, whereas leucine is known to activate mammalian target of rapamycin (mTOR) in the adipocytes and thereby is able to induce short-term stimulatory effects without any changes in mRNA (Roh et al. 2003; Cammisotto et al. 2006). However, despite the use of different stimulators, secretion of adiponectin and leptin was still attenuated in the adipocytes of STZ-NA-induced diabetic rats.
Our results and previous data (Fierabracci et al. 2002) demonstrated an impaired insulin action in the adipocytes of diabetic rats, suggesting insulin resistance. On the other hand, it is known that the treatment of STZ-NA-induced diabetic rats with sulphonylureas increases blood insulin levels and thereby normalizes glycaemia (Masiello et al. 1998; Szkudelski 2012). This indicates that glucose intolerance in animals with this experimental model is rather due to insufficient insulin secretion. Moreover, there is no evidence that insulin resistance develops in STZ-NA-induced diabetic rats. Therefore, impaired insulin action in adipocytes isolated from diabetic rats may result from a slight, but long-term decrease in blood insulin concentrations in these animals. This decrease in blood insulin could generate numerous intracellular changes that were observed in the isolated adipocytes. This assumption is supported by data demonstrating that insulin deficiency, among others, down-regulates adiponectin, leptin and glucose transporter GLUT4 mRNA in rat adipocytes (Sivitz et al. 1989; MacDougald et al. 1995; Cong et al. 2007).
Results of the present study provided evidence that lipogenic activity of the adipocytes in STZ-NA-induced diabetic rats is diminished, probably due to reduced glucose transport. Moreover, lipolytic response to epinephrine is slightly increased, and the anti-lipolytic insulin action is slightly reduced in the adipocytes of diabetic rats. These effects are probably related to increased cAMP levels. Metabolic alterations are accompanied by a diminished release of adiponectin and leptin from the adipocytes of diabetic rats. Our results also indicate that STZ-NA-induced diabetic model may be useful in studies addressing various aspects of adipose tissue dysfunction, including the effects of different physiological and pharmacological compounds on adipocyte metabolism and adipokine secretion. It should be, however, emphasized that our results refer to the cells of epididymal fat tissue, which is classified as visceral fat tissue. This is of importance because sensitivity to hormones and other physiological features of visceral and subcutaneous fat tissues differ significantly.
Acknowledgments
This study was supported by the Ministry of Science and Higher Education Research Project Number: N N303 551439
Conflict of interest
The authors declare that there is no conflict of interest.
References
- American Diabetes Association. Diagnosis and classification of diabetes mellitus. Diab. Care. 2006;29:43–48. [Google Scholar]
- Bergmeyer HU, Bernt E. D-glucose determination with glucose oxidase and peroxidase. In: Bergmeyer HU, editor. Methods of Enzymatic Analysis. New York: Academic Press; 1974. pp. 1205–1215. [Google Scholar]
- Cammisotto PG, Gélinas Y, Deshaies Y, Bukowiecki LJ. Regulation of leptin secretion from white adipocytes by insulin, glycolytic substrates, and amino acids. Am. J. Physiol. Endocrinol. Metab. 2005;289:166–171. doi: 10.1152/ajpendo.00602.2004. [DOI] [PubMed] [Google Scholar]
- Cammisotto PG, Bukowiecki LJ, Deshaies Y, Bendayan M. Leptin biosynthetic pathway in white adipocytes. Biochem. Cell Biol. 2006;84:207–214. doi: 10.1139/o06-032. [DOI] [PubMed] [Google Scholar]
- Capurso C, Capurso A. From excess adiposity to insulin resistance: the role of free fatty acids. Vascul. Pharmacol. 2012;57:91–97. doi: 10.1016/j.vph.2012.05.003. [DOI] [PubMed] [Google Scholar]
- Carmen GY, Víctor SM. Signaling mechanisms regulating lipolysis. Cell. Signal. 2006;18:401–408. doi: 10.1016/j.cellsig.2005.08.009. [DOI] [PubMed] [Google Scholar]
- Cong L, Chen K, Li J, et al. Regulation of adiponectin and leptin secretion and expression by insulin through a PI3K-PDE3B dependent mechanism in rat primary adipocytes. Biochem. J. 2007;403:519–525. doi: 10.1042/BJ20061478. [DOI] [PMC free article] [PubMed] [Google Scholar]
- Cusi K. The role of adipose tissue and lipotoxicity in the pathogenesis of type 2 diabetes. Curr. Diab. Rep. 2010;10:306–315. doi: 10.1007/s11892-010-0122-6. [DOI] [PubMed] [Google Scholar]
- Dunmore SJ, Brown JE. The role of adipokines in β-cell failure of type 2 diabetes. Endocrinology. 2013;216:37–45. doi: 10.1530/JOE-12-0278. [DOI] [PubMed] [Google Scholar]
- Eriksson H, Ridderstråle M, Degerman E, et al. Evidence for the key role of the adipocyte cGMP-inhibited cAMP phosphodiesterase in the antilipolytic action of insulin. Biochim. Biophys. Acta. 1995;1266:101–107. doi: 10.1016/0167-4889(94)00237-9. [DOI] [PubMed] [Google Scholar]
- Fierabracci V, Tata De V, Pocai A, Novelli M, Barberà A, Masiello P. Oral tungstate treatment improves only transiently alteration of glucose metabolism in a new rat model of type 2 diabetes. Endocrine. 2002;19:177–184. doi: 10.1385/ENDO:19:2:177. [DOI] [PubMed] [Google Scholar]
- Foster LB, Dunn RT. Stable reagents for determination of serum triglycerides by a colorimetric Hantzsch condensation method. Clin. Chem. 1973;19:338–340. [PubMed] [Google Scholar]
- Gerrits PM, Olson AL, Pessin JE. Regulation of the GLUT4/muscle-fat glucose transporter mRNA in adipose tissue of insulin-deficient diabetic rats. J. Biol. Chem. 1993;268:640–644. [PubMed] [Google Scholar]
- Hatanaka T, Hatanaka Y, Tsuchida J, Ganapathy V, Setou M. Amino acid transporter ATA2 is stored at the trans-Golgi network and released by insulin stimulus in adipocytes. J. Biol. Chem. 2006;281:39273–39284. doi: 10.1074/jbc.M604534200. [DOI] [PubMed] [Google Scholar]
- L'Abbate A, Neglia D, Vecoli C, et al. Beneficial effect of heme oxygenase-1 expression on myocardial ischemia-reperfusion involves an increase in adiponectin in mildly diabetic rats. Am. J. Physiol. Heart. Circ. Physiol. 2007;293:3532–3541. doi: 10.1152/ajpheart.00826.2007. [DOI] [PubMed] [Google Scholar]
- Leahy JL. Pathogenesis of type 2 diabetes mellitus. Arch. Med. Res. 2005;36:197–209. doi: 10.1016/j.arcmed.2005.01.003. [DOI] [PubMed] [Google Scholar]
- Lenzen S. The mechanisms of alloxan-and streptozotocin-induced diabetes. Diabetologia. 2008;51:216–226. doi: 10.1007/s00125-007-0886-7. [DOI] [PubMed] [Google Scholar]
- Levy JR, Gyarmati J, Lesko JM, Adler RA, Stevens W. Dual regulation of leptin secretion: intracellular energy and calcium dependence of regulated pathway. Am. J. Physiol. Endocrinol. Metab. 2000;278:892–901. doi: 10.1152/ajpendo.2000.278.5.E892. [DOI] [PubMed] [Google Scholar]
- Li HT, Wu XD, Davey AK, Wang J. Antihyperglycemic effects of baicalin on streptozotocin-nicotinamide induced diabetic rats. Phytother. Res. 2011;25:189–194. doi: 10.1002/ptr.3238. [DOI] [PubMed] [Google Scholar]
- MacDougald OA, Hwang CS, Fan H, Lane MD. Regulated expression of the obese gene product (leptin) in white adipose tissue and 3T3-L1 adipocytes. Proc. Natl Acad. Sci. USA. 1995;92:9034–9037. doi: 10.1073/pnas.92.20.9034. [DOI] [PMC free article] [PubMed] [Google Scholar]
- Marti L, Abella A, Carpéné C, Palacín M, Testar X, Zorzano A. Combined treatment with benzylamine and low dosages of vanadate enhances glucose tolerance and reduces hyperglycemia in streptozotocin-induced diabetic rats. Diabetes. 2001;50:2061–2068. doi: 10.2337/diabetes.50.9.2061. [DOI] [PubMed] [Google Scholar]
- Masiello P. Animal models of type 2 diabetes with reduced pancreatic beta-cell mass. Int. J. Biochem. Cell Biol. 2006;38:873–893. doi: 10.1016/j.biocel.2005.09.007. [DOI] [PubMed] [Google Scholar]
- Masiello P, Broca C, Gross R, et al. Experimental NIDDM: development of a new model in adult rats administered streptozotocin and nicotinamide. Diabetes. 1998;47:224–229. doi: 10.2337/diab.47.2.224. [DOI] [PubMed] [Google Scholar]
- Palsamy P, Subramanian S. Modulatory effects of resveratrol on attenuating the key enzymes activities of carbohydrate metabolism in streptozotocin-nicotinamide-induced diabetic rats. Chem. Biol. Interact. 2009;179:356–362. doi: 10.1016/j.cbi.2008.11.008. [DOI] [PubMed] [Google Scholar]
- Palsamy P, Subramanian S. Resveratrol protects diabetic kidney by attenuating hyperglycemia-mediated oxidative stress and renal inflammatory cytokines via Nrf2-Keap1 signaling. Biochim. Biophys. Acta. 2011;1812:719–731. doi: 10.1016/j.bbadis.2011.03.008. [DOI] [PubMed] [Google Scholar]
- Pari L, Sankaranarayanan C. Beneficial effects of thymoquinone on hepatic key enzymes in streptozotocin-nicotinamide induced diabetic rats. Life Sci. 2009;85:830–834. doi: 10.1016/j.lfs.2009.10.021. [DOI] [PubMed] [Google Scholar]
- Rodbell M. Metabolism of isolated fat cells. J. Biol. Chem. 1964;239:375–380. [PubMed] [Google Scholar]
- Roh C, Han J, Tzatsos A, Kandror KV. Nutrient-sensing mTOR-mediated pathway regulates leptin production in isolated rat adipocytes. Am. J. Physiol. Endocrinol. Metab. 2003;284:322–330. doi: 10.1152/ajpendo.00230.2002. [DOI] [PubMed] [Google Scholar]
- Sivitz WI, DeSautel SL, Kayano T, Bell GI, Pessin JE. Regulation of glucose transporter messenger RNA in insulin-deficient states. Nature. 1989;340:72–74. doi: 10.1038/340072a0. [DOI] [PubMed] [Google Scholar]
- Szkudelska K, Nogowski L, Szkudelski T. Genistein affects lipogenesis and lipolysis in isolated rat adipocytes. J. Steroid Biochem. Mol. Biol. 2000;75:265–271. doi: 10.1016/s0960-0760(00)00172-2. [DOI] [PubMed] [Google Scholar]
- Szkudelska K, Nogowski L, Szkudelski T. Resveratrol, a naturally occurring diphenolic compound, affects lipogenesis, lipolysis and the antilipolytic action of insulin in isolated rat adipocytes. J. Steroid Biochem. Mol. Biol. 2009;113:17–24. doi: 10.1016/j.jsbmb.2008.11.001. [DOI] [PubMed] [Google Scholar]
- Szkudelska K, Nogowski L, Szkudelski T. Resveratrol and genistein as adenosine triphosphate-depleting agents in fat cells. Metabolism. 2011;60:720–729. doi: 10.1016/j.metabol.2010.07.006. [DOI] [PubMed] [Google Scholar]
- Szkudelski T. The mechanism of alloxan and streptozotocin action in B cells of the rat pancreas. Physiol. Res. 2001;50:537–546. [PubMed] [Google Scholar]
- Szkudelski T. Intracellular mediators in regulation of leptin secretion from adipocytes. Physiol. Res. 2007;56:503–512. doi: 10.33549/physiolres.931038. [DOI] [PubMed] [Google Scholar]
- Szkudelski T. Streptozotocin-nicotinamide-induced diabetes in the rat. Characteristics of the experimental model. Exp. Biol. Med. 2012;237:481–490. doi: 10.1258/ebm.2012.011372. [DOI] [PubMed] [Google Scholar]
- Szkudelski T, Szkudelska K. Short-term effects of palmitate and 2-bromopalmitate on the lipolytic activity of rat adipocytes. Life Sci. 2011;89:450–455. doi: 10.1016/j.lfs.2011.07.010. [DOI] [PubMed] [Google Scholar]
- Szkudelski T, Nowicka E, Szkudelska K. Leptin secretion and protein kinase A activity. Physiol. Res. 2005;54:79–85. doi: 10.33549/physiolres.930570. [DOI] [PubMed] [Google Scholar]
- Szkudelski T, Nogowski L, Szkudelska K. Short-term regulation of adiponectin secretion in rat adipocytes. Physiol. Res. 2011;60:521–530. doi: 10.33549/physiolres.931971. [DOI] [PubMed] [Google Scholar]
- Szkudelski T, Zywert A, Szkudelska K. Metabolic disturbances and defects in insulin secretion in rats with streptozotocin-nicotinamide-induced diabetes. Physiol. Res. 2013;6:633–670. doi: 10.33549/physiolres.932509. [DOI] [PubMed] [Google Scholar]
- Thoidis G, Kotliar N, Pilch PF. Immunological analysis of GLUT4-enriched vesicles. Identification of novel proteins regulated by insulin and diabetes. J. Biol. Chem. 1993;268:11691–11696. [PubMed] [Google Scholar]


