

Abstract
There is growing evidence that behavioral tendencies, or “personalities,” in animals are an important aspect of their biology, yet their evolutionary basis is poorly understood. Specifically, how individual variation in personality arises and is subsequently maintained by selection remains unclear. To address this gap, studies of personality require explicit incorporation of genetic information. Here, we explored the genetic basis of personality in rhesus macaques by determining the heritability of personality components and by examining the fitness consequences of those components. We collected observational data for 108 adult females living in three social groups in a free-ranging population via focal animal sampling. We applied principal component analysis to nine spontaneously occurring behaviors and identified six putative personality components, which we named Meek, Bold, Aggressive, Passive, Loner, and Nervous. All components were repeatable and heritable, with heritability estimates ranging from 0.14 to 0.35. We found no evidence of an association with reproductive output, measured either by infant survival or by interbirth interval, for any of the personality components. This finding suggests either that personality does not have fitness-related consequences in this population or that selection has acted to reduce fitness-associated variation in personality.
Keywords: Additive genetic variance, Behavioral tendencies, Fitness, Quantitative genetics, Reproductive success
Introduction
Personality has been defined as the systematic and consistent expression of differences between individuals in behavioral tendencies in a manner that is correlated across time and contexts (Gosling et al. 2003; Sih et al. 2004; Wolf and Weissing 2012). Within a population or species, individuals may vary along axes of behavioral variation, such as the Shy–Bold axis reported in fish, birds, and other vertebrates (Wilson et al. 1994), as well as the Harm Avoidance, Novelty Seeking, and Extraversion dimensions in humans (Cloninger et al. 1991; McCrae and Costa 1999). Inherent to the concept of personality is therefore the possibility that interindividual variation does not simply represent the extreme ends of trait distribution against which selection acts, but instead that being different might be advantageous, and that observed variation might actually result from selective pressures (van Oers et al. 2005). Thus, one of the most fundamental questions in the study of personality is how variation between individuals arises and is subsequently maintained (Sih et al. 2004; van Oers and Mueller 2010; van Oers et al. 2005; Wolf and Weissing 2012). To begin to address this question, three distinct pieces of information are required: 1) the heritability of personality dimensions, 2) genetic correlations between personality dimensions, and 3) the fitness consequences of personality dimensions.
Selection cannot act on personality unless there is a mechanism for its inheritance (Falconer and Mackay 1996; Fisher 1930; Visscher et al. 2008). Phenotypic variation in personality dimensions may be entirely due to genetic differences, environmental or context-dependent phenotypic plasticity, or a combination of these factors (Wolf and Weissing 2012). The relative contributions of each of these factors can be estimated using statistical models (“heritability models”) in which phenotypic variation is equal to the sum of the contribution of variance in genotype to the contribution of variance in environment (Falconer and Mackay 1996; Visscher et al. 2008). In these models, heritability (in the narrow sense, h2) represents the proportion of phenotypic variance that is explained by additive genetic variance (Falconer and Mackay 1996). A high heritability implies that most of the variation observed in a trait in a given population is caused by variation in genes. Nonzero heritability also suggests that functional gene candidates —probably many in the case of personality (van Oers et al. 2005)— exist whose causal role in the production of heterogeneous traits can be explored (van Oers and Mueller 2010).
Heritability estimates for personality dimensions ranging from 0 to 0.4 have been found in a number of species in a variety of taxa, including squid (Sinn et al. 2006), fish (Bakker 1986), birds (Bize et al. 2012; Dingemanse et al. 2002; van Oers et al. 2004), sheep (Reale and Festa-Bianchet 2003), and squirrels (Taylor et al. 2012). In apes, including humans, heritability estimates of personality dimensions range from 0.07 to 0.63 (humans, Homo sapiens: Bouchard and Loehlin 2001; Johnson et al. 2008; chimpanzees, Pan troglodytes: Weiss et al. 2000, 2002; orang-utans, Pongo spp.: Adams et al. 2012). In these studies, personality was assessed using questionnaires completed either by human subjects themselves, or by human observers of nonhuman primates. In captive monkeys, “impulsivity” in vervets (Chlorocebus pygerythrus) and the “fearful-anxious axis” in rhesus macaques (Macaca mulatta) —both evaluated via experimental assay— yielded heritabilities ranging from 0.25 to 0.61, and from 0.32 to 1.0, respectively (Fairbanks et al. 2004; Williamson et al. 2003).
Personality is multivariate in nature; a variety of dimensions are required to represent the suites of behavioral tendencies expressed by individuals, both in general and in specific contexts. Determining whether correlations exist between different personality dimensions is fundamental to understanding their evolution since selection acting on one trait can influence the other, possibly restricting evolutionary change (Lande and Arnold 1983; Lynch and Walsh 1998; van Oers and Mueller 2010; van Oers et al. 2005). The total amount of covariance between traits is the sum of their phenotypic and genotypic covariances (Lynch and Walsh 1998). Given their importance, it may appear surprising that few studies (Fairbanks et al. 2004; Sinn et al. 2006; Weiss et al. 2002) have examined genetic correlations between personality dimensions to date (Dochtermann and Roff 2010; Sih et al. 2004; van Oers et al. 2005). The absence of this information is due in large part to the restrictively large samples sizes (N = at least 200) required to produce reliable estimates of genetic covariance (Wilson et al. 2010).
For a trait to evolve, it not only requires a mechanism of inheritance but must also have fitness consequences (Endler 1986). In the case of personality dimensions, understanding their relationships with fitness provides information on processes underlying their maintenance and on their ultimate biological impact. For example, we might find evidence of disruptive selection, in which trait distributions are pushed toward their antipodes; linear selection, in which variance is minimised by pushing trait distributions toward one extreme; or stabilizing selection, in which trait variance is pushed toward a fixed value (Lande and Arnold 1983). Fitness consequences can also illuminate the existence of trade-offs between different personality dimensions or between the same dimension in different contexts (Dingemanse et al. 2004; Smith and Blumstein 2008).
Despite the importance of understanding the heritability, genetic collinearity, and fitness consequences of personality, quantitative genetic research on personality in animals is in its infancy (van Oers and Mueller 2010). In this study, we explored the genetic basis of personality in female rhesus macaques by investigating the heritability of personality components and their fitness consequences. We also explored the genetic correlations between different personality components, while recognizing the low statistical power of analyses with as limited sample sizes as ours. We conducted this study in the rhesus macaque colony of Cayo Santiago Island, Puerto Rico. We took advantage of the free-ranging living conditions in which the monkeys live, our ability to collect detailed daily observations of their behaviors, and the absence of human constraint or manipulation of the subjects’ breeding activity.
We began by extracting potential personality components from observational data on the macaques’ spontaneously occurring behaviors. Studies of nonhuman animals often characterize personality using questionnaires completed by people who are familiar with the subjects from previous or ongoing observations (Adams et al. 2012; Uher and Asendorpf 2008; Weiss et al. 2002), or by using behavioral assays in which individuals are presented with an experimental paradigm, and their response(s) are then recorded by experimenters (Bize et al. 2012; Fairbanks et al. 2004; Sinn et al. 2006). The latter approach has the advantage of allowing researchers to control and manipulate the contexts in which subjects are tested, as well as allowing for the relatively rapid assessment of large numbers of individuals. However, a growing number of studies have relied on the spontaneously occurring behaviors of subjects recorded in an observational, nonexperimental, manner (Kralj-Fiser et al. 2010; Seyfarth et al. 2012; Uher and Asendorpf 2008). Although time-intensive (Krause et al. 2010), this approach has advantages. Specifically, it allows the subjects’ behaviors to determine what variation is, or is not, important, as well as allowing personality components to emerge from existing correlations among behaviors in the absence of experimentally imposed constraints or human-defined questions (Kralj-Fiser et al. 2010; Seyfarth et al. 2012; Uher and Asendorpf 2008). This approach also lends itself to the simultaneous exploration of multiple personality components, and thereby allows researchers to examine the relationships that exist between them.
In our study, we examined nine commonly occurring behaviors drawn from a standard rhesus macaque ethogram (Brent 2010). We selected behaviors we considered to represent individuals’ general tendencies as well as their reactions toward specific events, such as competitive social interactions, e.g., the expression of submissive gestures toward others, and self-directed behaviors, which are behavioral indicators of anxiety (Schino et al. 1996). In addition, we targeted behaviors over which individuals have control, i.e., behaviors a subject directs toward others, rather than behaviors the subject receives from others. Finally, for social behaviors, we focused on those that do not rely heavily on the participation of both the subject and a partner, i.e., behaviors such as vocalizations in which the subject can vocalize to another individual, regardless of what that individual is doing.
We used principal component analysis (PCA), in which behaviors that correlate with each other are placed on to the same component, to produce “personality” components. The same approach has been used in studies of personality in humans (McCrae and Costa 1999), geese (Kralj-Fiser et al. 2010), and baboons (Seyfarth et al. 2012). We explored the intraindividual repeatability of the PCA-generated personality components and determined whether variation in the personality components could be explained partly by attributes such as dominance rank, the availability of closely related kin, and age, which are known or believed to play important roles in the lives of female Old World monkeys (Cords 2012). We used quantitative genetic models to determine the heritability of the personality components and to explore their genetic correlations. Finally, we examined the association between the personality components and two measures of reproductive output: infant survival and interbirth interval.
Methods
Study Site and Subjects
Subjects were 108 adult females from three groups of free-ranging rhesus macaques (Macaca mulatta) living on Cayo Santiago Island, Puerto Rico. This population was established in 1938 with a single founding population from India (Rawlings and Kessler 1986). At the time of study there were six social groups on the island. Subjects were individually recognized and habituated to observers. Macaques are provisioned daily with commercial feed and browse on natural vegetation with water supplied ad libitum. Population control, involving the removal of a small number of juveniles, is undertaken once yearly. Macaques are not handled outside the removal period and there is no regular medical intervention.
The rhesus macaque social system includes high levels of affiliation and despotism, characterized by intense unidirectional aggression from dominants to subordinates (Thierry 2004). Unlike males, adult females are philopatric and form stable linear dominance hierarchies, with daughters securing ranks immediately below their mothers (Chikazawa et al. 1979; Datta 1988; Hadidian and Bernstein 1979).
Analyses were based on 3 yr of observation (2007, 2010, 2011) of adult females (six, 25 yr of age) in groups F, S, and V. We conducted behavioral observations during a single year for each group (group S: 2011, N = 19; group V: 2007, N = 21), apart from group F in which data were collected in both 2010 (N = 58) and 2011 (N = 66). The increase in female numbers in group F was due to maturation of juveniles to adults. Analyses were based on observations collected during the birth season only (July–December) because differences in female social networks between the mating and birth seasons are seen in this population (Brent et al. 2013).
Behavioral Data
We collected behavioral data in the same fashion across all groups using 10-min continuous focal animal samples. We collected 997.2 total h of focal animal data with means (SD) of 4.07 (0.39) and 5.02 (0.11) h per subject in group F in 2010 and 2011, respectively, and of 5.11 (0.31) and 2.69 (0.19) h per subject in groups S and V. We controlled for time of day with data collection evenly spread throughout the day between and within subjects. We recorded the occurrence of all affiliative, aggressive, and self-directed behaviors, including the identity of the focal individual’s social partner when appropriate. We determined dominance rank from the direction and outcome of submissive interactions.
We used nine behavioral measures to construct the components of personality: 1–2) Approaches: the rate at which a female approached (1) higher-ranking females or (2) lower ranking females. We included only “friendly” approaches, i.e., approaches that were not immediately followed by aggression, and subjects had to come within ≥2 m of another individual for an approach to be scored. 3–4) Vocalizations: rate at which a female vocalized in an affiliative manner (girneys, grunts) toward (3) higher-ranking or (4) lower-ranking females. 5) Passive contact: the amount of time a female spent in passive, physical contact with other females, i.e., contact that did not include grooming or aggressive interactions relative to the amount of time (h) she was observed. 6) Alone: the proportion of 10-min focal animal samples during which the focal female did not interact with any other adult (male or female), nor were any adults found within 2 m of the focal female. 7) SDBs: the rate at which a female engaged in self-directed behaviors (self-grooming and self-scratching). 8) Submission: the rate at which a female submitted (fear grimace, lean, cower) to another female. Because low-ranking females have a greater number of individuals to which they can submit, i.e., they have a greater number of females that rank above them, we corrected each female’s submission rate for the proportion of females that ranked above her. 9) Aggression: the rate at which a female directed aggression (bites, grabs, lunges, chases, charges, threats) toward other females. Because high-ranking females have a greater number of individuals to which they can direct aggression, we corrected each female’s aggression rate for the proportion of females that ranked below her. Rates of all behaviors were calculated annually per female as the number of events per hour observed. We standardized behavioral measures by calculating z-scores for each female per group per year.
Genetic Data
We obtained pedigree data from the Caribbean Primate Research Center (CPRC) long-term database. This database contains maternal assignments based on census information, i.e., based on behaviors of putative mothers, such as lactation, for all individuals from the founding population onwards, as well as maternity and paternity based on analysis of 29 microsatellite markers for most macaques born since 1990 (ca. 2900 monkeys); details on genetic parentage analysis are found in Brent et al. (2013). Maternity based on genetic data was known for 105 individuals in our study (97.2%) and paternity for 87 individuals (80.5%). We used census information to determine maternal identity when genetic maternity was unknown (N = 3). In the population as a whole, there was 97.4% agreement between maternity based on census information and that based on genetic data. Missing paternity links could result in underestimation of additive genetic variance, although rates of paternity errors of 20% or less introduce few biases in genetic analyses (Charmantier et al. 2011). There is little evidence for high rates of inbreeding on Cayo Santiago (Blomquist 2009). Among subjects, there were 25 mother–daughter pairs but no full siblings; average r (SD) = 0.03(0.07) (Fig. 1).
Fig. 1.

Relatedness heatmaps for adult female rhesus macaques living on Cayo Santiago Island. Cells represent the coefficient of relatedness between all pairs of adult females in study group F in the first year of data collection (a) (N = 58), group F in the second year of data collection (b) (N = 66), group S (c) (N = 19) and group V (d) (N = 21). Females are arranged by decreasing dominance rank, with the highest ranking female in each group the upper left-hand corner. Pedigree information was included in all quantitative genetic and selection differential analyses. (a and b modified, with permission, from Brent et al. 2013.) This figure appears in full color in the online version of the journal.
Reproductive Output Data
We assessed the potential reproductive consequences of personality components using offspring survival and mean interbirth interval —both extracted from the pedigree— as measures of reproductive output. Offspring survival was calculated as the proportion of total infants produced that survived beyond 1 yr of age. Mean interbirth interval was calculated as the mean number of days between subsequent live births. For each measure, we calculated z-scores for each subject relative to the mean value for other females of the same age cohort (females born within 2–3 yr of one another). This allowed us to account for increases in the number of offspring produced as a function of age and to reduce the impact of censoring by adjusting reproductive output using females that were more likely to be of similar distance from the end of their reproductive careers. We included only offspring born before the year of behavioral data collection for each female. For females in group F with 2 yr of behavioral data available, we calculated only one value of reproductive output using offspring born before 2010, as parentage assignment had not yet been completed beyond this year. To assess the association between reproductive output and personality, we therefore only used the 2010 data for group F females. We included only females 8 yr of age or greater because younger females (6–7 yr of age) had rarely produced more than one infant and variance in reproductive output for these females was very low. The mean (SD) proportion of infants to survive to 1 yr was 0.81(0.21), while the mean interbirth interval was 487.01 (220.99) days (N = 75).
Statistical Analyses
We conducted all statistical analyses using R (version 2.13.1, R Foundation for Statistical Computing, R Development Core Team 2009). We used principal component analysis (PCA) to generate personality components using the principal function in the package “psych,” which employs an orthogonal varimax rotation. We used each female as an independent data point (N = 108), using the mean of the z-scores for females from group F in 2010 and 2011. When necessary, we log-transformed z-scores before PCA to improve their fit to a normal distribution. A constant was added so that each z-score value was >0 before transformation. We examined the scree plot and the very simple structure (VSS) fit to determine the appropriate number of components to extract from the PCA, selecting the number of components whose eigenvalues were close to or >1, for which there was not a considerable drop in eigenvalue from the preceding component in the scree plot, and which neared maximum complexity according to the VSS. We used the loadings of each component to generate personality scores for each individual female in each year (N = 164), removing females in cases where the strongly loaded behaviors were not applicable; e.g., by definition, the top ranked females in each group cannot approach an individual higher ranking than themselves and thus individual scores for the personality component for which approaches to higher ranking females loaded strongly was not calculated for the top ranked females.
To examine the repeatability and genetic effects of the personality components, we fit linear variance component models using the MCMCglmm package in R (Hadfield 2010). We have previously shown in this population that individuals are consistent across time in their position in their social network (Brent et al. 2013) —a property that may emerge, in part, from personality (Wilson et al. 2013). To test whether females were consistent from one year to the next in their personality components, we performed repeatability analyses in which female identity was included as a random effect in models in which the personality component of interest was the dependent variable. We then calculated repeatability as the ratio of individual-based variance to total variance (Nakagawa and Schielzeth 2010; Wilson et al. 2010). Repeated data were available only for group F females over a period of 2 yr, i.e. from data collected in 2010 and 2011. We fit models with only the intercept, as well as models that included dominance rank, age, and the presence of close kin as fixed effects. We defined close kin as mother–daughter pairs and maternal sisters. We report repeatability as posterior modes with 95% credible intervals.
Heritability models test the hypothesis that individuals that are closely related (and therefore share many genes) have more similar phenotypes than individuals who are unrelated, while controlling for similarities in phenotype that can be attributed instead to environmental, i.e., nongenetic, variance (Lynch and Walsh 1998; Visscher et al. 2008). We evaluated each personality component using a univariate variance component model that included permanent, i.e., individual-based, environmental effects as well as maternal effects (Almasy and Blangero 1998; Rogers et al. 2008). We modeled maternal effects as mother identity. Fixed effects were dominance rank, age, and the presence of close kin. The inclusion of fixed effects can inflate heritability estimates and can reduce comparability across studies (Wilson 2008). We therefore report the results of models that included only permanent environmental effects (intercept models) as well as those that included both maternal and fixed effects. We report posterior modes and credible intervals for heritability estimates. We considered heritabilities 10% or greater with reasonably narrow confidence intervals to be biological meaningful. For personality components with biologically meaningful heritability estimates, we calculated genetic correlations using bivariate variance components analyses (Lynch and Walsh 1998), including all random effects from heritability analyses.
We used univariate quadratic models to estimate selection differentials. We estimated linear selection (S) as the linear relationship between each personality component and reproductive output, and nonlinear selection (C) as the relationship between reproductive output and the orthogonal quadratic estimate of the personality component (Lande and Arnold 1983). We doubled posterior means of quadratic variables to estimate selection gradients correctly (Stinchcombe et al. 2008). Negative posterior means of quadratic variables represent evidence of stabilizing selection, positive posterior means represent disruptive selection. We included dominance rank, age, and presence of close kin as fixed effects, and individual identity, maternal identity, and genetic relatedness as random effects in all models. Including the relatedness matrix could swamp variance linking personality with fitness if the reproductive output variables were (also) heritable. We therefore also ran models that did not control for relatedness. The significance of the results of the two types of model did not differ (although estimates were consistently larger in the models that did not account for relatedness, as would be predicted), and we thus report only the results of models in which relatedness was controlled.
We ran all variance components models with a minimum of 65,000 iterations, with burn-in lengths varying from 15,000 to 100,000 depending on shape of the trace plot. We used the prior specification V = 1 and ν = 0.002, which is common for variance components (Hadfield 2010). Inclusion of maternal effects did not much improve the fit of the models, but we retained this factor in order to be conservative. We ran Gaussian-distributed models and performed graphical checks using Q–Q plots of each model once it was fully fit to confirm the appropriateness of a Gaussian distribution. In each plot, points are expected to fall along the diagonal line, with departures indicating a poor fit of the Gaussian GLMM (Elston et al. 2001; Wilk and Gnanadesikan 1968; Blomquist and Brent, this issue).
Ethical Note
This research complied with protocols approved by the Institutional Animal Care and Use Committee of the University of Puerto Rico (protocol #A6850108) and adhered to the legal requirements of the United States of America.
Results
PCA for Personality Components
Based on the selection parameters described earlier, we selected a model with six principal components (eigenvalues: PC1 = 1.89, PC2 = 1.67, PC3 = 1.16, PC4 = 1.02, PC5 = 0.96, PC6 = 0.87). This model accounted for 84.0% of the overall variance in the correlation matrix, with the proportion of variance explained by each component ranging between 21% and 10% (Table I). We then examined the loading of each behavior onto each component. Loadings >0.4 and those that differentiated the six components were considered of particular interest (Table I).
Table I.
Loadings of behaviors onto six principal “personality” components for adult female rhesus macaques living on Cayo Santiago Island
| Behavior | Component 1: Meek | Component 2: Bold | Component 3: Aggressive | Component 4: Passive | Component 5: Loner | Component 6: Nervous |
|---|---|---|---|---|---|---|
| Aggression/rank | 0.17 | 0.01 | 0.87 | −0.17 | 0.09 | 0.08 |
| Approach HR | −0.07 | 0.88 | −0.03 | −0.03 | 0.08 | −0.07 |
| Approach LR | 0.90 | 0.00 | 0.00 | −0.04 | −0.07 | −0.05 |
| Vocalise HR | −0.05 | 0.85 | 0.09 | 0.15 | −0.07 | 0.07 |
| Vocalise LR | −0.08 | 0.09 | 0.66 | 0.47 | −0.22 | 0.03 |
| Passive contact | 0.03 | 0.08 | −0.03 | 0.93 | 0.08 | 0.00 |
| Alone | −0.10 | 0.02 | −0.02 | 0.05 | 0.97 | −0.04 |
| SDBs | 0.04 | −0.01 | 0.08 | 0.01 | −0.04 | 0.99 |
| Submission/rank | 0.87 | −0.11 | 0.12 | 0.05 | −0.04 | 0.10 |
| Proportion variance explained | 0.21 | 0.19 | 0.13 | 0.11 | 0.11 | 0.10 |
HR = higher ranking; LR = lower ranking. Rates of aggression and submission given have been adjusted for dominance rank. Loadings >0.40 are highlighted in bold.
Individuals that scored high on component 1 (hereafter called “Meek” to facilitate discussion) approached lower ranking individuals more often than did other individuals and submitted to others the most frequently (Fig. 2). Individuals that scored high on component 2 (“Bold”) approached and vocalized to higher ranking individuals more frequently than did other individuals. Individuals that scored high on component 3 (“Aggressive”) directed the highest rates of aggression toward others (Fig. 2). These females also directed high rates of vocalizations toward lower raking individuals. Individuals that scored high on component 4 (“Passive”) spent the greatest amount of time in passive contact compared to other individuals, and frequently vocalized to lower ranking individuals. Individuals that scored high on component 5 (“Loner”) spent the greatest amounts of time alone compared to others. Finally, individuals that scored high on component 6 (“Nervous”) performed the highest frequency of self-directed behaviors (Fig. 2).
Fig. 2.
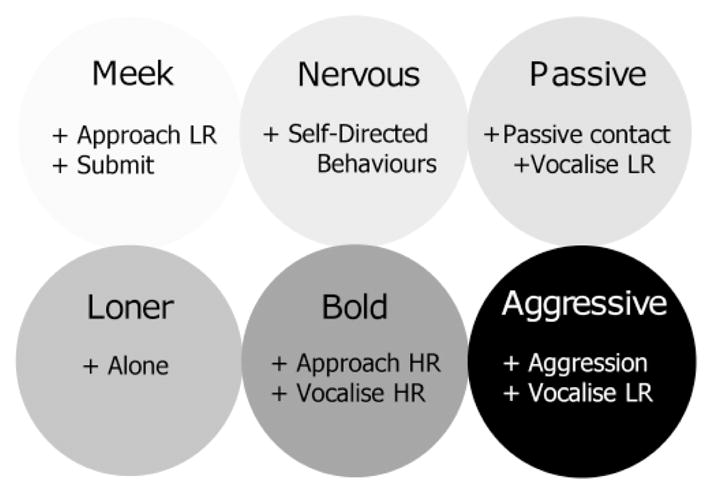
Personality components for female rhesus macaques living on Cayo Santiago Island based on PCA of behavioral data. The sign (+/−) of the relationships between behaviors is indicated as is the rank of the social partner relative to the subject (HR = higher-ranking; LR = lower-ranking).
Repeatability of Personality Components
There were interindividual differences in each of the personality components. Repeatability ranged from 0.219 to 0.662 with credible intervals >0 in all cases (Table II).
Table II.
Results of repeatability models with either fixed effects or an intercept only for adult female rhesus macaques living on Cayo Santiago Island
| Intercept model | Fixed effects model | |
|---|---|---|
| Meek | 0.662 (0.515, 0.802) | 0.553 (0.409, 0.762) |
| Bold | 0.476 (0.246, 0.608) | 0.279 (0.154, 0.438) |
| Aggressive | 0.331 (0.213, 0.513) | 0.388 (0.212, 0.508) |
| Passive | 0.328 (0.176, 0.493) | 0.305 (0.158, 0.479) |
| Loner | 0.315 (0.107, 0.498) | 0.341 (0.123, 0.497) |
| Nervous | 0.272 (0.113, 0.410) | 0.219 (0.107, 0.403) |
We report posterior modes and 95% credible intervals.
Potential Covariates of Personality Components
Dominance Rank
Scores on Meek and Bold were significantly related to dominance rank (Table III). High-ranking females had significantly higher scores than low-ranking females on Bold (N = 160, posterior mean = 0.0007, CI = 0.0005, 0.0009, P < 0.001), whereas low-ranking females had significantly higher scores than high-ranking females on Meek (N = 160, posterior mean = −0.0004, CI = −0.0006, −0.0002, P = 0.002). That is, high-ranking females had high scores on Bold but low scores on Meek (Fig. 3a and 3c).
Table III.
Results of heritability models with either a full set of fixed and maternal effects included, or only an intercept for adult female rhesus macaques living on Cayo Santiago Island
| Intercept model | h2 | Fixed and maternal effects model
|
|||||||||||
|---|---|---|---|---|---|---|---|---|---|---|---|---|---|
| h2 | VA | Ve | VA | Ve | Vm | Rank | Rank P | Age | Age P | Kin presence | Kin presence P | ||
| Meek | 0.346 (0.235, 0.574) | 0.001 | 0.001 | 0.311 (0.162, 0.490) | 0.0002 | 0.0005 | 0.0003 | −0.0004 | 0.002 | −0.002 | 0.006 | 0.01 | 0.220 |
| Bold | 0.301 (0.147, 0.495) | 0.0003 | 0.001 | 0.178 (0.111, 0.328) | 0.0002 | 0.001 | 0.0002 | 0.001 | <0.001 | −0.001 | 0.072 | 0.005 | 0.422 |
| Aggressive | 0.258 (0.147, 0.419) | 0.0002 | 0.0005 | 0.288 (0.163, 0.413) | 0.0002 | 0.0005 | 0.0002 | −0.000001 | 0.980 | −0.0004 | 0.452 | 0.01 | 0.244 |
| Passive | 0.241 (0.117, 0.374) | 0.0004 | 0.001 | 0.256 (0.111, 0.346) | 0.0002 | 0.001 | 0.0002 | 0.000003 | 0.793 | −0.001 | 0.187 | 0.016 | 0.040 |
| Loner | 0.144 (0.037, 0.309) | 0.0004 | 0.003 | 0.144 (0.097, 0.299) | 0.0005 | 0.003 | 0.0004 | 0.0002 | 0.500 | 0.0002 | 0.833 | −0.015 | 0.233 |
| Nervous | 0.220 (0.099, 0.336) | 0.0004 | 0.001 | 0.150 (0.090, 0.289) | 0.0002 | 0.001 | 0.0003 | −0.0002 | 0.182 | 0.000001 | 0.962 | −0.004 | 0.634 |
We report posterior means of the fixed effect coefficients, posterior modes for variance components (VA = genetic variance, Ve = permanent environmental variance, Vm = maternal variance), and posterior modes with 95% credible intervals for heritability (h2).
Fig. 3.

Relationships between the personality components and covariates dominance rank (% females dominated), age, and the presence of close kin in adult female rhesus macaques. Higher ranking females had significantly lower scores on Meek (a) and higher scores on Bold (c). Younger females had significantly higher scores on Meek (b), while females with close female kin present in their social group had higher scores on Passive than did females that did not have close kin present (d). Although related, these personality components were not redundant representations of rank, age, or the presence of close kin; the behaviors that loaded strongly onto these components continued to covary significantly when the impact of either rank, age, or the presence of close kin were taken into account.
Each of the behaviors that strongly loaded onto Bold and Meek were significantly related to dominance rank. High-ranking females approached and vocalised to females higher ranking (HR) than themselves at a higher rate than did low-ranking females (approach HR: β = 0.02, SE =0.003, χ2 = 54.34, P < 0.001; vocalize to HR: β = 0.013, SE = 0.003, χ2 = 22.59, P < 0.001). High-ranking females approached females lower ranking (LR) than themselves at a lower rate than did low-ranking females (approach LR: β = −0.01, SE =0.003, χ2 = 5.30, P = 0.021). Submission rates were calculated controlling for dominance rank, i.e., controlling for the divergence in the number of individuals than can be submitted to that exists between high-ranking (few individuals to submit to) and low-ranking (many individuals to submit to) females. Nevertheless, we found that high-ranking females submitted to others less frequently compared to low-ranking females (submit: β = −0.02, SE = 0.003, χ2 = 37.32, P < 0.001). However, none of these behavioral loadings onto Bold or Meek were solely artefacts of their relationships with dominance rank. We examined whether the behaviors in question continue to covary, as they did in the PCA, even when the impact of rank was removed. To do this, we took the residuals of the relationship between each behavior and dominance rank. We then examined the correlations between these residual values. There were significant correlations between the residuals of the behaviors that loaded strongly onto Bold (approach HR and vocalize HR: r2 = 0.658, SE = 15.626, P < 0.001), as well as between the residuals of the behaviors that loaded strongly onto Meek (approach LR and submit: r2 = 0.883, SE = 9.032, P < 0.001). Thus, females that scored high on the Bold component approached and vocalized to higher-ranking females at high rates, regardless of their rank. Females that scored high on the Meek component approached lower-ranking females and submitted to others at high rates, regardless of their rank.
Age
Age was a significant predictor of only one of the personality components, Meek (Table III). Older females had significantly lower scores on Meek than younger females (N = 160, posterior mean = −0.002, CI = −0.003, −0.005, P = 0.006) (Fig. 3b). Among the behaviors that strongly loaded onto Meek, the rate at which individuals approached lower-ranking females was not significantly related to age (β = −0.031, SE = 0.020, χ2 = 2.511, P = 0.113), nor was the rate at which females submitted to others related to age (β = −0.035, SE = 0.020, χ2 = 3.147, P = 0.076). The residuals of the relationships between these two behaviors and age were significantly correlated (r2 = 0.812, SE = 2.074, P < 0.001), suggesting their loading onto Meek was not simply an artefact of the impact of age.
Kin
The presence of close kin did not considerably influence personality components. Scores on Meek, Bold, Aggressive, Nervous, and Loner were not related to the availability of close kin (Table III). However, females with close kin present in the group did score higher on the Passive component than did females that did not have such kin present N = 160, posterior mean = 0.014, CI = 0.0002, 0.031, P = 0.04) (Fig. 3d). Of the two behaviors that loaded strongly onto Passive, only the amount of time spent in passive contact with others was significantly related to the availability of close kin: females with close kin present spent significantly more time in passive contact than females that did not have such kin present (β = 0.406, SE = 0.193 χ2 = 4.403, P = 0.036). However, time spent in passive contact and vocalizations to lower-ranking females correlated significantly when the impact of kin was removed (r2 = 0.876, SE = 0.152, P = < 0.001), suggesting their loading onto Passive was not simply an artefact of the relationship between passive contact and the availability of close kin.
Heritability of Personality Components
All six personality components demonstrated additive genetic variance >10% (Table III). In all cases, heritability estimates were not considerably different between models that included only the intercept compared to those that included fixed and maternal effects (Fig. 4). Heritability estimates of the personality components ranged from 0.144 (Loner) to 0.346 (Meek) in the intercept models and between 0.144 (Loner) and 0.311 (Meek) in the fixed effects models.
Fig. 4.

Posterior distributions of heritabilities of personality components for adult female rhesus macaques living on Cayo Santiago Island between 2007 and 2011. For comparison, plots represent heritabilities from intercept models as well as full fixed effect models. Posterior modes and credible intervals are given in Table III.
Genetic Correlations of Personality Components
None of the personality components appeared to be genetically correlated (Table IV). Bold and Aggressive, and Passive and Nervous had the largest correlation coefficients (−0.112 and −0.502, respectively) but the credible intervals for these values transversed zero (−0.287, 0.238; and −0.276, 0.254, respectively). Large credible intervals for all estimates of genetic collinearity in this study are indicative of a lack a power, owing to a relatively small sample size for analyses of genetic covariance in this study (Wilson et al. 2010).
Table IV.
Results of models testing for genetic correlations between personality components of adult female rhesus macaques living on Cayo Santiago Island
| Meek | Bold | Aggressive | Passive | Loner | Nervous | |
|---|---|---|---|---|---|---|
| Meek | — | 0.090 (−0.269, 0.277) | −0.036 (−0.310, 0.296) | 0.026 (−0.309, 0.285) | −0.050 (−0.270, 0.267) | 0.046 (−0.304, 0.234) |
| Bold | — | — | −0.112 (−0.287, 0.238) | −0.032 (−0.271, 0.310) | −0.072 (−0.319, 0.303) | −0.002 (−0254, 0.270) |
| Aggressive | — | — | — | −0.047 (−0.286, 0.244) | −0.024 (−0.254, 0.270) | |
| Passive | — | — | — | — | 0.041 (−0.263, 0.254) | −0.502 (−0.276, 0.254) |
| Loner | — | — | — | — | — | −0.050 (−0.314, 0.243) |
| Nervous | — | — | — | — | — | — |
We report posterior modes and 95% credible intervals.
Personality Components and Reproductive Output
Personality components were poor predictors of reproductive output in this study (Table V). We found no significant relationships between Meek, Bold, Aggressive, Passive, Loner, and Nervous and either infant survival or interbirth interval length.
Table V.
Selection differentials of personality components for adult female rhesus macaques living on Cayo Santiago Island
| Personality component | Infant survival
|
Interbirth interval
|
N | ||
|---|---|---|---|---|---|
| S | C | S | C | ||
| Meek | −0.548(0.890) | −0.002(0.324) | 7.144(0.236) | 1.046(0.766) | 73 |
| Bold | −0.013(0.128) | 0.946(0.138) | −0.252(0.764) | 16.736(0.796) | 73 |
| Aggressive | −0.045(0.160) | 0.032(0.156) | −0.024(0.542) | 1.892 (0.548) | 73 |
| Passive | 0.018(0.370) | −1.562(0.374) | 0.033(0.228) | −0.028(0.236) | 73 |
| Loner | −0.115(0.764) | 14.246(0.720) | −9.750(0.894) | 11.380(0.888) | 75 |
| Nervous | −4.055(0.964) | 1.742(0.998) | −0.419(0.702) | 0.384(0.718) | 75 |
Posterior means (P value) from quadratic regressions for linear (S) and stabilizing/disruptive (C) selection differentials performed using sample size N. We included dominance rank, age, and presence of close female kin as fixed effects and maternal identity as a random effect. We also controlled for genetic relatedness using a covariance matrix. Positive C values represent disruptive selection, negative values stabilizing selection. Interbirth interval (IBI) values have been inverted to aid with interpretation, that is, a positive relationship between a personality component and IBI indicates that females that scored high on this component had shorter IBIs.
Discussion
We analyzed data on spontaneously occurring behaviors in a free-ranging population of female rhesus macaques and found evidence for six distinct personality components: Meek, Bold, Aggressive, Passive, Loner, and Nervous. Our findings indicate that these personality components were not associated with reproductive output. However, each of these components did have a heritable basis. Studies in a growing number of taxa have provided evidence that some of the intraindividual variation in personality can be explained by genetic elements that are inherited from one generation to the next (Bize et al. 2012; Sinn et al. 2006; van Oers et al. 2004). In our study, female rhesus macaques varied in their tendency to approach females lower ranking than themselves and to submit to others relative to their own dominance rank, and results indicated that this personality component (Meek) had a narrow-sense heritability of 35% in the intercept model. Some females conversely tended to approach individuals higher ranking than themselves and also vocalised to them (Bold), and heritability of this component was 30% in the intercept model. Aggressive tendencies (Aggressive), as well as the tendencies to spend time in passive contact with others (Passive), and to spend time alone (Loner), had a heritability estimates of 26%, 24%, and 14%, respectively. Finally, females’ tendency to exhibit self-directed behaviors (Nervous), a sign of anxiety in primates (Schino et al. 1996), had a heritability score in the intercept model of 20%.
The heritabilities found in this study are similar to those reported for personality traits in other nonhuman primates, which have generally ranged from 25 to 60% (Fairbanks et al. 2004; Weiss et al. 2000, 2002; Williamson et al. 2003). Human studies tend to report heritability of personality traits at about 50% (Bouchard and Loehlin 2001; Johnson et al. 2008). However, most of these reports are based on twin studies and therefore represent broad-, instead of narrow-sense, heritabilities. Studies of humans subjects from complex pedigrees —similar to those commonly used in studies of nonhuman primates, including the current study— have found narrow-sense heritability of personality traits to be closer to 20% (Pilia et al. 2006). Candidates for the functional basis of these primate personality components include polymorphic genes in the major neuromodulatory pathways, e.g., serotonin, dopamine, oxytocin, as well as other systems associated with behavioral regulation, e.g., the hypothalamic–pituitary–adrenal (HPA) and hypothalamic–pituitary–gonadal (HPG) axes. Future exploration of functional gene candidates underlying phenotypic variation may add to our understanding of the proximate bases of these personality components.
Overall, personality was a not a very good predictor of reproductive output in the female rhesus macaques in this study. In female chacma baboons (Papio hamadryas ursinus), whose social system is very similar to that of rhesus macaques, Seyfarth et al. (2012) inferred a positive (and linear) relationship between personality and reproductive success. This inference was based on their finding of a significant positive association between three dimensions of baboon personality, referred to as Aloof, Nice, and Loner, and indices representing the strength and stability of social bonds (Seyfarth et al. 2012), which have been previously positively associated with increased fitness (whether these indices of social bonding should themselves be considered personality dimensions warrants future discussion). Although they were poor predictors of infant survival and interbirth interval length in the current study, Meek and Bold were significantly related to dominance rank. Dominance rank has previously been shown to be a predictor of reproductive success in primates (Majolo et al. 2012). The behaviors that loaded strongly onto Meek and Bold continued to covary significantly when the impact of rank was taken into account, suggesting the loadings of these behaviors, and thus the personality components themselves, were not simply artefacts of rank. Further research is required to clarify the causal relationship (if any) between personality and social status.
Previous work on the genetic basis of social networks in this population revealed that the tendency of adult males and females to direct aggression toward others (aggression outstrength) was heritable and that individuals with the highest and lowest aggression outstrength scores also had the greatest infant survival, i.e., there was evidence for disruptive selection of this network position (Brent et al. 2013). Although in the current study the personality component Aggression represented females’ tendencies to direct aggression toward others, we found no evidence that this trait was significantly associated with either the length of females’ interbirth intervals or the survival of their infants. Disparity between the findings of Brent et al. (2013) and those of the current study may be due to methodological differences; the current study examined only females, while Brent et al. (2013) included data on both males and females. In addition, the behavioral measures examined in the two studies were related, but differed in two key ways. First, in the current study, the rate of aggression directed toward others loaded strongly onto the Aggressive component, but other behaviors were also incorporated into its calculation, e.g., vocalizations to lower ranking individuals also loaded strongly onto this component, whereas in Brent et al. (2013) aggression outstrength was simply calculated as the rate of aggression directed to other adults. Second, dominance rank was controlled for differently in the two studies; it was incorporated directly into the measure of aggression used in the current study, while Brent et al. (2013) included dominance rank as a potential covariate in statistical models.
Regardless, the absence of an association between personality and reproductive output may suggest that personality does not have fitness-related consequences in this population but might also indicate that selection has acted to reduce fitness-associated variation in personality. Nuanced contextual differences in the relationship between personality and reproductive success may also exist but at a scale not detectable by the current study. In a meta-analysis of results reported in the literature on a variety of taxa, Smith and Blumstein (2008) found that individuals classified as closer to Bold on the Shy–Bold continuum had higher reproductive success. This relationship was particularly strong in males. However, bolder males also incurred a survival cost, suggesting the maintenance of variation in this trait may be due to trade-offs in fitness consequences in different contexts (Smith and Blumstein 2008). Unfortunately, the way in which context affects the impacts of personality on fitness are highly challenging to examine in animals with long life spans and gestation lengths (Krause et al. 2010).
The personality components examined in chacma baboons by Seyfarth et al. (2012) were generated by examining many of the same spontaneously occurring behaviors as those examined in the present study (time spent alone, aggression, physical contact with others, and interactions directed toward higher and lower ranking females). Indeed, there were some similarities between the personality components that emerged in female chacma baboons and rhesus macaques; vocalizations to lower ranking females loaded onto a component with time spent in passive contact in both species (baboons: Nice; macaques: Passive). Therefore, baboon and rhesus macaque females that tended to spend time in passive contact with others also tended to vocalize to lower ranking females. In baboons, aggression loaded positively with the tendency to vocalize to higher ranking females, and negatively with the tendency to vocalise to lower ranking females (Aloof), whereas in rhesus macaques aggression loaded positively onto a component with the tendency to vocalise to lower ranking females (Aggressive). Finally, time spent alone and the tendency to interact with lower ranking females loaded strongly onto a component in baboons (Loner), whereas time spent alone loaded onto its own component in rhesus macaques (Loner).
As the number of studies of animal personality grows, it will become increasingly important to establish how personality components generated using the most commonly employed methods relate to each other. There is evidence to suggest that ratings from human observers correlate with spontaneously occurring behaviors (Capitanio 1999; Konečná et al. 2008; Uher and Asendorpf 2008). Yet, the relationships between human ratings, experimental assays, and personality components generated using spontaneous behaviors (such as in this study) are less clear. The patterning of results based on a bottom-up behavioral approach to personality must also be explored in specific, divergent, contexts (Uher and Asendorpf 2008).
The personality components generated in the current study did show some promising similarities to those previously produced in this population of rhesus macaques using human-observer ratings (Weiss et al 2011). Weiss et al. (2011) used such ratings to identify six personality components in male and female rhesus macaques on Cayo Santiago: Confidence, Openness, Dominance, Friendliness, Activity, and Anxiety. According to Weiss et al. (2011), Confident rhesus macaques were less vigilant and less reactive to stressors, which may be analogous to the component we called Bold, i.e., monkeys that were likely to interact with those higher ranking than themselves. Weiss et al. (2011) reported that individuals with low scores on the Openness dimension were less impulsive and exploratory, which may be analogous to the Meek component in the present study, while individuals that were high scoring on the Dominance dimension demonstrated aggressive tendencies, similar to Aggressive females in the current study. Weiss et al. (2011) deemed rhesus macaques with high scores on Friendliness to be highly social and not solitary. This may bear similarities to our Loner component, for which low scoring individuals spent little time alone, as well as to our Passive component, for which high scoring individuals spent a large amount of time in passive contact with others and vocalized frequently. Individuals with high scores on the Anxiety dimension of Weiss et al. were anxious and distressed, similar to our Nervous component, in which high scoring individuals exhibited high rates of self-directed behaviors. Finally, Weiss et al. (2011) identified the personality dimension Activity and described monkeys with high scores on it as playful and spontaneous. Although we found no analogous component using spontaneously occurring behaviors, Active/Slow was identified in another study of (captive) rhesus macaques that used human observer ratings to assess personality (Stevenson-Hinde and Zunz 1978). This may suggest that the behaviors included in the current study, which were for the most part socially relevant rather than activity based, may not have been well suited to extract this particular dimension.
Genetic covariance between traits suggests that similar genes underlie their expression and may constrain their phenotypic distributions (Arnold et al. 2001; Lande 1979). Traits must also genetically covary with fitness in order for selection to result in changes to their distributions (Morrissey et al. 2010; Price et al. 1988; Robertson 1966). Unfortunately, the sample sizes required to detect genetic correlations are large enough to prevent their examination in the majority of research on large-bodied animals. In the current study, we found no evidence for genetic collinearity between personality components but were underpowered to do so. Examining genetic correlations between personality components, and between personality components and fitness, is a clear direction for future research.
When interpreting the results of this study, it should be noted that heritability scores are dependent on the study population because both additive and nonadditive genetic variance, as well as environmental variance, are population specific (Falconer and Mackay 1996; Visscher et al. 2008). Future studies of the genetic basis of personality in different physical and social environments are therefore required in rhesus macaques, as well as in other species of nonhuman primates. In addition, studies following individuals throughout their development, e.g., from juveniles to adulthood, could help to disentangle the influence of maternal behavior on personality, as could studies that incorporate nonadditive genetic variance, such as epigenetic effects and gene × environment interactions (Feil and Fraga 2012; Suomi 2006). Work of this kind will shed important new light on the evolution of personality in both nonhuman and human primates.
Acknowledgments
We thank Bonn Aure, Jacqueline Buhl, Monica Carlson, Sam Larson, Elizabeth Maldonado, Heather Sherwin, and the Cayo Santiago Staff for research support. We thank Greg Blomquist and John Pearson for statistical advice and assistance, and Amanda Melin and two anonymous reviewers for helpful comments on the manuscript. The authors were supported by NIMH grants R01-MH089484 and R01-MH096875, an Incubator Award from the Duke Institute for Brain Sciences. L. J. N. Brent was supported by fellowships from the Natural Sciences and Engineering Research Council of Canada (NSERC), the University of Roehampton, and the Duke Center for Interdisciplinary Decision Sciences. The CPRC is supported by grant 8-P40 OD012217-25 from the National Center for Research Resources (NCRR) and the Office of Research Infrastructure Programs (ORIP) of the National Institutes of Health.
Contributor Information
Lauren J. N. Brent, Duke Institute for Brain Sciences and Center for Cognitive Neuroscience, Duke University, Durham, North Carolina 27708; and Centre for Research in Evolutionary and Environmental Anthropology, University of Roehampton, London, U.K
Stuart Semple, Centre for Research in Evolutionary and Environmental Anthropology, University of Roehampton, London, U.K.
Ann MacLarnon, Email: lauren.brent@duke.edu, Centre for Research in Evolutionary and Environmental Anthropology, University of Roehampton, London, U.K.
Angelina Ruiz-Lambides, Caribbean Primate Research Center, University of Puerto Rico, Medical Sciences Campus, Punta Santiago, PR.
Janis Gonzalez-Martinez, Caribbean Primate Research Center, University of Puerto Rico, Medical Sciences Campus, Punta Santiago, PR.
Michael L. Platt, Duke Institute for Brain Sciences and Center for Cognitive Neuroscience; and Departments of Neurobiology, Evolutionary Anthropology, and Psychology & Neuroscience, Duke University, Durham, North Carolina 27708
References
- Adams MJ, King JE, Weiss A. The majority of genetic variation in orangutan personality and subjective well-being is nonadditive. Behavior Genetics. 2012;42:675–686. doi: 10.1007/s10519-012-9537-y. [DOI] [PubMed] [Google Scholar]
- Almasy L, Blangero J. Multipoint quantitative-trait linkage analysis. American Journal of Human Genetics. 1998;62:1198–1211. doi: 10.1086/301844. [DOI] [PMC free article] [PubMed] [Google Scholar]
- Arnold S, Pfrender M, Jones A. The adaptive landscape as a conceptual bridge between micro- and macroevolution. Genetica. 2001;112–113:9–32. [PubMed] [Google Scholar]
- Bakker TCM. Aggressiveness in sticklebacks (Gasterosteus aculeatus L.): A behaviour-genetic study. Behaviour. 1986;98:1–144. [Google Scholar]
- Bize P, Diaz C, Lindström J. Experimental evidence that adult antipredator behaviour is heritable and not influenced by behavioural copying in a wild bird. Proceedings of the Royal Society B: Biological Sciences. 2012;279:1380–1388. doi: 10.1098/rspb.2011.1789. [DOI] [PMC free article] [PubMed] [Google Scholar]
- Blomquist GE. Fitness-related patterns of genetic variation in rhesus macaques. Genetica. 2009;135:209–219. doi: 10.1007/s10709-008-9270-x. [DOI] [PubMed] [Google Scholar]
- Bouchard TJ, Jr, Loehlin JC. Genes, evolution, and personality. Behavior Genetics. 2001;31(3):243–273. doi: 10.1023/a:1012294324713. [DOI] [PubMed] [Google Scholar]
- Brent LJN. PhD Thesis. University of Roehampton; 2010. Investigating the causes and consequences of sociality in adult female rhesus macaques using a social network approach. [Google Scholar]
- Brent LJN, Heilbronner SR, Horvath JE, Gonzalez-Martinez J, Ruiz-Lambides A, Robinson AG, et al. Genetic origins of social networks in rhesus macaques. Scientific Reports. 2013 doi: 10.1038/srep01042. [DOI] [PMC free article] [PubMed] [Google Scholar]
- Brent LJN, MacLarnon A, Platt ML, Semple S. Seasonal changes in the structure of rhesus macaque social networks. Behavioral Ecology and Sociobiology. 2013;67:349–359. doi: 10.1007/s00265-012-1455-8. [DOI] [PMC free article] [PubMed] [Google Scholar]
- Capitanio JP. Personality dimensions in adult male rhesus macaques: Prediction of behaviors across time and situation. American Journal of Primatology. 1999;47:299–320. doi: 10.1002/(SICI)1098-2345(1999)47:4<299::AID-AJP3>3.0.CO;2-P. [DOI] [PubMed] [Google Scholar]
- Charmantier A, Buoro M, Gimenez O, Weimerskirch H. Heritability of short-scale natal dispersal in a large-scale foraging bird, the wandering albatross. Journal of Evolutionary Biology. 2011;24:1487–1496. doi: 10.1111/j.1420-9101.2011.02281.x. [DOI] [PubMed] [Google Scholar]
- Chikazawa D, Gordon TP, Bean CA, Bernstein IS. Mother-daughter dominance reversals in rhesus monkeys (Macaca mulatta) Primates. 1979;20:301–305. [Google Scholar]
- Cloninger CR, Przybeck TR, Svrakic DM. The Tridimensional Personality Questionnaire: United States normative data. Psychological Reports. 1991;69:1047–1057. doi: 10.2466/pr0.1991.69.3.1047. [DOI] [PubMed] [Google Scholar]
- Cords M. The behavior, ecology and social evolution of Cercopithecine monkeys. In: Mitani JC, Call J, Kappeler PM, Palombit RA, Silk JB, editors. The evolution of primate societies. Chicago: University of Chicago Press; 2012. pp. 91–112. [Google Scholar]
- Datta S. The acquisition of dominance among free-ranging rhesus monkey siblings. Animal Behaviour. 1988;36:754–772. [Google Scholar]
- Dingemanse NJ, Both C, Drent PJ, Tinbergen JM. Fitness consequences of avian personalities in a fluctuating environment. Proceedings of the Royal Society of London B: Biological Sciences. 2004;271:847–852. doi: 10.1098/rspb.2004.2680. [DOI] [PMC free article] [PubMed] [Google Scholar]
- Dingemanse NJ, Both C, Drent PJ, Van Oers K, Van Noordwijk AJ. Repeatability and heritability of exploratory behaviour in great tits from the wild. Animal Behaviour. 2002;64:929–938. [Google Scholar]
- Dochtermann NA, Roff DA. Applying a quantitative genetics framework to behavioural syndrome research. Philosophical Transactions of the Royal Society B: Biological Sciences. 2010;365:4013–4020. doi: 10.1098/rstb.2010.0129. [DOI] [PMC free article] [PubMed] [Google Scholar]
- Elston DA, Moss R, Boulinier T, Arrowsmith C, Lambin X. Analysis of aggregation, a worked example: Numbers of ticks on red grouse chicks. Parasitology. 2001;122:563–569. doi: 10.1017/s0031182001007740. [DOI] [PubMed] [Google Scholar]
- Endler JA. Natural selection in the wild. Princeton, NJ: Princeton University Press; 1986. [Google Scholar]
- Fairbanks LA, Newman TK, Bailey JN, Jorgensen MJ, Breidenthal SE, Ophoff RA, et al. Genetic contributions to social impulsivity and aggressiveness in vervet monkeys. Biological Psychiatry. 2004;55(6):642–647. doi: 10.1016/j.biopsych.2003.12.005. [DOI] [PubMed] [Google Scholar]
- Falconer DS, Mackay TFC. Introduction to quantitative genetics. New York: Longman; 1996. [Google Scholar]
- Feil R, Fraga MF. Epigenetics and the environment: Emerging patterns and implications. Naure Reviews: Genetics. 2012;13:97–109. doi: 10.1038/nrg3142. [DOI] [PubMed] [Google Scholar]
- Fisher RA. The genetical theory of natural selection. Oxford: Clarendon Press; 1930. [Google Scholar]
- Gosling SD, Lilienfeld SO, Marino L. Personality. In: Maestripieri D, editor. Primate psychology. Cambridge, MA: Harvard University Press; 2003. pp. 254–288. [Google Scholar]
- Hadfield J. MCMC methods for multi-response generalised linear mixed models: The MCMCglmm R package. Journal of Statistical Software. 2010;33:1–22. [Google Scholar]
- Hadidian J, Bernstein IS. Female reproductive cycles and birth data from an Old World monkey colony. Primates. 1979;20:429–442. [Google Scholar]
- Johnson AM, Vernon PA, Feiler AR. Behavioral genetic studies of personality: An introduction and review of the results of 50+ years of research. In: Boyle G, Matthews G, Saklofske D, editors. Handbook of personality theory and assessment. London: SAGE; 2008. pp. 145–173. [Google Scholar]
- Konečná M, Lhota S, Weiss A, Urbánek T, Adamová T, Pluháček J. Personality in free-ranging Hanuman langur (Semnopithecus entellus) males: Subjective ratings and recorded behavior. Journal of Comparative Psychology. 2008;122:379–389. doi: 10.1037/a0012625. [DOI] [PubMed] [Google Scholar]
- Kralj-Fiser S, Weiss BM, Kotrschal K. Behavioural and physiological correlates of personality in greylag geese (Anser anser) Journal of Ethology. 2010;28:363–370. [Google Scholar]
- Krause J, James R, Croft DP. Personality in the context of social networks. Philosophical Transactions of the Royal Society B: Biological Sciences. 2010;365:4099–4106. doi: 10.1098/rstb.2010.0216. [DOI] [PMC free article] [PubMed] [Google Scholar]
- Lande R. Quantitative genetic analysis of multivariate evolution, applied to brain: Body size allometry. Evolution. 1979:402–416. doi: 10.1111/j.1558-5646.1979.tb04694.x. [DOI] [PubMed] [Google Scholar]
- Lande R, Arnold SJ. The measurement of selection on correlated characters. Evolution. 1983;37(6):1210–1226. doi: 10.1111/j.1558-5646.1983.tb00236.x. [DOI] [PubMed] [Google Scholar]
- Lynch M, Walsh B. Genetics and analysis of quantitative traits. Sunderland, MA: Sinauer Associates; 1998. [Google Scholar]
- Majolo B, Lehmann J, Vizioli AD, Schino G. Fitness-related benefits of dominance in primates. American Journal of Physical Anthropology. 2012;147:652–660. doi: 10.1002/ajpa.22031. [DOI] [PubMed] [Google Scholar]
- McCrae RR, Costa PT. A five-factor theory of personality. In: Pervin LA, John OP, editors. Handbook of personality: Theory and research. 2. New York: Guilford Press; 1999. pp. 139–153. [Google Scholar]
- Morrissey M, Kruuk L, Wilson A. The danger of applying the breeder’s equation in observational studies of natural populations. Journal of Evolutionary Biology. 2010;23:2277–2288. doi: 10.1111/j.1420-9101.2010.02084.x. [DOI] [PubMed] [Google Scholar]
- Nakagawa S, Schielzeth H. Repeatability for Gaussian and non-Gaussian data: A practical guide for biologists. Biological Reviews of the Cambridge Philosophical Society. 2010;85:935–956. doi: 10.1111/j.1469-185X.2010.00141.x. [DOI] [PubMed] [Google Scholar]
- Pilia G, Chen WM, Scuteri A, Orrú M, Albai G, Dei M, et al. Heritability of cardiovascular and personality traits in 6,148 Sardinians. PLoS Genet. 2006;2:e132. doi: 10.1371/journal.pgen.0020132. [DOI] [PMC free article] [PubMed] [Google Scholar]
- Price T, Kirkpatrick M, Arnold S. Directional selection and the evolution of breeding date in birds. Science. 1988;240:798–799. doi: 10.1126/science.3363360. [DOI] [PubMed] [Google Scholar]
- Rawlings RG, Kessler MJ, editors. The Cayo Santiago macaques. Albany: State University of New York Press; 1986. [Google Scholar]
- Reale D, Festa-Bianchet M. Predator-induced natural selection on temperament in bighorn ewes. Animal Behaviour. 2003;65:463–470. doi: 10.1006/anbe.2000.1530. [DOI] [PubMed] [Google Scholar]
- Robertson A. A mathematical model of the culling process in dairy cattle. Animal Production. 1966;8:108. [Google Scholar]
- Rogers J, Shelton SE, Shelledy W, Garcia R, Kalin NH. Genetic influences on behavioral inhibition and anxiety in juvenile rhesus macaques. Genes Brain and Behavior. 2008;7:463–469. doi: 10.1111/j.1601-183X.2007.00381.x. [DOI] [PMC free article] [PubMed] [Google Scholar]
- Schino G, Perretta G, Taglioni AM, Monaco V, Troisi A. Primate displacement activities as an ethopharmacological model of anxiety. Anxiety. 1996;2:186–191. doi: 10.1002/(SICI)1522-7154(1996)2:4<186::AID-ANXI5>3.0.CO;2-M. [DOI] [PubMed] [Google Scholar]
- Seyfarth RM, Silk JB, Cheney DL. Variation in personality and fitness in wild female baboons. Proceedings of the National Academy of Sciences. 2012;109:16980–16985. doi: 10.1073/pnas.1210780109. [DOI] [PMC free article] [PubMed] [Google Scholar]
- Sih A, Bell AM, Johnson JC, Ziemba RE. Behavioral syndromes: An integrative overview. Quarterly Review of Biology. 2004;79:241–277. doi: 10.1086/422893. [DOI] [PubMed] [Google Scholar]
- Sinn DL, Apiolaza LA, Moltschaniwskyj NA. Heritability and fitness-related consequences of squid personality traits. Journal of Evolutionary Biology. 2006;19:1437–1447. doi: 10.1111/j.1420-9101.2006.01136.x. [DOI] [PubMed] [Google Scholar]
- Smith BR, Blumstein DT. Fitness consequences of personality: A meta-analysis. Behavioral Ecology. 2008;19:448–455. [Google Scholar]
- Stevenson-Hinde J, Zunz M. Subjective assessment of individual rhesus macaques. Primates. 1978;19:473–482. [Google Scholar]
- Stinchcombe JR, Agrawal AF, Hohenlohe PA, Arnold SJ, Blows MW. Estimating nonlinear selection gradients using quadratic regression coefficients: Double or nothing ? Evolution. 2008;62:2435–2440. doi: 10.1111/j.1558-5646.2008.00449.x. [DOI] [PubMed] [Google Scholar]
- Suomi SJ. Risk, resilience, and gene × environment interactions in rhesus monkeys. Annals of the New York Academy of Sciences. 2006;1994:52–62. doi: 10.1196/annals.1376.006. [DOI] [PubMed] [Google Scholar]
- Taylor RW, Boon AK, Dantzer B, Reale D, Humphries MM, Boutin S, et al. Low heritabilities, but genetic and maternal correlations between red squirrel behaviours. Journal of Evolutionary Biology. 2012;25:614–624. doi: 10.1111/j.1420-9101.2012.02456.x. [DOI] [PubMed] [Google Scholar]
- Thierry B. Social epigenesis. In: Thierry B, Singh M, Kaumanns W, editors. Macaque societies: A model for the study of social organization. Cambridge, U.K: Cambridge University Press; 2004. pp. 267–290. [Google Scholar]
- Uher J, Asendorpf JB. Personality assessment in the Great Apes: Comparing ecologically valid behavior measures, behavior ratings, and adjective ratings. Journal of Research in Personality. 2008;42:821–838. [Google Scholar]
- van Oers K, de Jong G, van Noordwijk AJ, Kempenaers B, Drent PJ. Contribution of genetics to the study of animal personalities: A review of case studies. Behaviour. 2005;142:1185–1206. [Google Scholar]
- van Oers K, Drent PJ, de Goede P, van Noordwijk AJ. Realized heritability and repeatability of risk-taking behaviour in relation to avian personalities. Proceedings of the Royal Society of London B: Biological Sciences. 2004;271:65–73. doi: 10.1098/rspb.2003.2518. [DOI] [PMC free article] [PubMed] [Google Scholar]
- van Oers K, Mueller JC. Evolutionary genomics of animal personality. Philosophical Transactions of the Royal Society of London B: Biological Sciences. 2010;365:3991–4000. doi: 10.1098/rstb.2010.0178. [DOI] [PMC free article] [PubMed] [Google Scholar]
- Visscher PM, Hill WG, Wray NR. Heritability in the genomics era: concepts and misconceptions. Nature Reviews: Genetics. 2008;9:255–266. doi: 10.1038/nrg2322. [DOI] [PubMed] [Google Scholar]
- Weiss A, King JE, Enns RM. Subjective well-being is heritable and genetically correlated with dominance in chimpanzees (Pan troglodytes) Journal of Personality and Social Psychology. 2002;83:1141–1149. [PubMed] [Google Scholar]
- Weiss A, King JE, Figueredo AJ. The heritability of personality factors in chimpanzees (Pan troglodytes) Behavior Genetics. 2000;30:213–221. doi: 10.1023/a:1001966224914. [DOI] [PubMed] [Google Scholar]
- Wilk MB, Gnanadesikan R. Probability plotting methods for the analysis for the analysis of data. Biometrika. 1968;55:1–17. [PubMed] [Google Scholar]
- Williamson DE, Coleman K, Bacanu SA, Devlin BJ, Rogers J, Ryan ND, et al. Heritability of fearful-anxious endophenotypes in infant rhesus macaques: A preliminary report. Biological Psychiatry. 2003;53:284–291. doi: 10.1016/s0006-3223(02)01601-3. [DOI] [PubMed] [Google Scholar]
- Wilson A, Reale D, Clements MN, Morrissey MM, Postma E, Walling CA, et al. An ecologist’s guide to the animal model. Journal of Animal Ecology. 2010;79:13–26. doi: 10.1111/j.1365-2656.2009.01639.x. [DOI] [PubMed] [Google Scholar]
- Wilson ADM, Krause S, Dingemanse NJ, Krause J. Network position: A key component in the characterization of social personality types. Behavioral Ecology and Sociobiology. 2013;67:163–173. [Google Scholar]
- Wilson AJ. Why h(2) does not always equal V-A/V-P? Journal of Evolutionary Biology. 2008;21:647–650. doi: 10.1111/j.1420-9101.2008.01500.x. [DOI] [PubMed] [Google Scholar]
- Wilson DS, Clark AB, Coleman K, Dearstyne T. Shyness and boldness in humans and other animals. Trends in Ecology & Evolution. 1994;9:442–446. doi: 10.1016/0169-5347(94)90134-1. [DOI] [PubMed] [Google Scholar]
- Wolf M, Weissing FJ. Animal personalities: consequences for ecology and evolution. Trends in Ecology & Evolution. 2012;27:452–461. doi: 10.1016/j.tree.2012.05.001. [DOI] [PubMed] [Google Scholar]