Abstract
Background
U.S. Child Welfare systems are involved in the lives of millions of children, and total spending exceeds $26 billion annually. Out-of-home foster care is a critical and expensive Child Welfare service, a major component of which is the maintenance rate paid to support housing and caring for a foster child. Maintenance rates vary widely across states and over time, but reasons for this variation are not well understood. As evidence-based programs are disseminated to state Child Welfare systems, it is important to understand what may be the important drivers in the uptake of these practices including state spending on core system areas.
Data and methods
We assembled a unique, longitudinal, state-level panel dataset (1990–2008) for all 50 states with annual data on foster care maintenance rates and measures of child population in need, poverty, employment, urbanicity, proportion minority, political party control of the state legislature and governorship, federal funding, and lawsuits involving state foster care systems. All monetary values were expressed in per-capita terms and inflation adjusted to 2008 dollars. We used longitudinal panel regressions with robust standard errors and state and year fixed effects to estimate the relationship between state foster care maintenance rates and the other factors in our dataset, lagging all factors by one year to mitigate the possibility that maintenance rates influenced their predictors. Exploratory analyses related maintenance rates to Child Welfare outcomes.
Findings
State foster care maintenance rates have increased in nominal terms, but in many states, have not kept pace with inflation, leading to lower real rates in 2008 compared to those in 1991 for 54% of states for 2 year-olds, 58% for 9 year-olds, and 65% for 16 year-olds. In multivariate analyses including socioeconomic, demographic, and political factors, monthly foster care maintenance rates declined $15 for each 1% increase in state unemployment and declined $40 if a state's governorship and legislature became Republican, though significance was marginal. In analyses also examining state revenue, federal funding, and legal challenges, maintenance rates increased as the federal share of maximum TANF payments increased. However, >50% of variation in foster care maintenance rates was explained by unobserved state-level factors as measured by state fixed effects. These factors did not appear to be strongly related to 2008 Child Welfare outcomes like foster care placement stability and maltreatment which were also not correlated with foster care maintenance rates.
Conclusions
Despite being part of a social safety net, foster care maintenance rates have declined in real terms since 1991 in many states, and there is no strong evidence that they increase in response to harsher economic climates or to federal programs or legal reviews. State variation in maintenance rates was not related to Child Welfare outcomes, though further analysis of this important relationship is needed. Variability in state foster care maintenance rates appears highly idiosyncratic, an important contextual factor to consider when designing and disseminating evidence-based services.
Keywords: Foster care maintenance rates, States, Socio-demographic, Economic, Political, Spending
1. Introduction
U.S. Child Welfare systems serve millions of children with costs exceeding $26 billion annually. Out-of-home care is one of the most important and expensive services provided. A major component of the cost of this care is the maintenance rate paid to support housing and caring for a child. Maintenance rates vary substantially across states and over time. Given limited budgets, maintenance rate variation is likely to affect state Child Welfare agencies' ability to recruit and retain foster parents and to implement efficacious programs to serve these children. Factors affecting sustained funding for existing services like foster care maintenance rates are also likely important contextual factors for sustaining the implementation of new evidence-based programs (Aarons, Hurlburt, & Horwitz, 2011).
Why states differ so greatly in the foster care maintenance rates that they pay is unknown and may depend on multiple factors suggested by economic and political theory. For example, during economic downturns, reduced tax revenues may necessitate reductions in spending (Alt & Lowry, 1994; Bohn & Inman, 1996; Poterba, 1994), including reductions in foster care maintenance rates. Similarly, payment rates may fluctuate depending on the political party in control in a state (Kousser, 2002). Targeted federal funding could increase maintenance rates as could federal or judicial reviews that make future funding contingent on target outcomes (Baicker, 2001; The Lewin Group, 2004). Past studies considering Medicaid and Temporary Assistance for Needy Families (TANF) show that state social service spending decisions are driven by a host of political and economic factors with more generous spending linked to liberal political ideology or interest group pressure (Barrilleaux & Miller, 1988; Grogan, 1994; Hanson, 1984; Jacoby & Schneider, 2001; Plotnick & Winters, 1985). Research also shows that state spending is related to state capacity and demand (Grannemann, 1980; Jacoby & Schneider, 2001; Plotnick & Winters, 1985). Given that the same or similar institutions and actors are involved in setting policy for Child Welfare programs, we hypothesize that many of the same mechanisms operate for Child Welfare decisions. To our knowledge, this is the first study that examines what factors influence Child Welfare spending nationally over time.
Understanding factors that drive changes in the maintenance rates that support housing and care for these very vulnerable children is valuable for a number of reasons. First, it sheds light on how the systems respond to economic downturns such as the one beginning in 2008. Second, given the importance of contextual factors in implementation theory, it is critical for planning implementation of new evidence based programs within the existing foster care system that require sustained state funding over multiple years (Goldhaber-Fiebert, Bailey, et al., 2011; Goldhaber-Fiebert, Snowden, Wulczyn, Landsverk, & Horwitz, 2011).
This study was designed to examine three questions: 1) How have state foster care maintenance rates changed over time? 2) Do sociodemographic, economic, political, state revenue, federal funding, federal program, and legal challenges explain changes in foster care maintenance rates from 1991 to 2008? 3) Given that differences in maintenance rates may also represent differences in other state-level investments in Child Welfare that may improve system quality, what is the relationship between higher foster care maintenance rates and Child Welfare outcomes like greater foster care placement stability? Understanding the factors that drive state spending is critical when considering major investments in implementing evidence-based Child Welfare programs.
2. Materials and methods
We assessed key drivers of state foster care maintenance rates. We examined the extent to which foster care spending increased counter-cyclically with indicators of economic prosperity. Given that spending decisions occur in state political and budgetary climates, we also assessed the influence of these factors on state foster care spending. Federal governmental oversight as well as judicial recourse for foster care programs that do not comply with regulatory and legal requirements can influence spending. While these factors span a large range of reasons why state foster care maintenance rates might rise or fall over time, we examined whether other, unmeasured factors were likely influential. Finally, because service delivery across states is not standardized and because states may respond to changes in these factors in ways other than increasing or decreasing foster care maintenance rates, we assessed whether spending was correlated with Child Welfare outcomes measures often related to system quality assessments.
2.1. Outcomes
The main outcomes were state-level monthly foster care maintenance rates for children ages 2, 9, and 16 for years between 1991 and 2008. The maintenance rates represent payments from the state to a foster parent to cover the costs of food, clothing, shelter, daily supervision, school supplies, a child's personal incidentals, and other similar expenses for a month in accordance with Title IV-E of the Social Security Act. While mandated by federal law, states have a great deal of discretion in administering foster care programs and in augmenting set rates. Maintenance rates were derived from reports compiled by the federal government that standardized data across states and over time (US House of Representatives Ways & Means Committee [HWM], 1996, 1998, 2000, 2004, 2008), which we supplemented with information from multi-state studies (National Association of Public Child Welfare Administrators, 2007) to increase the number of state-years of observation.
In exploratory analyses examining the relationship of Child Welfare outcomes and state foster care maintenance rates, we used metrics compiled by the U.S. Department of Health and Human Services' Administration for Children and Families (Administration for Children & Families [ACF], 2010a). Specifically the 2008 values for: 1) Rate of maltreatment investigations per 1000 children under age 18; 2) percentage of children maltreated while in foster care; 3) a composite measure of foster care placement stability (ACF, 2007) which includes having <3 placements while in care for children who spend different total durations in foster care; and 4) a composite measure of timeliness of reunification and exit from foster care time from entry in the foster system until discharge and reunification with blood relatives for children who spend different total durations in foster care as well as the rate of reentry into the foster care system for those children previously reunified. It is possible that while not changing foster care maintenance rates, a state could augment funding to increase its investigational capacity, provide additional supportive and oversight services that could reduce maltreatment while in care and decrease the rates at which children move between foster placements, or accelerate services designed to successfully reunify children with blood relatives in more permanent non-foster care homes.
2.2. Predictors
2.2.1. State socioeconomic and demographic factors
The unemployment rate represented the seasonally-adjusted percentage of working age adults seeking but unable to find employment at the beginning of the year and was derived from state-year information from the U.S. Bureau of Labor Statistics (Bureau of Labor Statistics [BLS], 2012a). The percentage of children who were minority was defined as the number of non-white children under the age of 18 in a given state-year divided by the total number of children under the age of 18 in that state-year with information derived from the U.S. Bureau of the Census (ProQuest Statistical Datasets [ProQuest], 2012). The poverty rate was defined as the percentage of state population living below the poverty threshold as reported by the U.S. Bureau of the Census based on its Current Population Survey's Annual Social and Economic Supplement (United States Census Bureau [USCB], 2011a). The percentage of population living in urban areas was interpolated from decennial estimates from the U.S. Bureau of the Census (1980–2010) (USCB, 2012a), which largely matched yearly trends from the Current Population Survey (USCB, 2011b) but yielded more stable estimates for smaller states due to the larger sample size.
Theoretically, the state socioeconomic and demographic factors included in the analysis have ambiguous net effects on state foster case maintenance rates. Indicators reflecting greater poverty and higher unemployment represent periods that are often accompanied by drops in tax revenues used to fund social services. Conversely, these same time periods also represent larger demand for state services even as lower state tax revenues constrain the price the state can or is willing to pay for services. Populations with higher degrees of urbanicity again have ambiguous theoretical net effects on state foster care maintenance rates. While, in cities, there may be a larger supply of foster beds within a reasonable geographic area (i.e., lowering the foster care maintenance rate), the cost of living in cities can be higher than in rural settings (i.e., increasing the foster care maintenance rate) (Kurre, 2003; McHugh, 1990). Finally, we hypothesized that having a higher percentage of minority children could lower state foster care maintenance rates, even though minority children are more likely to qualify for and receive foster services (ACF, 1994; Wulczyn & Lery, 2007), because the services received may be of differentially lower quality (i.e., lowering foster care maintenance rates) as observed in a variety of domains (e.g., public education, housing and welfare spending) (Soss, Schram, Vartanian, & O'Brien, 2001).
2.2.2. State political climate
Republican controlled legislature indicated that all houses of the state legislature had >50% of representatives who were Republican based on election-year data derived from the U.S. Census Statistical Abstract and Book of the States (USCB, 2012a, 2012b). We included an indicator of whether a state's governor was Republican. In election years, the indicator was coded according to the political party of the governor in office at the beginning of the year (United States Council of State Governments, 2011). The indicator of Republican control was defined as having both a Republican controlled legislature and a Republican governor. In sensitivity analyses, we also explored the share of total legislators who were Republican.
We hypothesized that Republican legislatures, governors, and political control in a state would lead to reduced state foster care maintenance rates. Since the 1970s, the Republican Party has advocated smaller government, lower taxes, and reductions in public program spending (Republican Party Platforms, 1972, 1980, 1992, 2000; Republican National Committee, 2008). In exploratory analyses, we considered the extent of legislative control, hypothesizing that legislatures with very high percentages of legislators from a single party would perceive a greater public mandate for their party's positions and could afford to avoid compromise with the other party, especially when governors were of the same party and would be less likely to veto legislation.
2.2.3. State budgetary factors
State budgetary factors focus on three areas: 1) state tax revenue; 2) state spending on programs to support poor families with children; 3) federal subsidies for state spending on poor children with a focus on subsidies for state foster care programs, expressing all monetary predictors in inflation-adjusted 2008 dollars (BLS, 2012b). Per-capita total state tax revenues represented all taxes the state collected in a given year divided by the state's total population and were derived from the U.S. Census Annual Survey of State Government Tax Collections and the US Census Bureau (USCB, 2012b). We used measures that describe state spending on support for poor families with children living with them involving the Temporary Assistance for Needy Families (TANF) program and the Aid to Families with Dependent Children (AFDC) program which TANF replaced in 1996 (HR 3734, 1996). We include the average percentage of individuals in a state receiving these payments in a calendar year derived from reports compiled by the U.S. Department of Health and Human Services' Administration for Children and Families (HWM, 1996, 1998, 2000, 2004, 2008). We also included a state's Federal Medical Assistance Percentage (FMAP) which determines the federal government's contributed proportion for state spending on TANF benefits and other programs such as Medicaid and State Children's Health Insurance Program (SCHIP) that focus on poorer children (United States Department of Health & Services [HHS], 2012a). Specifically, we use the interaction of the FMAP with the maximum TANF payment to assess the differential effect of federal subsidies for other programs for poor families with children. We also included federal subsidies to state child welfare programs under Title IV-B and IV-E of the Social Security Act, expressed in inflation adjusted dollars per child in the state foster care system (ACF, 2010b; HWM, 2008; OMB, 2002–2009). Of note, compared to Title IV-E, Title IV-B allocations represents a smaller amount of money and specifically focuses on spending for services targeting family preservation and reunification of foster children with their biological families.
We hypothesize that when states have more tax revenue per individual, spending on foster care maintenance rates will increase. When programs are subsidized by the federal government, spending on them will differentially increase, suggesting that higher per-capita Title IV-B and Title IV-E levels should increase state foster care maintenance rates. Higher TANF rates and higher FMAP rates may be linked to increased spending on foster care maintenance rates as they may also indicate a greater emphasis on poor families and children within the state's policy agenda which can be funded in years when budgets are less tight. Recent reports also suggest that states may reallocate federal TANF funding to foster care programs in years with budget deficits (DeParle, 2012).
2.2.4. Risks of federal or legal penalties
We included three main measures of audits carrying penalties for states whose foster care systems did not meet federal mandates and other legal requirements: 1)undergoing a Child and Family Services Review (CFSR); 2) undergoing 1st and 2nd rounds of Title IV-E eligibility reviews; and 3) being subject to a foster care class action lawsuit and resulting settlements. For each type of federal program review, an indicator of whether a given review type had occurred in that state was used (ACF, 2004; HHS, 2012b). For example, in Tennessee, the CFSR occurred in 2002 and the first and second Title IV-E reviews occurred in 2004 and 2006 respectively. Indicators for each of these three reviews would be 0 prior to 2002, 2004, and 2006 and 1 for 3 years thereafter, on the hypothesis that when the action occurred it had its biggest effect which persisted for several years before declining; other lengths of time were explored in sensitivity analyses. We included two indicators relating to class action lawsuits for non-compliance with foster care regulatory and legislative requirements, whether a state had experienced a class action lawsuit and whether that lawsuit had led to a judgment, settlement, or consent decree in the court mandated payments, policy changes, or monitored the state's foster care system (Child Welfare League of America, 2005; National Center for Youth Law, 2010). Again, indicators of the year on and 3 years after which such lawsuits and settlements occurred were used.
Because non-conformity with standards and quality measured by the CFSR reviews results in states needing to implement Program Improvement Plans (PIP), we hypothesize that CFSR reviews would lead to increased spending on state foster care maintenance rates. Similarly, as repeated failures to achieve compliance with outcomes included in the Title IV-E eligibility reviews can lead to reductions in federal monies received for the state's program (i.e., larger disallowances), we hypothesized that repeated reviews would lead to increased spending on state foster care maintenance rates to attract more and higher quality foster homes (ACF, 2012). Alternatively, being audited to ensure that a state is claiming only children who truly qualify for Title IV-E funds might force some share of foster children off of the Title IV-E federal subsidy list, raising the burden on state funds for foster care and reducing maintenance rates. Because class action lawsuits can be both expensive and embarrassing to states, we hypothesize that both their existence as well as resulting judgments against the state should increase state foster care maintenance rates in efforts to improve the availability and quality of foster care placements.
2.3. Analytic methods
We characterized trends in state foster care maintenance rates and whether states increased or decreased these rates over time, examining these trends in nominal and inflation adjusted terms. We then estimated linear panel models, separately regressing state foster care maintenance rates at age 2, 9, and 16 on the predictors listed above. We estimated univariate and multivariate models. To examine the robustness of parameter estimates, we estimated multivariate models in which categories of variables were added sequentially as blocks. For example, first, we regressed our outcomes on all state socioeconomic and demographic factors. Then, we regressed them on all state socioeconomic and demographic factors and political climate variables. We continued in this way until the model included all state socioeconomic and demographic factors, political climate variables, budgetary factors, and risks of federal or legal penalties variables.
All models included state fixed effects to account for non-time-varying, unmeasured differences between states that influenced state foster care maintenance rates. All models also included year fixed effects to account for non-state varying, unmeasured differences between years that influenced state foster care maintenance rates. After estimating the models, we examined the extent to which the predictors explained variability in state foster care maintenance rates and also the extent to which state and year fixed effects alone (i.e., unmeasured factors) explained the variability.
In exploratory analyses, we examined the correlation between Child Welfare outcomes and state foster care maintenance rates as well as the correlation with estimated state fixed effects. All models included robust standard errors clustered by state. Models did not weight by state population since the level of decision-making that we considered was at the state government level, but variables were expressed in per-capita terms to ensure that values from states with larger populations were comparable to those from smaller states.
We assessed the robustness of our findings in a number of ways. We examined alternate specifications for political variables that captured not only whether a single political party was in control of state government but also the extent of that control. We estimated models with various lag lengths for predictors. We compared changes in coefficient estimates across specifications, examining whether the same sign, magnitude, and statistical significance were maintained. We assessed estimate instability due to multicollinearity by assessing the condition index (Hendrickx, 2004). Even without substantial multicollinearity, to improve the potential efficiency of regression estimates, we compared using year fixed effects versus year trends and year quadratic terms, and also considered the appropriateness of employing a random effects specification versus a state fixed effects specification based on the Sargan–Hansen test of over-identifying restrictions (Hansen, 1982; Sargan, 1958). All analyses used Stata version 11.2 (StataCorp, 2009).
3. Results
3.1. Trends in state foster care spending
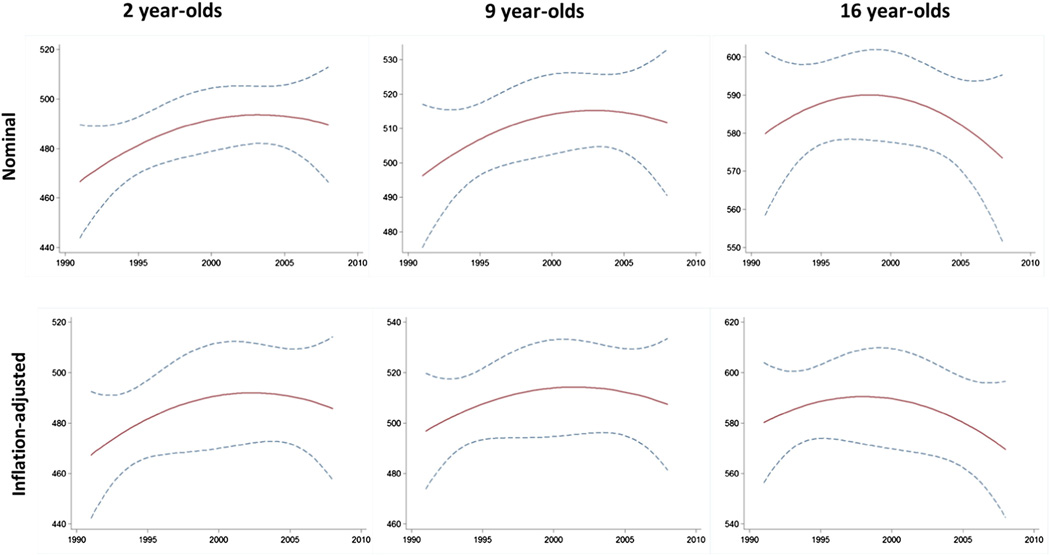
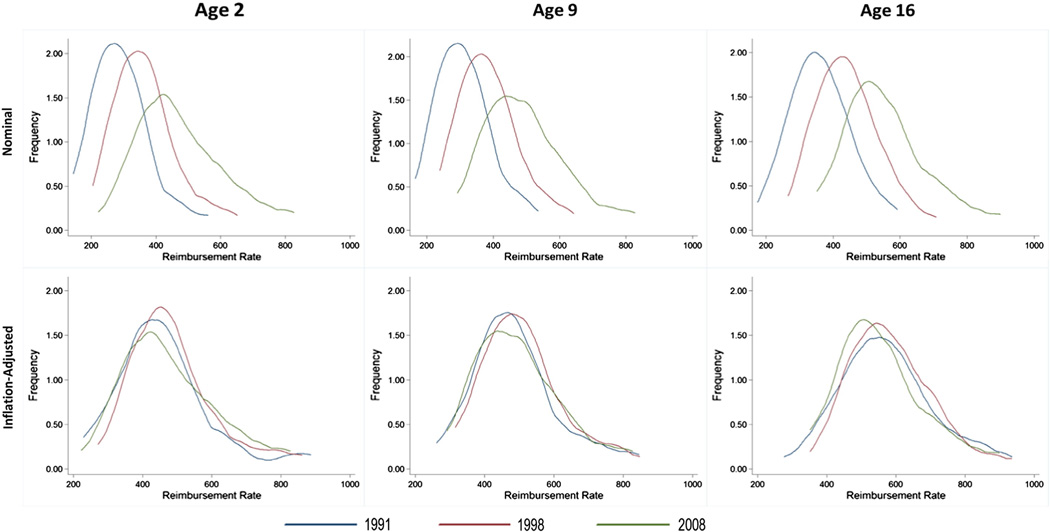
Between 1991 and 2008, state maintenance rates increased, but these increases did not keep pace with inflation in many states, leaving foster parents to provide care for foster children with less real resources (Table 1 and Appendix Fig. 1). In unadjusted terms, over this period, the national average foster care maintenance rate increased 50–60%. For example, the average rate paid to support a 2 year-old in foster care was $293 in 1991 and $471 by 2008. These large apparent increases occurred for all states (Fig. 1, Upper Panels). However, after adjusting for inflation, the national average rate increased by only 1.6% for 2 year-olds and actually declined by 0.3–3.7% for 9 and 16 year-olds. On a state-by-state basis, 54% of states saw decreases in their inflation-adjusted foster care maintenance rates for 2 year-olds, 58% for 9 year-olds, and 65% for 16 year-olds (Fig. 1, lower panels).
Table 1.
Description of state foster care maintenance rates and characteristics over time*.
| 1991 | 1994 | 1998 | 2000 | 2004 | 2007 | 2008 | Percentage of States increasing between 1991 and 2008 |
||
|---|---|---|---|---|---|---|---|---|---|
| Real maintenance rate — 2 year olds | Monthly rate paid to foster families on a per-foster-child basis (2008 Dollars) (HWM, 1996, 1998, 2000, 2004, 2008) |
463 | 478 | 486 | 484 | 498 | 496 | 478 | 46% |
| Real maintenance rate — 9 year olds | Monthly rate paid to foster families on a per-foster-child basis (2008 Dollars) (HWM, 1996, 1998, 2000, 2004, 2008) |
493 | 507 | 510 | 505 | 525 | 516 | 498 | 44% |
| Real maintenance rate — 16 year olds | Monthly rate paid to foster families on a per-foster-child basis (2008 Dollars) (HWM, 1996, 1998, 2000, 2004, 2008) |
574 | 591 | 588 | 581 | 593 | 581 | 561 | 38% |
| Unemployment | Seasonally adjusted unemployment rate at the start of reference year (BLS, 2012a, 2012b) |
6% | 6% | 4% | 4% | 5% | 4% | 4% | 4% |
| Minority children | Share of state population under 19 that is non-white (ProQuest Statistical Datasets, 2012) |
26% | 27% | 29% | 32% | 34% | 35% | 36% | 98% |
| Poverty rate | (USCB, 2011b) | 14% | 13% | 12% | 11% | 12% | 12% | 13% | 24% |
| Urbanity | Share of population living in urban areas, linearly interpolated from census years 1980–2010 (USCB, 1993, 2012a) |
69% | 70% | 70% | 71% | 71% | 72% | 72% | 86% |
| Partial Republican Control of State Government | Either Republican Controlled State Legislature or Republican Governor. Composition of state legislature in non-election years is equal to the composition following the most recent election. In election and special election years, the party of the incoming governor or legislature is recorded. Nebraska is excluded due to its non-partisan unicameral State Legislature. (United States Council of State Governments, 2011; USCB, 2012a) |
47% | 59% | 53% | 59% | 51% | 63% | 59% | 33% |
| Republican Controlled State Government | Republican Controlled State Legislature and Republican Governor. Composition of state legislature in non-election years is equal to the composition following the most recent election. In election and special election years, the party of the incoming governor or legislature is recorded. Nebraska is excluded due to its non-partisan unicameral State Legislature. (United States Council of State Governments, 2011) |
31% | 14% | 31% | 22% | 22% | 14% | 18% | 10% |
| Real per foster child Title IV B funding | Real annual Title IV B funding per foster child (2008 Dollars) (ACF, 2010b; HWM, 1996, 1998, 2000, 2004, 2008) |
116 | 101 | 82 | 71 | 59 | 50 | 51 | 5% |
| Real per foster child Title IV E funding | Real annual Title IV E funding per foster child (2008 Dollars) (ACF, 2010b; HWM, 1996, 1998, 2000, 2004, 2008; OMB, 2002–2009) |
571 | 657 | 741 | 697 | 672 | 650 | 73% | |
| TANF benefit reimbursed by federal government | Amount of the maximum monthly TANF benefit for a family of three reimbursed by federal government (calculated using FMAP rate) (HHS, 2012a; HWM, 1996, 1998, 2000, 2004, 2008) |
324 | 300 | 273 | 264 | 247 | 223 | 217 | 2% |
| Share of state population on TANF | Share of state population receiving TANF benefits (HWM, 1996, 1998, 2000, 2004, 2008) |
4% | 5% | 3% | 2% | 2% | 1% | 1% | 0% |
| Real per capita state tax revenue | 2008 Dollars (USCB, 2012b) | 1974 | 2078 | 2260 | 2379 | 2338 | 2706 | 2814 | 100% |
| CFSR review | Indicator for completing the Child and Family Services Review (ACF, 2004) |
0% | 0% | 0% | 0% | 100% | 100% | 100% | |
| 1st Title IVE eligibility review | Indicator for completing the first Title IV E Eligibility Review (HHS, 2012b) |
0% | 0% | 0% | 18% | 100% | 100% | 100% | |
| 2nd Title IVE eligibility review | Indicator for completing the second Title IV E Eligibility Review (HHS, 2012b) |
0% | 0% | 0% | 0% | 39% | 100% | 100% | |
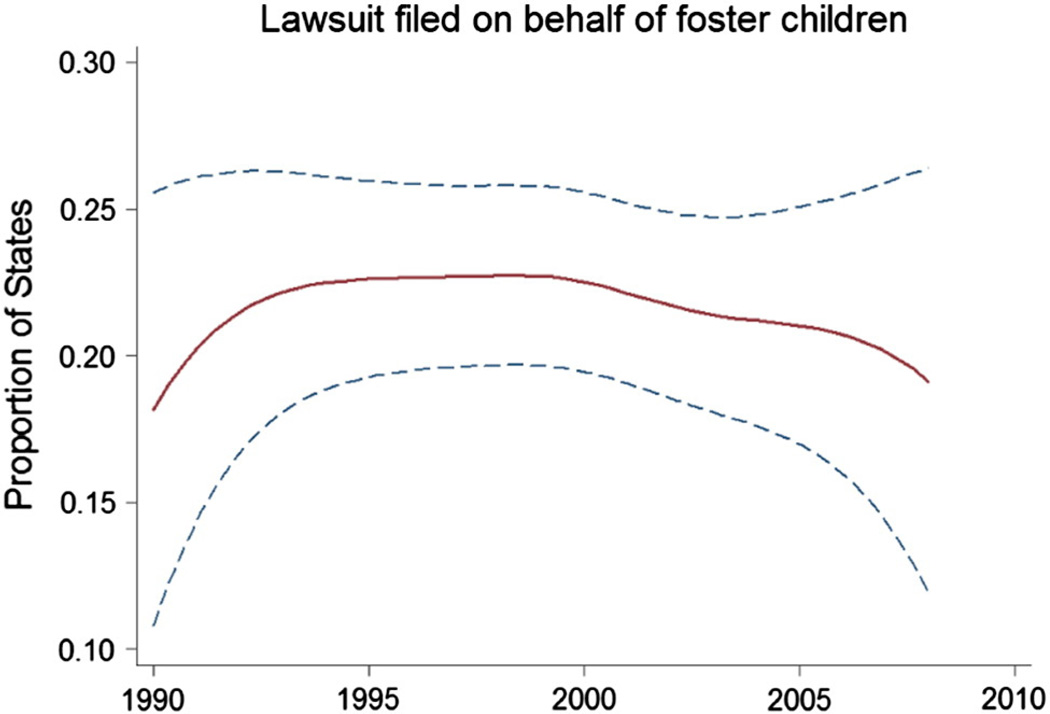
| Lawsuits filed | Indicator for whether or not a lawsuit has been filed on behalf of foster children (National Center for Youth Law, 2010) |
18% | 27% | 20% | 20% | 22% | 22% | 16% | |
| Settlements reached | Indicator for whether a binding settlement or consent decree has been approved between state foster care agency and foster children (Child Welfare League of America, 2005; National Center for Youth Law, 2010) |
10% | 18% | 12% | 14% | 14% | 18% | 10% |
Summary statistics for key variables are shown for selected years. In addition to years shown, data on foster care maintenance rates are also available for 1992, 1993, and 1996. Data on Title IV B funding are also available for 1992, 1993, 1995, 1996, 1997, 1999, 2001, 2002, 2003, and 2006. Data on Title IV E funding are also available for 1993, 1995, 1996, 1999, 2002, 2003, 2005 and 2006. Data on TANF benefits are available for all years from 1990 to 2008 except 1997. Data on unemployment, minority children, poverty rate, urbanicity, republican control of state government, FMAP rates, share of population receiving TANF benefits, real per-capita state tax revenue, CFSR reviews, title IV E reviews, lawsuits and settlements are available for all years from 1990 to 2008.
Appendix Fig. 1.
Average state maintenance rates for foster children (nominal and real values).
Fig. 1.
Changes in the distribution of state foster care maintenance rates over time by age and inflation-adjustment. Shown in the figure panels are the distributions of foster care maintenance rates across states in 1991 (blue lines), 1998 (red lines), and 2008 (green lines) expressed in nominal terms (upper panels) and inflation-adjusted terms to 2008 dollars (lower panels) for children age 2 years, 9 years, and 16 years of age.
Importantly, the magnitude of changes in foster care maintenance rates differed by state. The following analyses examine how changes in state maintenance rates relate to trends in state-level demographic, socioeconomic, and political factors and to trends in more state budgetary, federal policy, and legal factors. All subsequent results are reported for inflation-adjusted state foster care maintenance rates.
3.2. Trends in state demographic, socioeconomic, and political factors and their relationship to foster care maintenance rates
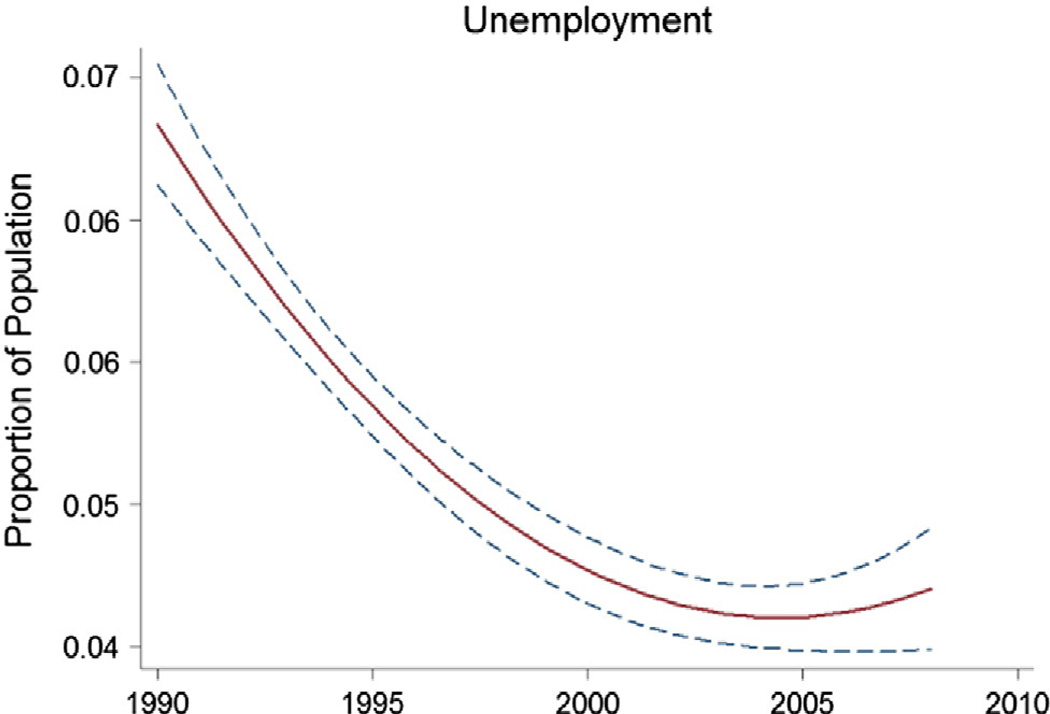
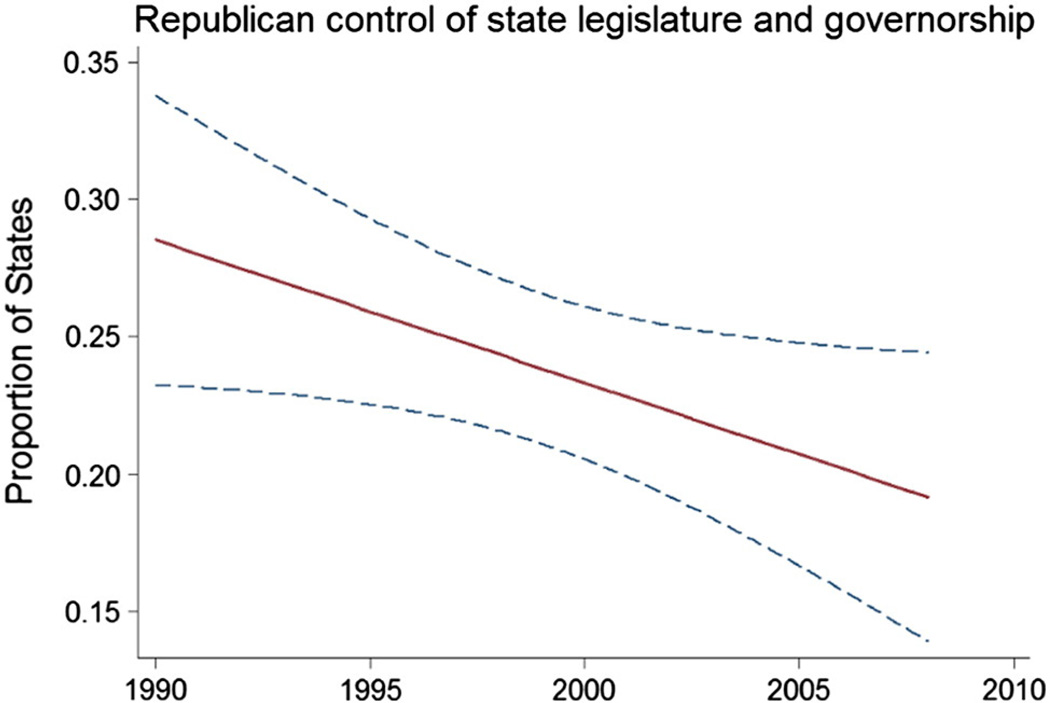
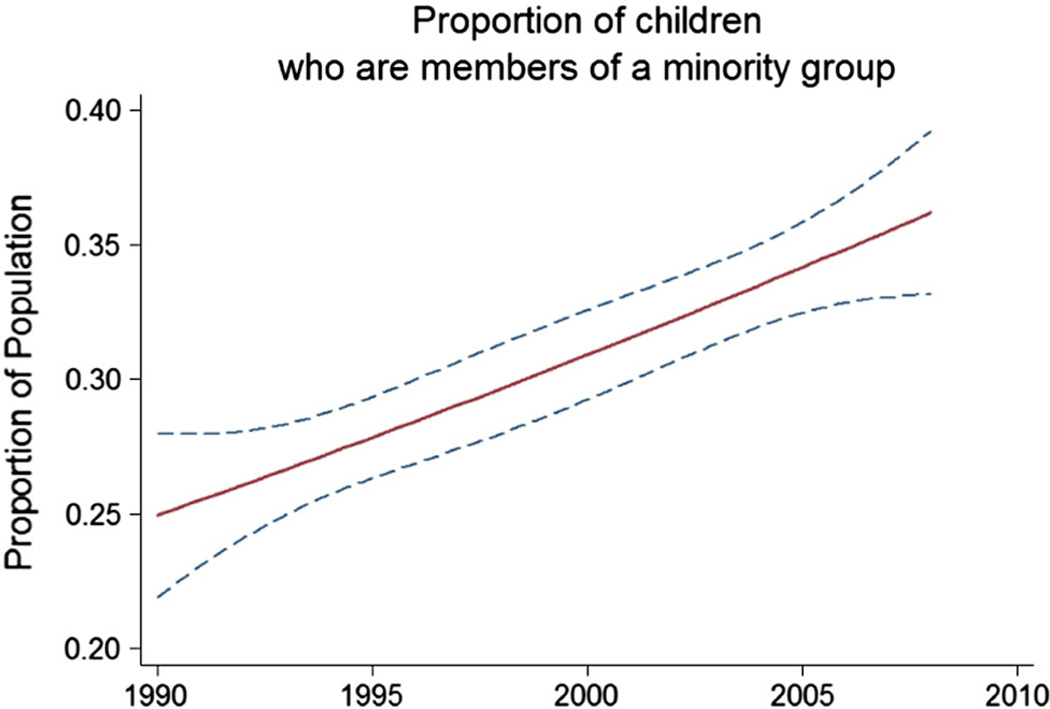
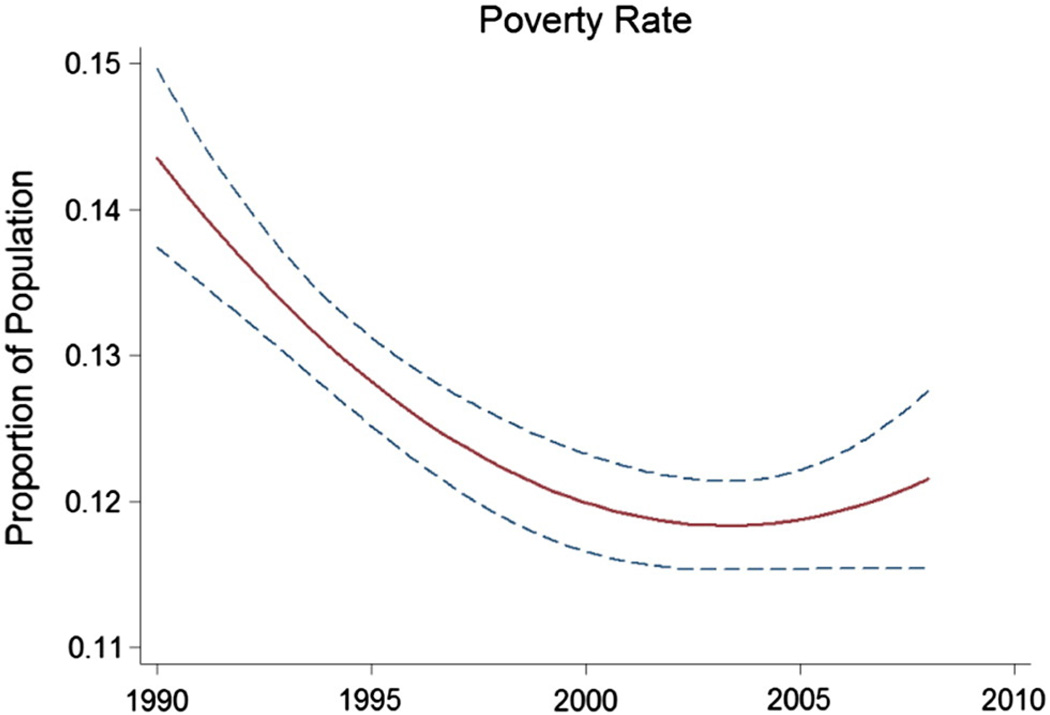
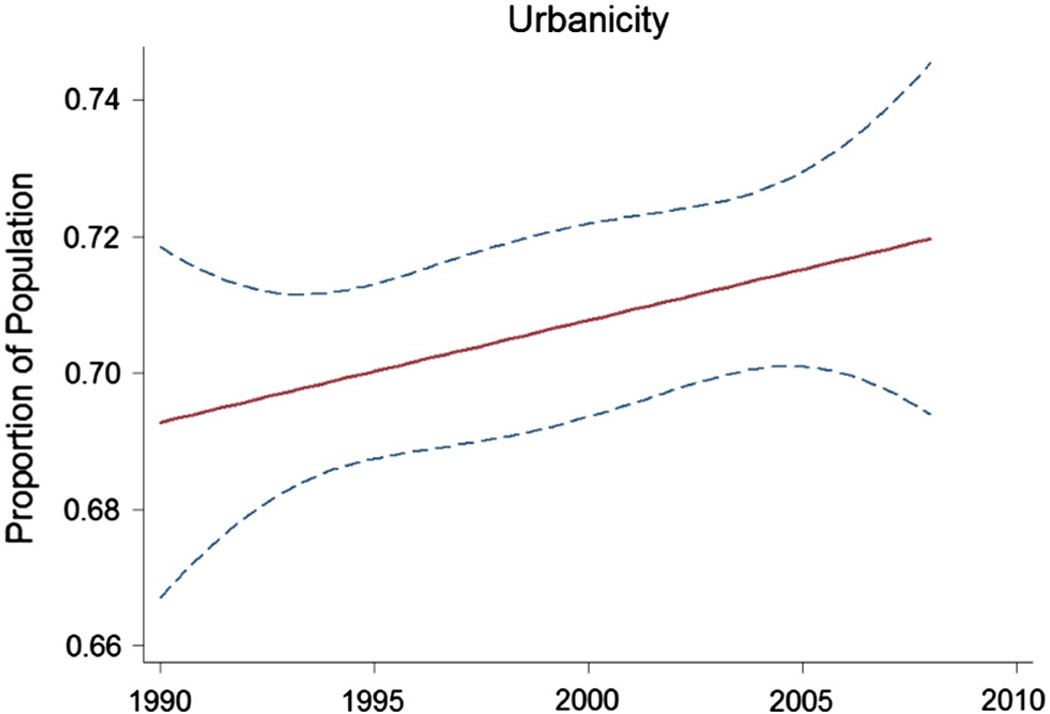
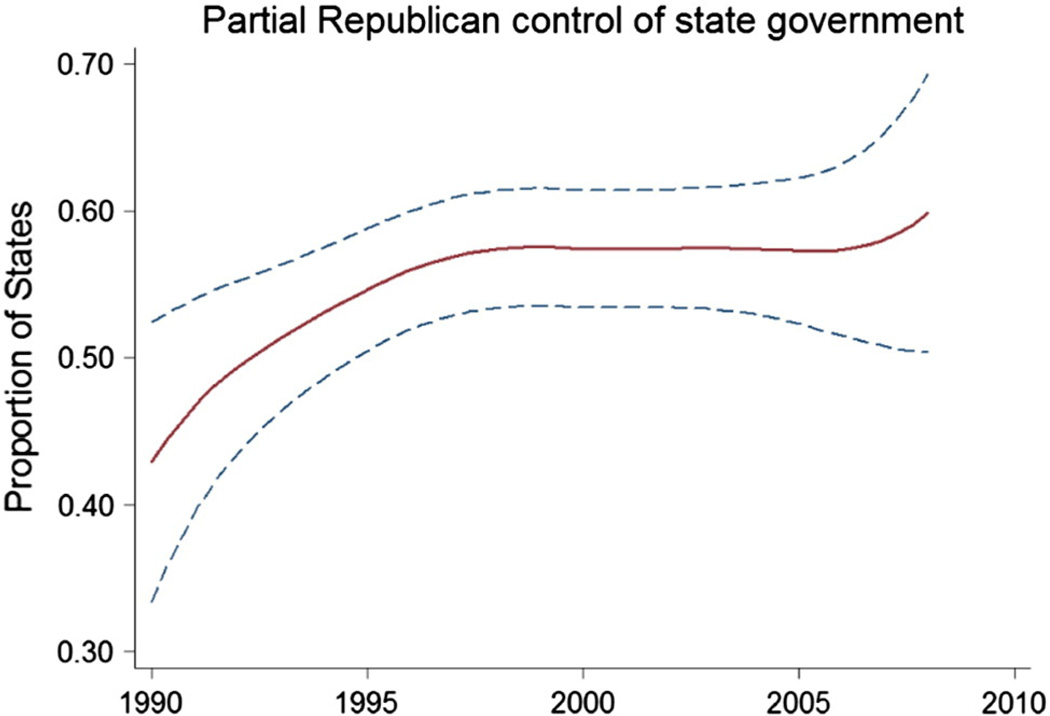
Between 1991 and 2008, substantial changes occurred in terms of state demographic profiles, economic climate, and political environment (Table 1 and Appendix Figs. 2–7). States' socioeconomic indicators improved on average. State unemployment declined from 6.2% to 4.5%. Poverty rates declined from 13.7% to 12.5%. While these economic indicators showed net improvement over this period, the lowest rates of unemployment and poverty occurred in 2000 and have worsened since. Demographically, states have also changed in important ways. The average proportion of states' populations living in urban areas increased from 69% to 72%. The average proportion of states' children who were minorities increased from 26% to 36%. With respect to both socioeconomic and demographic indicators, states differ substantially from one another. For example, real median household income declined in Arizona by 3.4% between 1991 and 2008 while it rose by 41% in Utah and ranged from $30,785 in Mississippi in 1991 to over $72,423 in Alaska in 1996. While the share of minority children remained nearly the same in Mississippi, during the same period, it more than doubled in Maine, Vermont and New Hampshire. The state political landscape has also shifted dramatically. In 1991, 6% of states had both Republican governors and legislatures and 41% had either a Republican governor or a Republican legislature. With a rapid increase in total Republican control of state government in the early 1990s, by 1997, partial or total Republican control of state governments had increased to 77%. Though recently declining, in 2008 partial and total Republican control of state government was still 33% and 18%, respectively, higher than 1991.
Appendix Fig. 2.
Average state unemployment rates.
Appendix Fig. 7.
Share of states with a Republican controlled state legislature and a Republican governor.
Univariate analyses show that foster care maintenance rates decreased in harsher economic climates and increased in more favorable climates. State foster care maintenance rates for 2, 9, and 16 year-olds were consistently lower after years with higher unemployment, greater proportions of children who were minorities, higher rates of poverty, and greater proportions of the population living in urban areas. The relationship between foster care maintenance rates and unemployment had a p-value below 0.05 for all ages, and the relationship with poverty had a p-value below 0.05 for 16 year-olds and below 0.1 for 2 and 9 year-olds. Foster care maintenance rates decreased when state governments were under Republican control, though this effect was not present when Democrats and Republicans shared control of state governments. Compared to years in which Democrats controlled the governorship and state legislature, state foster care maintenance rates for 2, 9, and 16 year-olds were consistently lower following years when state governments had both Republican governors and Republican-controlled legislatures or years when state governments either had Republican governors and Democrat-controlled legislatures or had Democratic governors and Republican-controlled legislatures, though the p-value was above 0.1 for all ages.
Much remains to be learned about the drivers of state foster care spending. While the relationship between state foster care maintenance rates and harsher economic climates and Republican political control of state government persisted for 2, 9, and 16 year-olds in multivariate analyses, much of the between-state differences in foster care maintenance rates appear to be due to other factors. In particular, higher unemployment remained significantly related to lower state foster care maintenance rates, as did Republican total control or partial control of state government. Notably, changes in state foster care maintenance rates are not strongly linked to sociodemographic, economic, and political factors, as evidenced by the explanatory role of state fixed effects (i.e., measures of other state-specific factors not included in the regression explicitly). In multivariate regressions without state fixed effects and year fixed effects approximately 15% of the variation in maintenance rates was explained (data not shown) compared to 67–74% in the same regressions when these fixed effects were included. Analyses presented in the next section seek to decompose some of the other state-level factors represented by the state fixed effects. Other factors we examined include state budgetary climate, federal budgetary support as well as foster care-specific regulatory and legal reviews. When we repeated these analyses with nominal state foster care maintenance rates, the results were similar (Appendix Table 1).
Appendix Table 1.
Relationship of nominal state foster care maintenance rates to socioeconomic, demographic and political factors from 1991 to 2008.
| Univariate | Multivariate | Fixed effect only | ||||
|---|---|---|---|---|---|---|
| Foster care maintenance rates for 2 year-olds | ||||||
| Unemployment | −15.96** | −14.77** | −12.64 | |||
| % Minority children | −5.62 | −4.94 | 1.45 | |||
| Poverty rate | −3.22 | −0.02 | −0.70 | |||
| Urbanicity | −4.49 | −0.51 | 1.22 | |||
| Partial Republican Control of State Government | −15.42 | −29.49* | −30.96* | |||
| Republican Controlled State Government | 1.18 | −24.95 | −29.06 | |||
| State fixed effects | Yes | Yes | Yes | Yes | Yes | Yes |
| Year fixed effects | Yes | Yes | Yes | Yes | No | Yes |
| Constant | 670.37* | 397.88*** | 331.36 | 268.50*** | 372.66*** | |
| Observations | 492 | 492 | 472 | 472 | 492 | 492 |
| Adjusted R-squared | 0.761–0.804 | 0.776 | 0.792 | 0.798 | 0.467 | 0.762 |
| Foster care maintenance rates for 9 year-olds | ||||||
| Unemployment | −15.83** | −14.83** | −12.80* | |||
| % Minority children | −5.30 | −4.75 | 1.68 | |||
| Poverty rate | −3.03 | 0.08 | −0.60 | |||
| Urbanicity | −3.55 | 0.30 | 2.09 | |||
| Partial Republican Control of State Government | −14.49 | −28.97 | −30.76* | |||
| Republican Controlled State Government | −0.01 | −25.68 | −30.30 | |||
| State fixed effects | Yes | Yes | Yes | Yes | Yes | Yes |
| Year fixed effects | Yes | Yes | Yes | Yes | No | Yes |
| Constant | 640.11* | 424.35*** | 297.17 | 292.10*** | 398.72*** | |
| Observations | 492 | 492 | 472 | 472 | 492 | 492 |
| Adjusted R-squared | 0.741–0.764 | 0.756 | 0.778 | 0.784 | 0.398 | 0.742 |
| Foster care maintenance rates for 16 year-olds | ||||||
| Unemployment | −14.17** | −13.01** | −11.46* | |||
| % Minority children | −4.18 | −3.78 | 3.07 | |||
| Poverty rate | −3.31 | −0.81 | −1.50 | |||
| Urbanicity | −1.56 | 1.81 | 3.87 | |||
| Partial Republican Control of State Government | −14.50 | −28.85 | −31.87* | |||
| Republican Controlled State Government | 0.11 | −25.46 | −31.76 | |||
| State fixed effects | Yes | Yes | Yes | Yes | Yes | Yes |
| Year fixed effects | Yes | Yes | Yes | Yes | No | Yes |
| Constant | 533.82 | 440.57*** | 161.57 | 304.00*** | 414.83*** | |
| Observations | 492 | 492 | 472 | 472 | 492 | 492 |
| Adjusted R-squared | 0.740–0.779 | 0.756 | 0.782 | 0.789 | 0.396 | 0.747 |
p < 0.1,
p < 0.05, and
p < 0.01.
3.3. Trends in budgetary, policy, and legal climates and their relationship to foster care maintenance rates
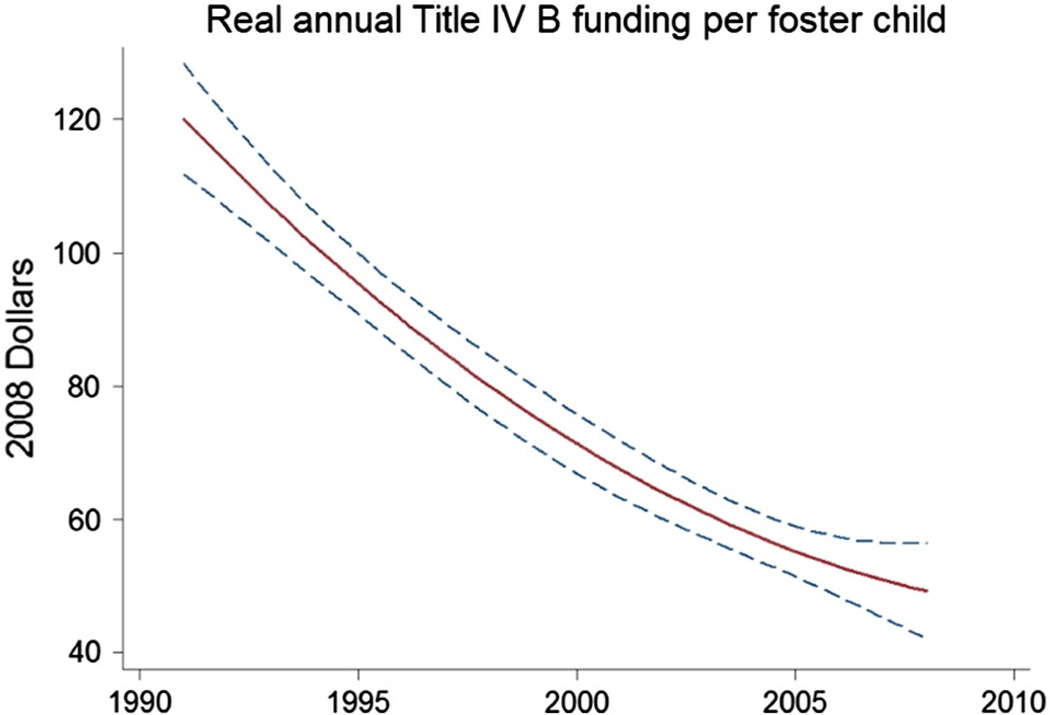
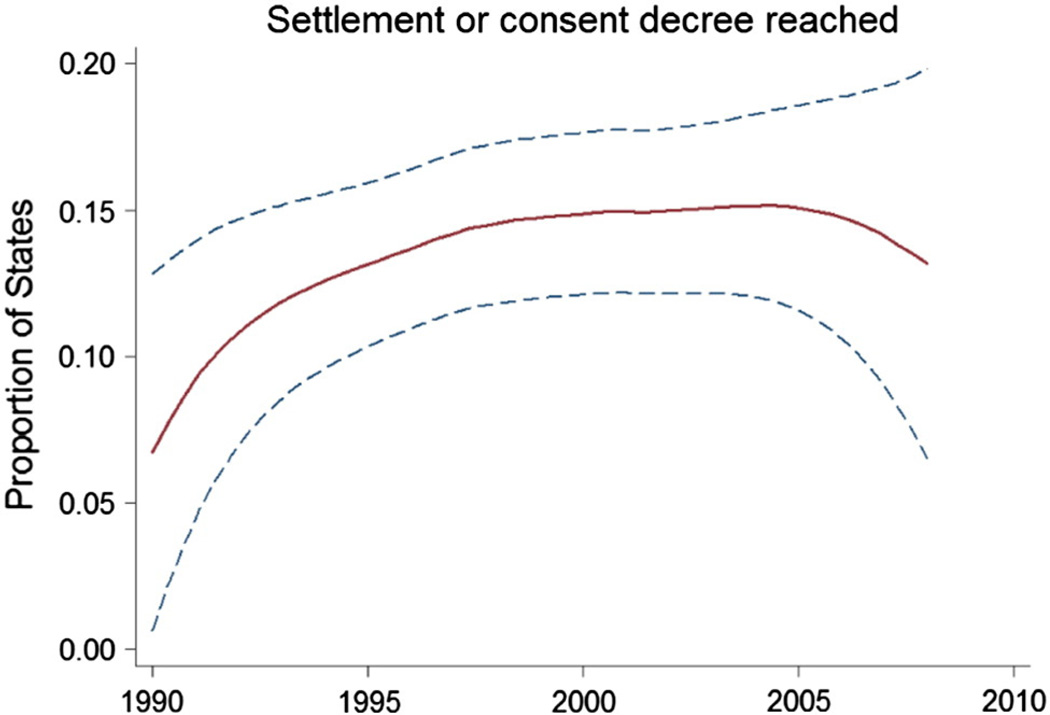
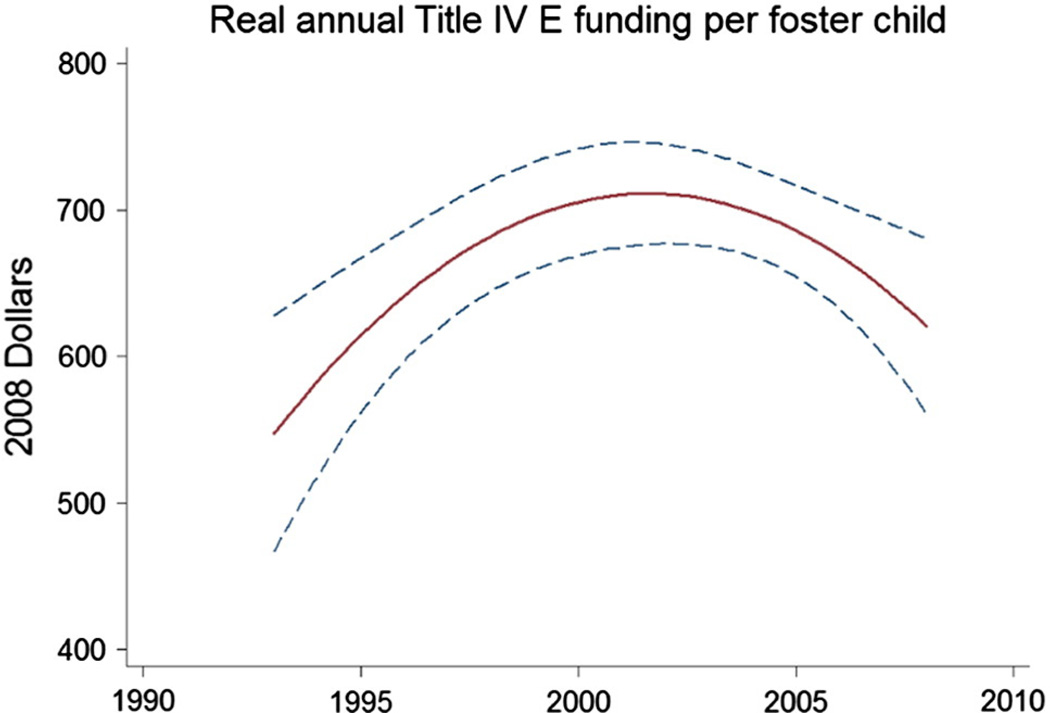
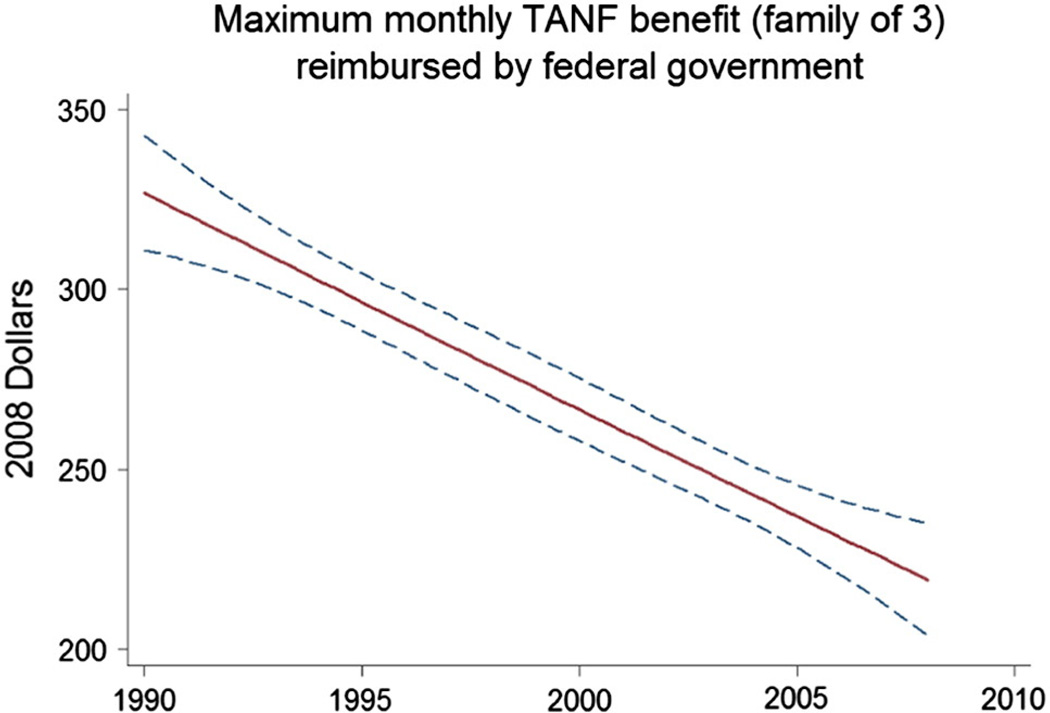
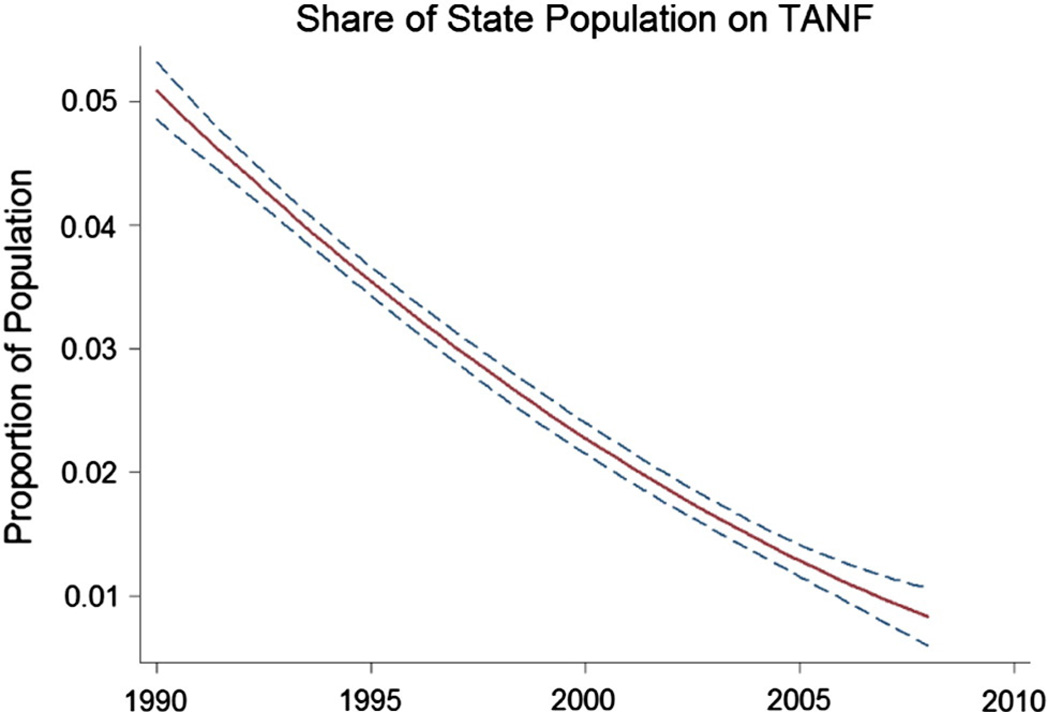
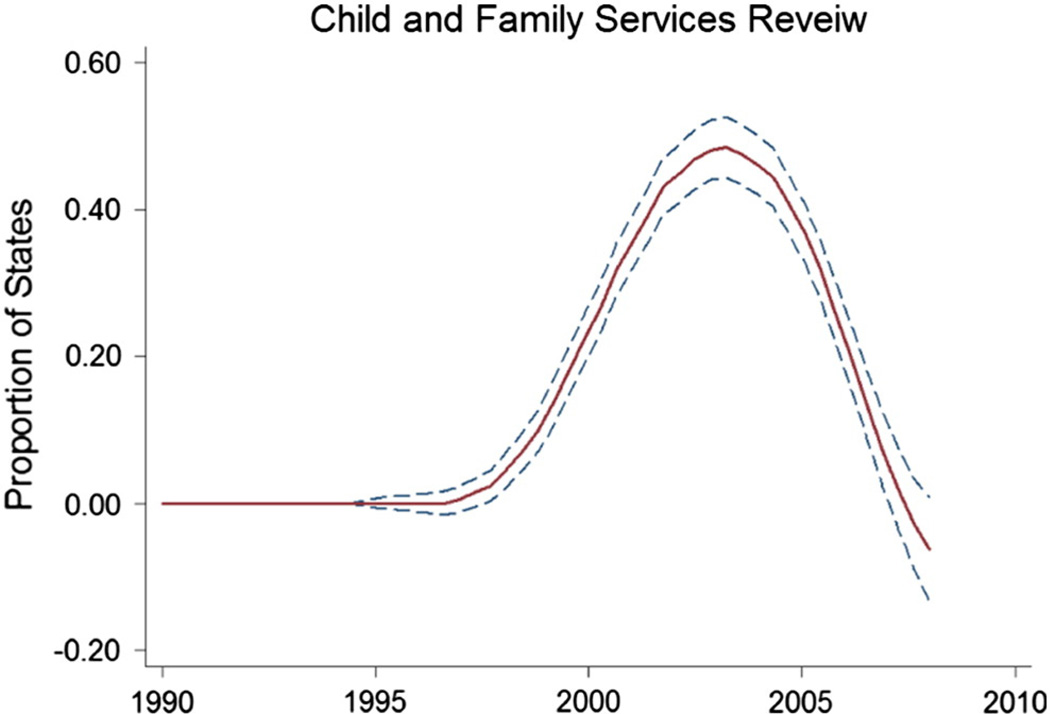
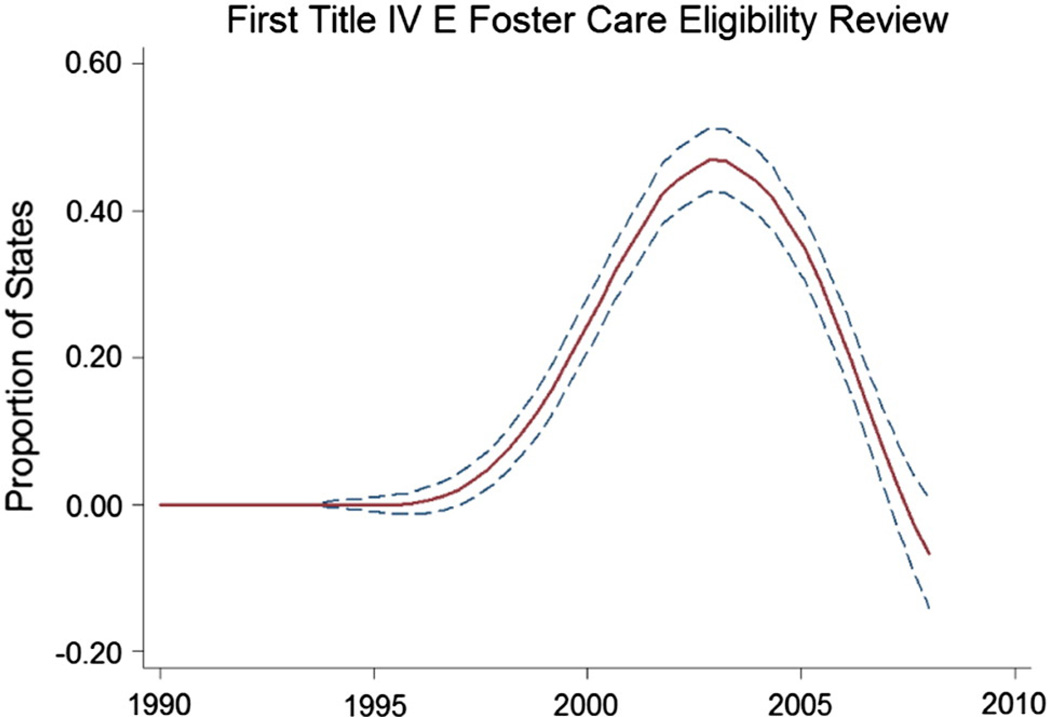
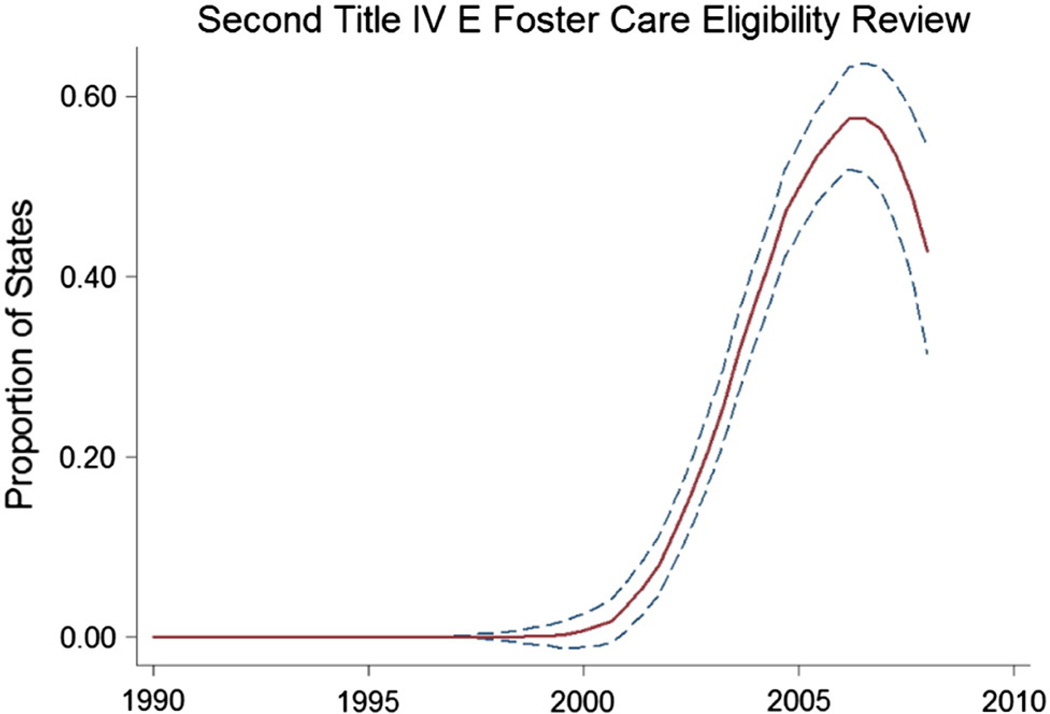
Data available between 1994 and 2008 show that substantial changes occurred in terms of state budgetary realities and federal budgetary support and in terms of foster care-specific regulatory and legal reviews (Table 2 and Appendix Figs. 8–17). Funding from federal sources for state Child Welfare programs declined. Per-foster child Title IV-B funding declined from $116 in 1991 to $51 in 2008. Per-foster child Title IV-E funding increased to a high of nearly $720 in 2002 before declining to $650 in 2008. The federal share of state programs directed to poorer families and children (FMAP) declined from 62% to 60%. The average proportion of state population receiving TANF declined from 4.5% to 1.1% over the period. States' real per-capita tax revenues increased from $1974 to $2814. Federal governmental and legal review and associated pressures and requirements to modify the child welfare system have also occurred with increasing frequency over the period. By 2004, all states had undergone a CFSR review. Similarly, by 2004, all had undergone their first Title IV-E eligibility review, and by 2007, all had undergone a second Title IV-E eligibility review. The proportion of states that had been subject to a class action lawsuit concerning their child welfare systems rose from 29% to 51% between 1994 and 2008. Many of these resulted in consent decrees or other settlements and judgments requiring states to modify their child welfare systems (31% in 1994 rising to 65% in 2008).
Table 2.
Relationship of state foster care maintenance rates to socioeconomic, demographic and political factors from 1991 to 2008.
| Univariate | Multivariate |
Fixed effects only | ||||
|---|---|---|---|---|---|---|
| Socioeconomic variables |
Political variables |
Socioeconomic and political variables |
||||
| Foster care maintenance rates for 2 year-olds | ||||||
| Unemployment | −19.76** | −17.30** | −15.79* | |||
| % Minority children | −7.80 | −7.11 | −1.24 | |||
| Poverty rate | −5.59* | −1.76 | −2.54 | |||
| Urbanicity | −3.58 | 2.28 | 4.31 | |||
| Partial Republican control of state Government | −12.86 | −35.95* | −36.20* | |||
| Republican controlled state Government | −9.08 | −40.93* | −44.22** | |||
| State fixed effects | Yes | Yes | Yes | Yes | Yes | Yes |
| Year fixed effects | Yes | Yes | Yes | Yes | No | Yes |
| Constant | 599.13* | 373.43*** | 281.51 | 337.05*** | 335.10*** | |
| Observations | 472–492 | 492 | 472 | 472 | 492 | 492 |
| Adjusted R-squared | (0.70–0.73) | 0.73 | 0.73 | 0.74 | 0.71 | 0.71 |
| Foster care maintenance rates for 9 year-olds | ||||||
| Unemployment | −19.72** | −17.49** | −15.82** | |||
| % Minority children | −7.19 | −6.51 | −0.32 | |||
| Poverty rate | −5.29* | −1.57 | −2.34 | |||
| Urbanicity | −3.32 | 2.17 | 4.38 | |||
| Partial Republican control of state Government | −11.53 | −33.94 | −34.83* | |||
| Republican controlled state Government | −9.66 | −39.73 | −43.90* | |||
| State fixed effects | Yes | Yes | Yes | Yes | Yes | Yes |
| Year fixed effects | Yes | Yes | Yes | Yes | No | Yes |
| Constant | 606.43* | 400.34*** | 263.21 | 368.05*** | 363.13*** | |
| Observations | 472–492 | 492 | 472 | 472 | 492 | 492 |
| Adjusted R-squared | (0.66–0.69) | 0.68 | 0.70 | 0.71 | 0.66 | 0.66 |
| Foster care maintenance rates for 16 year-olds | ||||||
| Unemployment | −17.84** | −15.29* | −14.31* | |||
| % Minority children | −6.34 | −5.68 | 0.76 | |||
| Poverty rate | −5.68** | −2.51 | −3.26 | |||
| Urbanicity | −2.18 | 2.89 | 5.44 | |||
| Partial Republican control of state Government | −11.82 | −33.96 | −35.74* | |||
| Republican controlled state Government | −9.16 | −39.25* | −44.56* | |||
| State fixed effects | Yes | Yes | Yes | Yes | Yes | Yes |
| Year fixed effects | Yes | Yes | Yes | Yes | No | Yes |
| Constant | 537.04 | 402.40*** | 167.27 | 383.71*** | 365.07*** | |
| Observations | 472–492 | 492 | 472 | 472 | 492 | 492 |
| Adjusted R-squared | (0.66–0.69) | 0.68 | 0.7 | 0.71 | 0.66 | 0.66 |
p < 0.10,
p < 0.05,
p < 0.01.
Appendix Fig. 8.
Average annual funding per foster child under Title IV B.
Appendix Fig. 17.
Share of states in which settlements or consent decrees have been reached in lawsuits filed on behalf of foster children within the previous 3 years.
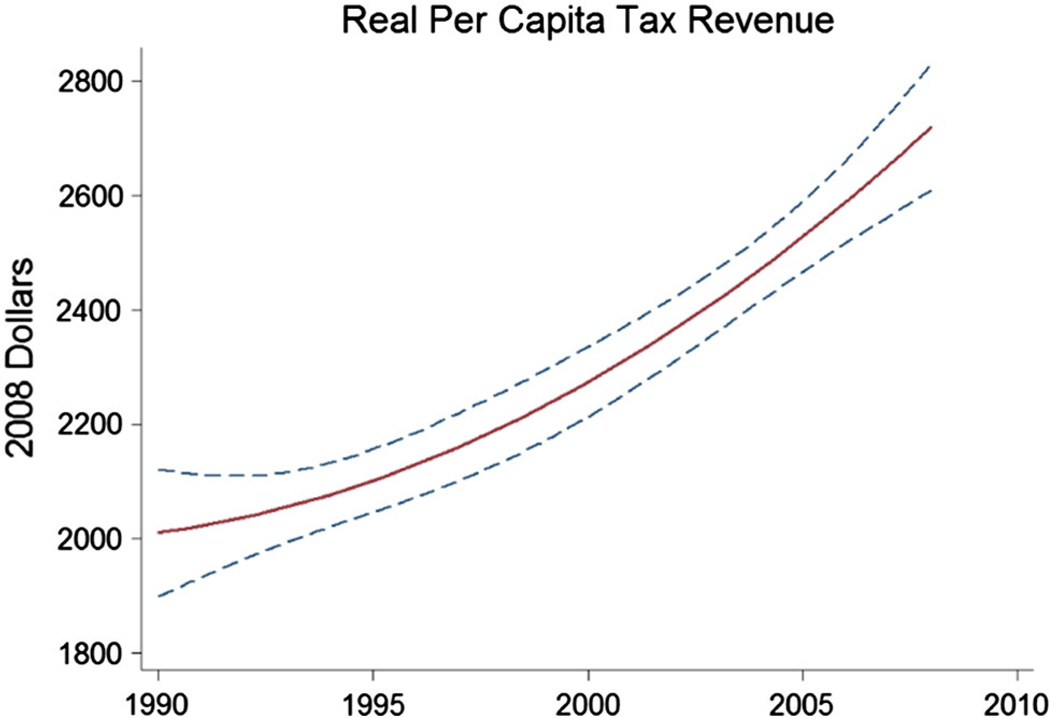
In univariate analyses examining 1994–2008, we find again that harsher economic climates are related to declines in state foster care maintenance rates, though only urbanicity has a p-value below 0.10 for 2 and 9 year-olds. Likewise, Republican political control of state governments is related to lower foster care maintenance rates, though again the significance of this relationship is attenuated. State per-capita tax revenue is related to higher foster care maintenance rates, though not significantly. Federal Title IV funding has an ambiguous and non-significant relationship, but higher levels of federal TANF dollars are related to increases in state foster care maintenance rates (p< 0.10) as are greater shares of the state's population receiving TANF. Federal reviews and law suits and consent decrees have an ambiguous and non-significant relationship to state foster care maintenance rates (Table 3).
Table 3.
Relationship of state revenue, federal subsidies and programs, and legal challenges as well as socioeconomic, demographic and political factors to state foster care maintenance rates from 1994 to 2008.
| Univariate | Multivariate | Fixed effects only | |||||||
|---|---|---|---|---|---|---|---|---|---|
| Foster care maintenance rates for 2 year-olds | |||||||||
| Unemployment | −9.27 | −7.35 | −6.09 | ||||||
| % Minority children | −0.32 | 1.77 | 5.85 | ||||||
| Poverty rate | −3.80 | −1.82 | −3.58 | ||||||
| Urbanicity | −10.82* | −10.82 | −11.23 | ||||||
| Partial Republican Control of State Government | −17.44 | −47.63* | −46.94 | ||||||
| Republican Controlled State Government | −20.77 | −62.79* | −68.20* | ||||||
| Log real per foster child Title IV B funding | −13.93 | −24.36 | −11.75 | ||||||
| Log real per foster child Title IV E funding | 4.60 | 10.44 | 9.92 | ||||||
| TANF*FMAP | 0.38* | 0.47** | 0.44** | ||||||
| Share of state population on TANF | 13.66 | 11.45 | 10.81 | ||||||
| Real per capita tax revenue | 9.37 | 19.82 | 17.31 | ||||||
| CFSR Complete | −1.50 | −1.12 | 10.13 | ||||||
| 1st Title IVE eligibility review | 0.30 | 1.99 | −0.41 | ||||||
| 2nd Title IVE eligibility review | 2.68 | 3.21 | 7.64 | ||||||
| Lawsuit filed | −22.74 | −24.85 | −22.41 | ||||||
| Settlement reached | −16.19 | 2.80 | 4.58 | ||||||
| State fixed effects | Yes | Yes | Yes | Yes | Yes | Yes | Yes | Yes | Yes |
| Year fixed effects | Yes | Yes | Yes | Yes | Yes | Yes | Yes | No | Yes |
| Constant | 955.89*** | 435.54*** | 210.27*** | 380.01*** | 385.68*** | 805.12** | 377.68*** | 380.26*** | |
| Observations | 213 | 213 | 213 | 213 | 213 | 213 | 213 | 213 | 213 |
| Adjusted R-squared | (0.704–0.774) | 0.787 | 0.801 | 0.793 | 0.780 | 0.784 | 0.811 | 0.781 | 0.784 |
| Foster care maintenance rates for 9 year-olds | |||||||||
| Unemployment | −9.98 | −9.07 | −7.92 | ||||||
| % Minority children | 0.34 | 1.97 | 6.06 | ||||||
| Poverty rate | −2.66 | −0.44 | −2.13 | ||||||
| Urbanicity | −10.28* | −10.79 | −11.32 | ||||||
| Partial Republican Control of State Government | −20.19 | −50.61* | −50.39 | ||||||
| Republican Controlled State Government | −18.64 | −63.28 | −67.78 | ||||||
| Log real per foster child Title IV B funding | −12.56 | −19.45 | −7.72 | ||||||
| Log real per foster child Title IV E funding | 0.82 | 5.00 | 4.19 | ||||||
| TANF*FMAP | 0.33* | 0.42** | 0.39** | ||||||
| Share of state population on TANF | 13.73 | 12.27 | 12.17 | ||||||
| Real per capita tax revenue | 12.28 | 22.07 | 19.47 | ||||||
| CFSR complete | −0.69 | −0.53 | 10.57 | ||||||
| 1st Title IVE eligibility review | −3.32 | −1.08 | −3.74 | ||||||
| 2nd Title IVE eligibility review | 4.45 | 4.14 | 8.02 | ||||||
| Lawsuit filed | −14.14 | −19.74 | −19.06 | ||||||
| Settlement reached | −7.62 | 7.47 | 10.25 | ||||||
| State fixed effects | Yes | Yes | Yes | Yes | Yes | Yes | Yes | Yes | Yes |
| Year fixed effects | Yes | Yes | Yes | Yes | Yes | Yes | Yes | No | Yes |
| Constant | 960.15*** | 468.18*** | 244.80*** | 412.45*** | 414.75*** | 827.48** | 405.91*** | 411.59*** | |
| Observations | 213 | 213 | 213 | 213 | 213 | 213 | 213 | 213 | 213 |
| Adjusted R-squared | (0.659–0.694) | 0.704 | 0.723 | 0.708 | 0.695 | 0.699 | 0.727 | 0.697 | 0.701 |
| Foster care maintenance rates for 16 year-olds | |||||||||
| Unemployment | −12.60 | −12.62 | −10.89 | ||||||
| % Minority children | 0.64 | 1.68 | 5.21 | ||||||
| Poverty rate | −2.08 | 0.72 | −0.72 | ||||||
| Urbanicity | −9.58 | −10.30 | −9.53 | ||||||
| Partial Republican Control of State Government | −27.44 | −60.35** | −62.29* | ||||||
| Republican Controlled State Government | −15.23 | −68.47* | −76.31* | ||||||
| Log real per foster child Title IV B funding | −16.31 | −31.01 | −22.96 | ||||||
| Log real per foster child Title IV E funding | 8.26 | 16.36 | 15.45 | ||||||
| TANF*FMAP | 0.37* | 0.49** | 0.43** | ||||||
| Share of state population on TANF | 8.99 | 6.22 | 4.83 | ||||||
| Real per capita tax revenue | 12.38 | 22.24 | 18.22 | ||||||
| CFSR complete | −0.68 | −0.32 | 13.91 | ||||||
| 1st Title IVE eligibility review | 0.21 | 1.91 | −3.25 | ||||||
| 2nd Title IVE eligibility review | 2.61 | 3.13 | 6.73 | ||||||
| Lawsuit filed | −13.47 | −19.05 | −18.18 | ||||||
| Settlement reached | −7.12 | 7.44 | 8.59 | ||||||
| State fixed effects | Yes | Yes | Yes | Yes | Yes | Yes | Yes | Yes | Yes |
| Year fixed effects | Yes | Yes | Yes | Yes | Yes | Yes | Yes | No | Yes |
| Constant | 945.73** | 485.04*** | 227.76** | 420.99*** | 424.92*** | 748.93* | 420.03*** | 421.92*** | |
| Observations | 213 | 213 | 213 | 213 | 213 | 213 | 213 | 213 | 213 |
| Adjusted R-squared | (0.659–0.691) | 0.687 | 0.712 | 0.692 | 0.678 | 0.682 | 0.716 | 0.664 | 0.684 |
p < 0.1,
p < 0.05, and
p < 0.01.
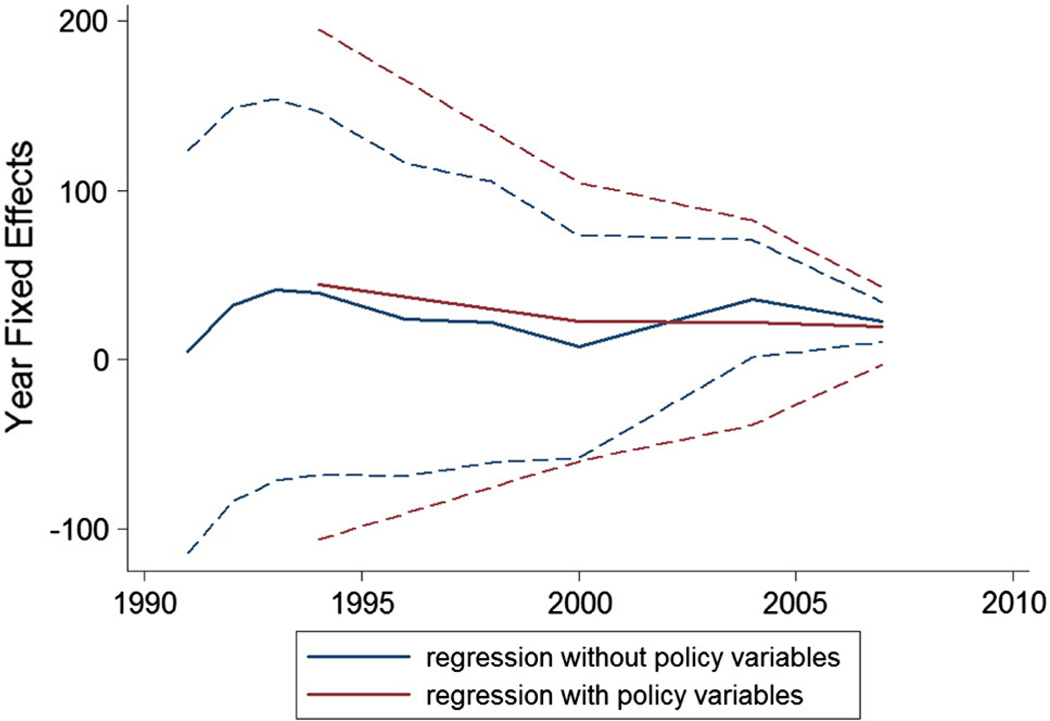
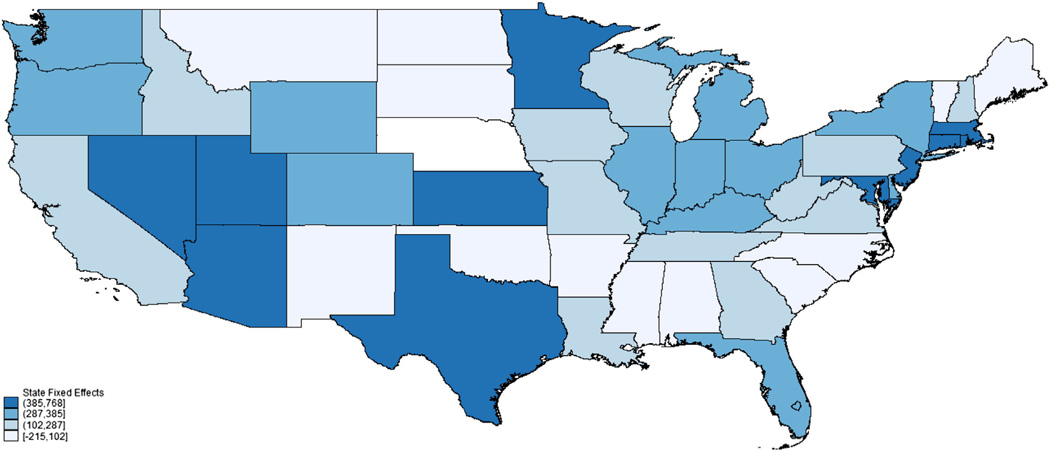
In multivariate analyses, these findings remained largely the same, with the effect of Republic state government control having a p-value below 0.10 and the effect a higher federal share of TANF payments having a p-value below 0.05. Importantly, the proportion of variation explained by budgetary and federal policy variables is low (approximately 25%, data not shown) and likely related to state-level factors not included explicitly in the models, as evidenced by the 68–78% of the variation in state foster care maintenance rates explained by state and year fixed effects and the only 3% increase in explanatory power of adding all variables included in the multivariate regressions. When we repeated these analyses with nominal state foster care maintenance rates, the results were similar (Appendix Table 2). In general, the year fixed effects show a general trend towards lower inflation-adjusted foster care maintenance rates (Appendix Fig. 18), but the state fixed effects do not show strong regional patterns (Appendix Fig. 19).
Appendix Table 2.
Relationship of state revenue, federal subsidies and programs, and legal challenges as well as to socioeconomic, demographic and political factors to nominal state foster care maintenance rates from 1994 to 2008.
| Univariate | Multivariate | Fixed effect only | |||||||
|---|---|---|---|---|---|---|---|---|---|
| Foster care maintenance rates for 2 year–olds | |||||||||
| Unemployment | −9.04 | −8.81 | −7.97 | ||||||
| % Minority children | 3.26 | 4.48 | 7.67 | ||||||
| Poverty rate | −0.66 | 1.04 | 0.16 | ||||||
| Urbanicity | −8.63* | −10.66 | −10.79* | ||||||
| Partial Republican Control of State Government | −19.01 | −41.40 | −42.74 | ||||||
| Republican Controlled State Government | −10.04 | −46.56 | −56.49 | ||||||
| Log real per capita Title IV B funding | −13.25 | −21.71 | −7.45 | ||||||
| Log real per foster child Title IV E funding | 5.38 | 10.77 | 5.94 | ||||||
| TANF*FMAP | 0.23 | 0.32** | 0.29** | ||||||
| Share of state population on TANF | 9.20 | 7.34 | 4.43 | ||||||
| Real per capita tax revenue | 8.79 | 15.50 | 15.14 | ||||||
| CFSR complete | −1.99 | −1.17 | 10.19 | ||||||
| 1st Title IVE eligibility review | 2.65 | 5.46 | −0.53 | ||||||
| 2nd Title IVE eligibility review | 3.77 | 5.25 | 8.04 | ||||||
| Lawsuit filed | −21.77* | −20.52 | −18.08 | ||||||
| Settlement reached | −17.35** | −1.67 | −3.85 | ||||||
| State fixed effects | Yes | Yes | Yes | Yes | Yes | Yes | Yes | Yes | Yes |
| Year fixed effects | Yes | Yes | Yes | Yes | Yes | Yes | Yes | No | Yes |
| Constant | 822.48*** | 384.68*** | 267.18*** | 339.41*** | 346.98*** | 653.93** | 333.00*** | 341.64*** | |
| Observations | 213 | 213 | 213 | 213 | 213 | 213 | 213 | 213 | 213 |
| Adjusted R-squared | 0.821–0.826 | 0.827 | 0.834 | 0.825 | 0.819 | 0.823 | 0.841 | 0.656 | 0.822 |
| Foster care maintenance rates for 9 year-olds | |||||||||
| Unemployment | −10.05 | −10.66 | −9.73 | ||||||
| % Minority children | 3.26 | 3.94 | 7.37 | ||||||
| Poverty rate | 0.01 | 2.00 | 1.04 | ||||||
| Urbanicity | −7.53 | −9.63 | −10.04 | ||||||
| Partial Republican Control of State Government | −21.49 | −44.70* | −46.16 | ||||||
| Republican Controlled State Government | −8.85 | −48.29 | −56.52 | ||||||
| Log real per capita Title IV B funding | −9.36 | −14.63 | −2.28 | ||||||
| Log real per foster child Title IV E funding | 2.48 | 5.51 | 0.99 | ||||||
| TANF*FMAP | 0.21 | 0.29* | 0.26* | ||||||
| Share of state population on TANF | 9.67 | 8.73 | 6.72 | ||||||
| Real per capita tax revenue | 12.53 | 19.13 | 18.17 | ||||||
| CFSR complete | −0.85 | −0.32 | 10.60 | ||||||
| 1st Title IVE eligibility review | −1.17 | 1.95 | −3.69 | ||||||
| 2nd Title IVE eligibility review | 5.16 | 5.70 | 8.05 | ||||||
| Lawsuit filed | −13.21 | −16.01 | −15.42 | ||||||
| Settlement reached | −8.51 | 3.73 | 3.21 | ||||||
| State fixed effects | Yes | Yes | Yes | Yes | Yes | Yes | Yes | Yes | Yes |
| Year fixed effects | Yes | Yes | Yes | Yes | Yes | Yes | Yes | No | Yes |
| Constant | 805.15*** | 414.02*** | 300.78*** | 367.71*** | 371.86*** | 651.75** | 357.00*** | 368.78*** | |
| Observations | 213 | 213 | 213 | 213 | 213 | 213 | 213 | 213 | 213 |
| Adjusted R-squared | 0.769–0.776 | 0.775 | 0.786 | 0.772 | 0.766 | 0.769 | 0.790 | 0.557 | 0.770 |
| Foster care maintenance rates for 16 year-olds | |||||||||
| Unemployment | −11.76 | −12.62 | −11.48 | ||||||
| % Minority children | 4.39 | 4.58 | 7.37 | ||||||
| Poverty rate | 0.40 | 2.44 | 1.66 | ||||||
| Urbanicity | −5.71 | −8.19 | −7.58 | ||||||
| Partial Republican Control of State Government | −27.19 | −53.12* | −56.56** | ||||||
| Republican Controlled State Government | −7.08 | −53.94* | −64.74* | ||||||
| Log real per capita title IV B funding | −13.46 | −23.64 | −14.38 | ||||||
| Log real per foster child Title IV E funding | 8.19 | 14.16 | 9.64 | ||||||
| TANF*FMAP | 0.20 | 0.30** | 0.27* | ||||||
| Share of state population on TANF | 6.83 | 4.95 | 2.09 | ||||||
| Real per capita tax revenue | 12.83 | 18.85 | 17.49 | ||||||
| CFSR complete | −1.56 | −0.52 | 12.84 | ||||||
| 1st Title IVE eligibility review | 3.35 | 6.99 | −0.73 | ||||||
| 2nd Title IVE eligibility review | 4.75 | 6.67 | 8.37 | ||||||
| Lawsuit filed | −12.78 | −17.18 | −16.16 | ||||||
| Settlement reached | −7.26 | 5.88 | 4.16 | ||||||
| State fixed effects | Yes | Yes | Yes | Yes | Yes | Yes | Yes | Yes | Yes |
| Year fixed effects | Yes | Yes | Yes | Yes | Yes | Yes | Yes | No | Yes |
| Constant | 712.17** | 430.89*** | 301.31*** | 375.56*** | 382.17*** | 513.88 | 369.00*** | 379.28*** | |
| Observations | 213 | 213 | 213 | 213 | 213 | 213 | 213 | 213 | 213 |
| Adjusted R-squared | 0.750–0.755 | 0.756 | 0.773 | 0.753 | 0.747 | 0.750 | 0.776 | 0.539 | 0.751 |
p < 0.1,
p < 0.05, and
p < 0.01.
Appendix Fig. 18.
Year fixed effects from multivariate regression including socio demographic, economic, and political variables with and without policy variables for 2 year-olds. Shown in the figure above are the year fixed effects for the multivariate regressions examining inflation adjusted fixed with and without policy variables. Other than in early years, there is not a substantial year trend and, given the wide confidence interval, none that is statistically distinct from zero. This suggests that, after adjusting for other predictors in the model and state fixed effects, inflation adjustment actually accounts explains most of the time trend in state foster care maintenance rates observed when they are examined in nominal terms.
Appendix Fig. 19.
State fixed effects from multivariate regression including socio-demographic, economic, political, policy variables of 2 year-olds. Shown in the figure are the state fixed effects categorized into quartiles above and below the median state. Darker blue denotes higher state fixed effects and lighter blue and white denote lower state fixed effect values. While it appears that the north east and some of the West and Southwest have higher state fixed effects and that the South has lower state fixed effects, there are notable exceptions in all of these regions. To make the map more readable, Hawaii and Alaska are not shown. The values of the state fixed effects for Hawaii is $217 and for Alaska is $219.
3.4. The relationship of state foster care maintenance rates and measures of state Child system outcomes
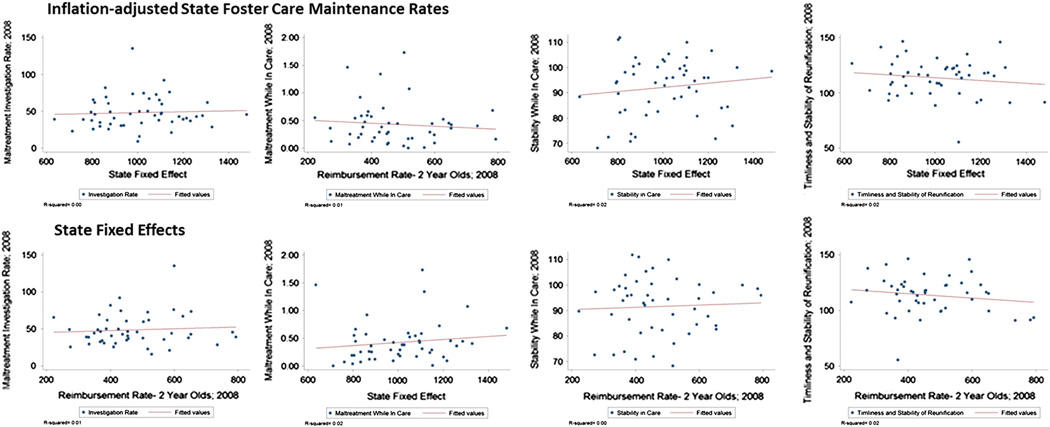
The relationship between state foster care maintenance rates and Child Welfare outcomes is not necessarily causal (i.e., that more spending on foster care maintenance rates causes improvements in measures of state Child Welfare system outcomes) but rather could simply indicate that states who spend more on foster care maintenance rates also invest in other ways in their Child Welfare systems. We compared both the unadjusted state foster care maintenance rates and estimated state fixed effects, which represent state–level differences not accounted for by the other factors explicitly included in the multivariate models, with a range of measures reported in the 2008 Child Welfare Outcomes Report of the Department of Health and Human Services (Fig. 2). We find no strong relationship between state fixed effects representing foster care maintenance rates after adjustment and the following outcomes measures: 1) rates of maltreatment investigation that may result in foster care placements; 2) rates of maltreatment while in foster care; 3) foster care placement stability; and 4) timeliness and stability of reunification of children who leave foster care. Because these Child Welfare Outcomes Reports have only become available in recent years, we used cross-sectional regressions without state fixed-effects to examine each outcome's relationship to the same set of state characteristics used to predict state foster care maintenance rates above. We find some limited evidence that federal funding and reviews may influence maltreatment investigations or the rate and stability of reunification out of foster care, though the explained variance is a small proportion of the overall variance (Appendix Table 3). This underscores the idiosyncratic nature maintenance rate setting at the state level and the link between spending and systems outcomes which are relevant when considering the cost-effectiveness of dissemination and implementation interventions regarding evidence-based practices.
Fig. 2.
Relationship of Child Welfare outcomes and state foster care maintenance rates and state fixed effects in 2008. Shown in the figure panels are scatter plots of state Child Welfare outcomes in 2008 (blue circles) versus state foster care maintenance rates for 2 year-olds (upper panels) and state fixed effects estimated from the full multivariate models for 2 year-olds (lower panels). From left to right, the panels show Child Welfare outcomes including maltreatment investigation rates, rates of maltreatment while in care, an index of placement stability while in care, and an index of the timeliness and stability of reunification for those who had been in care. Red lines show simple linear regressions between Child Welfare outcomes and the state foster care maintenance rates or state fixed effects, and R-squared measures of the strength of correlation are shown in the bottom left corner of each panel. (For interpretation of the references to color in this figure legend, the reader is referred to the web version of this article.)
Appendix Table 3.
Relationship of Child Welfare outcomes to predictors of foster care maintenance rates in 2008.
| Investigation rate | Maltreatment while in care | |||||||||
|---|---|---|---|---|---|---|---|---|---|---|
| Unemployment | 4.065 | 3.493 | 0.0569 | 0.0573 | ||||||
| % Minority children | −0.359 | −0.404 | 0.000551 | −0.00175 | ||||||
| Poverty rate | 1.944 | 2.359 | 0.0263 | 0.0404* | ||||||
| Urbanicity | 0.0496 | 0.0602 | 0.0065 | 0.00715 | ||||||
| Partial Republican Control of State Government | −0.734 | 14.31 | −0.104 | 0.0628 | ||||||
| Republican Controlled State Government | −17.02** | −4.545 | 0.00687 | 0.0863 | ||||||
| Log real per foster child Title IV B funding | −17.82** | −13.73 | −0.181 | 0.0197 | ||||||
| Log real per foster child Title IV E funding | −0.745 | 0.603 | 0.0764 | −0.0371 | ||||||
| TANF*FMAP | −0.107** | −0.0769 | −0.00121 | 0.000355 | ||||||
| Share of state population on TANF | 6.837* | 4.385 | −0.0413 | −0.226** | ||||||
| Real per capita tax revenue | 1.078 | 2.377 | 0.00284 | 0.00705 | ||||||
| 2nd Title IVE eligibility review | 12.43* | 6.569 | 0.243** | 0.250** | ||||||
| Lawsuit filed | 2.911 | 6.514 | 0.122 | 0.142 | ||||||
| Settlement reached | −2.339 | −2.495 | 0.479* | 0.407 | ||||||
| Constant | 14.85 | 51.30*** | 6.332 | 43.14*** | −34.21 | −0.636 | 0.481*** | 0.21 | 0.266*** | −0.813 |
| Observations | 50 | 49 | 50 | 50 | 49 | 49 | 48 | 49 | 49 | 48 |
| R-squared | 0.134 | 0.087 | 0.178 | 0.082 | 0.404 | 0.166 | 0.021 | 0.051 | 0.378 | 0.544 |
| Stability In Care | Timeliness and Stability of Reunification | |||||||||
| Unemployment | 0.349 | 0.283 | −1.704 | −0.697 | ||||||
| % Minority children | −0.0645 | 0.0931 | 0.164 | 0.152 | ||||||
| Poverty rate | −0.153 | −0.819 | 0.916 | −0.0248 | ||||||
| Urbanicity | 0.158 | 0.0674 | −0.241 | −0.216 | ||||||
| Partial Republican Control of State Government | −1.755 | −2.12 | 4.472 | 5.457 | ||||||
| Republican Controlled State Government | 0.912 | 0.463 | −8.212 | −8.514 | ||||||
| Log real per foster child Title IV B funding | −2.531 | −9.288 | 13.38** | 19.00*** | ||||||
| Log real per foster child Title IV E funding | 4.313 | 5.126 | −12.02** | −13.73*** | ||||||
| TANF*FMAP | −0.0127 | −0.0362 | −0.0374 | −0.0222 | ||||||
| Share of state population on TANF | 0.0713 | 1.926 | 2.064 | 2.993 | ||||||
| Real per capita tax revenue | −0.508 | −1.485 | 0.574 | 1.088 | ||||||
| 2nd Title IVE eligibility review | −3.093 | −4.899 | −0.152 | 3.906 | ||||||
| Lawsuit filed | −8.05 | −17.45** | 9.857 | 22.12** | ||||||
| Settlement reached | 8.502 | 14.97 | −11.73 | −16.94* | ||||||
| Constant | 83.52*** | 93.15*** | 91.01*** | 93.84*** | 82.02*** | 121.4*** | 112.6*** | 152.1*** | 113.3*** | 171.2*** |
| Observations | 50 | 49 | 50 | 50 | 49 | 50 | 49 | 50 | 50 | 49 |
| R-squared | 0.039 | 0.01 | 0.036 | 0.056 | 0.208 | 0.09 | 0.083 | 0.253 | 0.022 | 0.453 |
p < 0.1
p < 0.05, and
p < 0.01.
3.5. Robustness of findings
The main results of the analysis remained the same when we used 2, 3 or 4 year lags instead of 1 year lags for predictors (Appendix Table 4). Likewise, results remained the same when we used alternative multivariate specifications such as different windows of time for when policy changes (e.g., CFSR reviews) and legal challenges could impact outcomes (Appendix Table 5) or when we considered which political party had control of the state government and also the strength of that political majority (Appendix Table 6). We assessed the potential for issues of multicollinearity given that the regressions we estimated examined between 213 and 492 state-year observations and included 1–15 regressors which themselves may be correlated in addition to fixed effects for each 50 states and for each year included the regressions. We estimated the correlation matrices for all predictors, and computed the condition indices for each regression specification. Condition indices ranged from 29.91 to 57.92, below the threshold of 100.00 typically deemed to be an indicator of a severe multicollinearity problem. We explored reducing the number of covariates to increase the degrees of freedom in the regression, for example using year and year-squared instead year fixed effects (Appendix Table 7) which showed that the main results remained unchanged. Further, we explored using a random effects model instead of a fixed effects model again to increase our available degrees of freedom. Specifically, we used a Sargan–Hansen test statistic to determine whether we can gain estimation efficiency by using a random effects specification (Appendix Table 8). However, we could not use a random effects model because our tests rejected the null hypothesis (p < 0.001) that the state fixed effects are sufficiently orthogonal.
Appendix Table 4.
Sensitivity to defining the window of effect from reviews, lawsuits and settlements.
| Univariate |
Multivariate |
|||||||
|---|---|---|---|---|---|---|---|---|
| 1 year | 3 year | 4 year | 5 year | 1 year | 3 year | 4 year | 5 year | |
| Foster care maintenance rates for 2 year-olds | ||||||||
| Unemployment | −9.27 | −9.27 | −9.27 | −9.27 | −5.42 | −6.09 | −6.18 | −5.17 |
| % Minority children | −0.32 | −0.32 | −0.32 | −0.32 | 6.46 | 5.85 | 6.64 | 6.86 |
| Poverty rate | −3.80 | −3.80 | −3.80 | −3.80 | −4.68 | −3.58 | −4.02 | −3.87 |
| Urbanicity | −10.82* | −10.82* | −10.82* | −10.82* | −10.86 | −11.23 | −11.50 | −12.32* |
| Partial Republican Control of State Government | −17.44 | −17.44 | −17.44 | −17.44 | −45.36 | −46.94 | −45.01 | −44.46 |
| Republican Controlled State Government | −20.77 | −20.77 | −20.77 | −20.77 | −63.88* | −68.20* | −66.51* | −68.49* |
| Log real per capita title IV B funding | −13.93 | −13.93 | −13.93 | −13.93 | −11.76 | −11.75 | −10.69 | −9.83 |
| Log real per foster child Title IV E funding | 4.60 | 4.60 | 4.60 | 4.60 | 13.40 | 9.92 | 10.79 | 10.81 |
| TANF*FMAP | 0.38* | 0.38* | 0.38* | 0.38* | 0.46** | 0.44** | 0.47** | 0.45** |
| Share of state population on TANF | 13.66 | 13.66 | 13.66 | 13.66 | 12.97 | 10.81 | 11.25 | 8.98 |
| Real per capita tax revenue | 9.37 | 9.37 | 9.37 | 9.37 | 18.87 | 17.31 | 16.74 | 15.02 |
| CFSR complete | −10.41 | −1.50 | −12.03 | −14.76 | −20.80 | 10.13 | −11.90 | −23.23 |
| 1st Title IVE eligibility review | −5.61 | 0.30 | 0.61 | −10.78 | −4.29 | −0.41 | −0.93 | −19.91 |
| 2nd Title IVE eligibility review | 0.92 | 2.68 | 17.58* | 27.43* | 5.73 | 7.64 | 23.54** | 36.53* |
| Lawsuit filed | −31.00 | −22.74 | −21.65 | −19.32 | −25.73 | −22.41 | −21.36 | −15.51 |
| Settlement reached | −1.14 | −16.19 | −14.84 | −10.97 | 27.25 | 4.58 | 7.72 | 3.08 |
| Constant | 743.19** | 805.12** | 810.56** | 788.47*** | ||||
| Observations | 213 | 213 | 213 | 213 | 213 | 213 | 213 | 213 |
| Adjusted R-squared | 0.782–0.790 | 0.782–0.790 | 0.782–0.790 | 0.782–0.790 | 0.811 | 0.811 | 0.814 | 0.817 |
| Foster care maintenance rates for 9 year-olds | ||||||||
| Unemployment | −9.98 | −9.98 | −9.98 | −9.98 | −7.06 | −7.92 | −7.58 | −6.67 |
| % Minority children | 0.34 | 0.34 | 0.34 | 0.34 | 6.80 | 6.06 | 6.91 | 6.99 |
| Poverty rate | −2.66 | −2.66 | −2.66 | −2.66 | −2.98 | −2.13 | −2.67 | −2.50 |
| Urbanicity | −10.28* | −10.28* | −10.28* | −10.28* | −11.05 | −11.32 | −11.71 | −12.50* |
| Partial Republican Control of State Government | −20.19 | −20.19 | −20.19 | −20.19 | −47.59 | −50.39 | −48.00 | −47.32 |
| Republican Controlled State Government | −18.64 | −18.64 | −18.64 | −18.64 | −64.18 | −67.78 | −65.49 | −66.93 |
| Log real per capita Title IV B funding | −12.56 | −12.56 | −12.56 | −12.56 | −7.07 | −7.72 | −5.42 | −5.15 |
| Log real per foster child Title IV E funding | 0.82 | 0.82 | 0.82 | 0.82 | 6.91 | 4.19 | 4.90 | 4.88 |
| TANF*FMAP | 0.33* | 0.33* | 0.33* | 0.33* | 0.41** | 0.39** | 0.42** | 0.40** |
| Share of state population on TANF | 13.73 | 13.73 | 13.73 | 13.73 | 12.86 | 12.17 | 12.62 | 10.51 |
| Real per capita tax revenue | 12.28 | 12.28 | 12.28 | 12.28 | 21.26 | 19.47 | 19.03 | 17.24 |
| CFSR complete | −21.63 | −0.69 | −14.50 | −17.80 | −34.84 | 10.57 | −15.29 | −26.82 |
| 1st Title IVE eligibility review | −7.55 | −3.32 | −2.31 | −12.35 | −11.22 | −3.74 | −4.53 | −23.07 |
| 2nd Title IVE eligibility review | 0.84 | 4.45 | 17.06* | 25.02* | 4.14 | 8.02 | 23.16* | 34.62* |
| Lawsuit filed | −33.37 | −14.14 | −13.64 | −11.98 | −24.60 | −19.06 | −17.31 | −11.35 |
| Settlement reached | −11.56 | −7.62 | −7.32 | −4.11 | 16.14 | 10.25 | 12.33 | 7.39 |
| Constant | 755.01** | 827.48** | 841.86** | 814.10** | ||||
| Observations | 213 | 213 | 213 | 213 | 213 | 213 | 213 | 213 |
| Adjusted R-squared | 0.699–0.705 | 0.699–0.706 | 0.699–0.706 | 0.699–0.706 | 0.728 | 0.727 | 0.731 | 0.735 |
| Foster care maintenance rates for 16 year-olds | ||||||||
| Unemployment | −12.60 | −12.60 | −12.60 | −12.60 | −9.74 | −10.89 | −10.71 | −9.64 |
| % Minority children | 0.64 | 0.64 | 0.64 | 0.64 | 5.78 | 5.21 | 6.02 | 6.31 |
| Poverty rate | −2.08 | −2.08 | −2.08 | −2.08 | −1.55 | −0.72 | −1.23 | −1.08 |
| Urbanicity | −9.58 | −9.58 | −9.58 | −9.58 | −9.22 | −9.53 | −9.93 | −10.52 |
| Partial Republican Control of State Government | −27.44 | −27.44 | −27.44 | −27.44 | −59.78** | −62.29* | −59.98** | −59.58** |
| Republican Controlled State Government | −15.23 | −15.23 | −15.23 | −15.23 | −72.34* | −76.31* | −73.63* | −75.62* |
| Log real per capita Title IV B funding | −16.31 | −16.31 | −16.31 | −16.31 | −22.67 | −22.96 | −21.33 | −20.88 |
| Log real per foster child Title IV E funding | 8.26 | 8.26 | 8.26 | 8.26 | 18.36 | 15.45 | 16.09 | 15.90 |
| TANF*FMAP | 0.37* | 0.37* | 0.37* | 0.37* | 0.44** | 0.43** | 0.46** | 0.44** |
| Share of state population on TANF | 8.99 | 8.99 | 8.99 | 8.99 | 6.00 | 4.83 | 5.47 | 3.27 |
| Real per capita tax revenue | 12.38 | 12.38 | 12.38 | 12.38 | 19.99 | 18.22 | 17.81 | 16.56 |
| CFSR complete | −13.88 | −0.68 | −12.55 | −13.17 | −20.43 | 13.91 | −10.98 | −20.25 |
| 1st Title IVE eligibility review | 2.16 | 0.21 | −3.08 | −13.56 | 3.50 | −3.25 | −3.65 | −22.37 |
| 2nd Title IVE eligibility review | −3.30 | 2.61 | 16.79* | 26.16* | 2.64 | 6.73 | 23.80* | 35.63* |
| Lawsuit filed | −34.67 | −13.47 | −11.91 | −10.46 | −19.67 | −18.18 | −15.68 | −11.06 |
| Settlement reached | −20.03* | −7.12 | −6.10 | −2.90 | 8.20 | 8.59 | 10.72 | 6.67 |
| Constant | 673.36 | 748.93* | 762.57* | 703.00* | ||||
| Observations | 213 | 213 | 213 | 213 | 213 | 213 | 213 | 213 |
| Adjusted R-squared | 0.682–0.693 | 0.682–0.690 | 0.682–0.690 | 0.682–0.693 | 0.716 | 0.716 | 0.719 | 0.723 |
p < 0.1,
p < 0.05, and
p < 0.01
Appendix Table 5.
Sensitivity to lag specification.
| Univariate |
Multivariate |
|||||
|---|---|---|---|---|---|---|
| 1 year lags | 2 year lags | 3 year lags | 1 year lags | 2 year lags | 3 year lags | |
| Foster care maintenance rates for 2 year-olds | ||||||
| Unemployment | −15.79* | −11.09 | −14.46* | −6.09 | −6.74 | −13.19 |
| % Minority children | −1.24 | −0.58 | 0.29 | 5.85 | 7.94 | 2.45 |
| Poverty rate | −2.54 | −3.51 | −0.85 | −3.58 | −0.33 | 3.03 |
| Urbanicity | 4.31 | 2.90 | 0.90 | −11.23 | −4.03 | −10.83 |
| Partial Republican Control of State Government | −36.20* | −34.38 | −20.99 | −46.94 | −48.67** | −26.32 |
| Republican Controlled State Government | −44.22** | −46.30* | −34.99 | −68.20* | −71.94*** | −61.49*** |
| Log real per capita Title IV B funding | −11.75 | −41.03* | −18.02 | |||
| Log real per foster child Title IV E funding | 9.92 | −4.62 | −0.46 | |||
| TANF*FMAP | 0.44** | 0.68*** | 0.60** | |||
| Share of state population on TANF | 10.81 | 5.65 | 5.60 | |||
| Real per capita tax revenue | 17.31 | 45.38* | 31.26** | |||
| CFSR complete | 10.13 | 3.52 | −5.96 | |||
| 1st Title IVE eligibility review | −0.41 | 16.42 | 15.45 | |||
| 2nd Title IVE eligibility review | 7.64 | 27.05* | 22.57 | |||
| Lawsuit filed | −22.41 | −14.25 | −16.75 | |||
| Settlement reached | 4.58 | −2.95 | 6.28 | |||
| Constant | 281.51 | 339.66 | 431.61 | 805.12** | 165.41 | 775.91* |
| Observations | 472 | 423 | 374 | 213 | 200 | 165 |
| Adjusted R-squared | 0.740 | 0.737 | 0.726 | 0.811 | 0.860 | 0.889 |
| Foster care maintenance rates for 9 year-olds | ||||||
| Unemployment | −15.82** | −11.88 | −15.10** | −7.92 | −6.41 | −16.71 |
| % Minority children | −0.32 | 0.23 | 0.67 | 6.06 | 6.49 | −0.96 |
| Poverty rate | −2.34 | −3.15 | −0.87 | −2.13 | 0.62 | 3.18 |
| Urbanicity | 4.38 | 3.02 | 0.75 | −11.32 | −2.66 | −7.98 |
| Partial Republican Control of State Government | −34.83* | −37.04 | −21.06 | −50.39 | −51.43** | −23.81 |
| Republican Controlled State Government | −43.90* | −46.87* | −33.95 | −67.78 | −64.65** | −47.07* |
| Log real per capita Title IV B funding | −7.72 | −44.83* | −23.54 | |||
| Log real per foster child Title IV E funding | 4.19 | −9.10 | −1.99 | |||
| TANF*FMAP | 0.39** | 0.65*** | 0.48* | |||
| Share of state population on TANF | 12.17 | 4.46 | 6.04 | |||
| Real per capita tax revenue | 19.47 | 56.24* | 24.91 | |||
| CFSR complete | 10.57 | 5.53 | −7.50 | |||
| 1st Title IVE eligibility review | −3.74 | 14.12 | 8.60 | |||
| 2nd Title IVE eligibility review | 8.02 | 24.43 | 13.83 | |||
| Lawsuit filed | −19.06 | −12.59 | −14.15 | |||
| Settlement reached | 10.25 | 7.10 | 19.59 | |||
| Constant | 263.21 | 326.15 | 459.64 | 827.48** | 119.27 | 798.14* |
| Observations | 472 | 423 | 374 | 213 | 200 | 165 |
| Adjusted R-squared | 0.707 | 0.698 | 0.676 | 0.727 | 0.792 | 0.819 |
| Foster care maintenance rates for 16 year-olds | ||||||
| Unemployment | −14.31* | −9.71 | −13.81* | −10.89 | −4.12 | −16.40 |
| % Minority children | 0.76 | 1.50 | 1.68 | 5.21 | 6.80 | −0.47 |
| Poverty rate | −3.26 | −4.99* | −1.64 | −0.72 | 0.16 | 3.68 |
| Urbanicity | 5.44 | 4.23 | 1.99 | −9.53 | −3.08 | −6.80 |
| Partial Republican Control of State Government | −35.74* | −40.96* | −23.89 | −62.29* | −63.86** | −38.48 |
| Republican Controlled State Government | −44.56* | −52.17** | −38.77 | −76.31* | −77.07*** | −61.93** |
| Log real per capita Title IV B funding | −22.96 | −69.39** | −38.62 | |||
| Log real per foster child Title IV E funding | 15.45 | 6.59 | 9.76 | |||
| TANF*FMAP | 0.43** | 0.77*** | 0.52** | |||
| Share of state population on TANF | 4.83 | 1.83 | −1.46 | |||
| Real per capita tax revenue | 18.22 | 61.54* | 26.56 | |||
| CFSR Complete | 13.91 | 5.29 | −3.84 | |||
| 1st Title IVE eligibility review | −3.25 | 13.87 | 10.21 | |||
| 2nd Title IVE eligibility review | 6.73 | 31.74** | 16.53 | |||
| Lawsuit filed | −18.18 | −19.83 | −7.30 | |||
| Settlement reached | 8.59 | 13.36 | 7.08 | |||
| Constant | 167.27 | 229.33 | 386.44 | 748.93* | 121.26 | 697.33 |
| Observations | 472 | 423 | 374 | 213 | 200 | 165 |
| Adjusted R-squared | 0.706 | 0.703 | 0.678 | 0.716 | 0.775 | 0.809 |
p < 0.1,
p < 0.05, and
p < 0.01.
Appendix Table 6.
Alternate political specification.
| Univariate | Multivariate | Fixed effects only | ||||
|---|---|---|---|---|---|---|
| Foster care maintenance rates for 2 year-olds | ||||||
| Unemployment | −19.76** | −17.30** | −14.18 | |||
| % Minority children | −7.80 | −7.11 | −2.03 | |||
| Poverty rate | −5.59* | −1.76 | −2.49 | |||
| Urbanicity | −3.58 | 2.28 | 4.62 | |||
| Republican Share of State Legislature | −0.07 | 0.42 | 0.44 | |||
| Republican Governor | −23.16* | 27.09 | 19.62 | |||
| Republican Governor*Republican Share of State Legislature | −0.45* | −1.01 | −0.83 | |||
| Constant | 599.13* | 324.62*** | 238.39 | 337.05*** | 335.10*** | |
| Observations | 472–492 | 492 | 472 | 472 | 492 | 492 |
| Adjusted R-squared | 0.705–0.728 | 0.726 | 0.727 | 0.735 | 0.705 | 0.705 |
| Foster care maintenance rates for 9 year-olds | ||||||
| Unemployment | −19.72** | −17.49** | −14.54* | |||
| % Minority children | −7.19 | −6.51 | −0.98 | |||
| Poverty rate | −5.29* | −1.57 | −2.19 | |||
| Urbanicity | −3.32 | 2.17 | 4.84 | |||
| Republican Share of State Legislature | 0.04 | 0.44 | 0.54 | |||
| Republican Governor | −23.46* | 19.40 | 10.66 | |||
| Republican Governor*Republican Share of State Legislature | −0.43 | −0.84 | −0.64 | |||
| Constant | 606.43* | 353.51*** | 204.91 | 368.05*** | 363.13*** | |
| Observations | 472–492 | 492 | 472 | 472 | 492 | 492 |
| Adjusted R-squared | 0.660–0.694 | 0.683 | 0.693 | 0.701 | 0.662 | 0.660 |
| Foster care maintenance rates for 16 year-olds | ||||||
| Unemployment | −17.84** | −15.29* | −13.72* | |||
| % Minority children | −6.34 | −5.68 | 0.22 | |||
| Poverty rate | −5.68** | −2.51 | −2.81 | |||
| Urbanicity | −2.18 | 2.89 | 6.31 | |||
| Republican Share of State Legislature | 0.54 | 0.86 | 1.05 | |||
| Republican Governor | −20.69 | 15.04 | 5.91 | |||
| Republican Governor*Republican Share of State Legislature | −0.34 | −0.67 | −0.49 | |||
| Constant | 537.04 | 341.13*** | 60.44 | 383.71*** | 365.07*** | |
| Observations | 472–492 | 492 | 472 | 472 | 492 | 492 |
| Adjusted R-squared | 0.682–0.691 | 0.677 | 0.691 | 0.699 | 0.662 | 0.660 |
p < 0.1,
p < 0.05, and
p < 0.01.
Appendix Table 7.
Results using an alternate specification for year-adjustments.
| Univariate | Multivariate | Fixed effects only | ||||
|---|---|---|---|---|---|---|
| Foster care maintenance rates for 2 year-olds | ||||||
| Unemployment | −8.99 | −6.65 | −7.37 | |||
| % Minority children | −7.55 | −7.07 | −1.22 | |||
| Poverty rate | −4.67* | −1.78 | −2.52 | |||
| Urbanicity | −3.5 | 1.58 | 3.81 | |||
| Partial Republican Control of State Government | −13.27 | −35.87* | −36.79* | |||
| Republican Controlled State Government | −8.1 | −39.92* | −42.81** | |||
| Constant | −285,606.58 | −889,819.60 | −653,128.36 | 337.05*** | −714,548.88 | |
| State fixed effects | Yes | Yes | Yes | Yes | Yes | Yes |
| Year and year * year | Yes | Yes | Yes | Yes | No | Yes |
| Observations | 472–492 | 492 | 472 | 472 | 492 | 492 |
| Adjusted R-squared | 0.711–0.729 | 0.72 | 0.734 | 0.739 | 0.705 | 0.708 |
| Foster care maintenance rates for 9 year-olds | ||||||
| Unemployment | −8.41 | −6.25 | −6.85 | |||
| % Minority children | −6.88 | −6.42 | −0.24 | |||
| Poverty rate | −4.33* | −1.66 | −2.39 | |||
| Urbanicity | −3.22 | 1.43 | 3.86 | |||
| Partial Republican Control of State Government | −12.08 | −34.14 | −35.62* | |||
| Republican Controlled State Government | −8.68 | −38.96 | −42.58* | |||
| Constant | −118,823.53 | −673,204.83 | −495,442.56 | 368.05*** | −512,298.98 | |
| State fixed effects | Yes | Yes | Yes | Yes | Yes | Yes |
| Year and year * year | Yes | Yes | Yes | Yes | No | Yes |
| Observations | 472–492 | 492 | 472 | 472 | 492 | 492 |
| Adjusted R-squared | 0.663–0.694 | 0.675 | 0.7 | 0.704 | 0.662 | 0.663 |
| Foster care maintenance rates for 16 year-olds | ||||||
| Unemployment | −6.84 | −4.34 | −5.56 | |||
| % Minority children | −6.07 | −5.67 | 0.77 | |||
| Poverty rate | −4.50* | −2.48 | −3.23 | |||
| Urbanicity | −2.1 | 2.16 | 4.92 | |||
| Partial Republican Control of State Government | −12.22 | −34.08 | −36.27* | |||
| Republican Controlled State Government | −8.36 | −38.59 | −43.20* | |||
| Constant | −362,432.65 | −811,500.79 | −682,632.12 | 383.71*** | −719,075.55 | |
| State fixed effects | Yes | Yes | Yes | Yes | Yes | Yes |
| Year and year * year | Yes | Yes | Yes | Yes | No | Yes |
| Observations | 472–492 | 492 | 472 | 472 | 492 | 492 |
| Adjusted R-squared | 0.662–0.692 | 0.671 | 0.7 | 0.703 | 0.662 | 0.663 |
p < 0.1,
p < 0.05, and
p < 0.01.
Appendix Table 8.
Assessment of using Random Effects (RE) instead of Fixed Effects (FE) to increase analytic power.
| Age 2 |
Age 9 |
Age 16 |
||||
|---|---|---|---|---|---|---|
| FE | RE | FE | RE | FE | RE | |
| Unemployment | −5.34 | −4.56 | −6.94 | −5.86 | −9.55 | −6.96 |
| % Minority children | 5.11 | 1.47 | 5.30 | 1.18 | 4.55 | 0.78 |
| Poverty rate | −3.15 | −2.83 | −1.87 | −1.44 | −0.63 | −0.92 |
| Urbanicity | −9.84* | −0.20 | −9.93* | 0.03 | −8.36 | 0.26 |
| Partial Republican Control of State Government | −41.12* | −43.26* | −44.13* | −47.09* | −54.57** | −57.54** |
| Republican Controlled State Government | −59.78** | −57.57** | −59.41* | −57.58** | −66.90** | −65.75** |
| Log real per foster child Title IV B funding | −10.33 | −25.12 | −6.80 | −26.72 | −20.17 | −38.98* |
| Log real per foster child Title IV E funding | 8.70 | 11.23 | 3.67 | 13.10 | 13.56 | 23.53 |
| TANF*FMAP | 0.38*** | 0.28** | 0.34** | 0.20** | 0.37*** | 0.24** |
| Share of state population on TANF | 9.50 | 7.27 | 10.69 | 7.77 | 4.25 | 2.33 |
| Real per capita tax revenue | 17.23 | 22.03 | 19.41 | 26.36 | 18.15 | 27.35 |
| CFSR complete | 8.91 | 15.17 | 9.29 | 17.42 | 12.22 | 20.69 |
| 1st Title IVE eligibility review | −0.34 | −0.90 | −3.27 | −3.25 | −2.84 | −1.34 |
| 2nd Title IVE eligibility review | 6.70 | 6.76 | 7.02 | 7.33 | 5.88 | 6.99 |
| Lawsuit filed | −19.68 | −22.84 | −16.74 | −17.66 | −15.96 | −13.68 |
| Settlement reached | 4.04 | 1.69 | 9.00 | 6.82 | 7.54 | 3.86 |
| 1994 | 19.23 | 28.01 | 16.54 | 30.61 | 53.34 | 63.05* |
| 2004 | −0.38 | −4.25 | 6.56 | 0.42 | −3.30 | −11.89 |
| 2007 | −2.24 | −7.57 | −3.07 | −10.47 | −16.41 | −23.82 |
| 2008 | −20.73 | −25.17 | −22.02 | −28.84 | −38.90 | −45.10** |
| Constant | 879.82*** | 297.17*** | 903.27*** | 305.53*** | 861.17** | 341.84*** |
| Observations | 213 | 213 | 213 | 213 | 213 | 213 |
| Number of States | 49 | 49 | 49 | 49 | 49 | 49 |
| Adjusted R-squared | 0.168 | 0.128 | 0.186 | |||
| Robust standard errors in parentheses | ||||||
| Sargan–Hansen Chi2 | 70.929 | 74.031 | 134.206 | |||
| P value | 0.000 | 0.000 | 0.000 | |||
p < 0.10;
p < 0.05;
p < 0.01.
The Sargan–Hansen test (xtoverid in Stata) produces a p-value < 0.05 which rejects the null hypothesis of orthogonality between the state effects and the residuals implying that it is not appropriate to use random effects instead of fixed effects.
3.6. Overall findings
Our analyses suggest that state foster care maintenance rates do not function as part of a social safety net that increases its support in harsher economic times. We also do not find strong evidence that federal policies and programs designed to improve the quality and responsiveness of the child welfare systems influence state foster care maintenance rates. Finally, lawsuits and consent decrees also do not appear to have this effect. Rather, state foster care maintenance rates differ markedly by state, and changes in these rates appear largely idiosyncratic. These findings differ from studies of drivers of spending in other child serving areas like Medicaid and argue for further research to develop a grounded theory of what drives and influences Child Welfare spending.
4. Discussion
State Child Welfare systems provide foster care maintenance rates to meet the needs of hundreds of thousands of foster children annually. After adjusting for inflation, in many states the real amount of resources provided for the care a foster child via the maintenance rates has actually declined from 1991 to 2008. Our study finds wide variation between states in the rates with little of the variation explained by demographic, economic, political, revenue, federal review, or legal variables, leading to the conclusion that states are highly idiosyncratic in how their foster care maintenance rates are determined. Higher foster care maintenance rates do not appear strongly related to Child Welfare outcomes which many interpret as measures of quality, though further study of outcomes is warranted. Policy designs that can encourage and incentivize the successful implementation of evidence-based interventions will be challenging given that the drivers of state foster care spending appear highly state-specific, justifying additional study.
The large share of variation in foster care maintenance rates unexplained by a variety of demographic, economic, and political theory is significant from a public policy perspective as well as from a dissemination and implementation perspective. From a public policy perspective, foster care maintenance rates appear detached from a countercyclical social safety net that responds with increasing support for vulnerable populations of foster children whose needs may be more acute in harsher economic climates. Some may interpret the lack of relationship between maintenance rates and economic cycles as evidence that the maintenance rates form part of a social safety net. However, this lack of relationship cuts both ways, as states with low foster care maintenance rates may not lower rates further but also do not appear likely to raise them during harsher economic times (See Appendix Table 9). From a dissemination and implementation perspective, launching and scaling-up evidence-based programs require a multi-year funding commitment, and their success may depend on the quality of the Child Welfare system in which they are implemented. Child Welfare spending on maintenance rates form a large part of foster care budgets. However, they do not appear to be linked to a variety of drivers that influence the demand for and quality of services, raising concern about the lack of predictability of changes in them or in other areas of spending that may modulate the effectiveness of newly implemented evidence based programs.
Appendix Table 9.
Comparison of results for analyses conducted only on states whose foster care maintenance rates were above the national median reimbursement rate in 1991 (high) or only on states that were below the median (low).
| Univariate |
Multivariate |
|||||||
|---|---|---|---|---|---|---|---|---|
| Low states | High states | Low states | High states | Low states | High states | Low states | High states | |
| Foster care maintenance rates for 2 year-olds | ||||||||
| Unemployment | −36.73** | −3.67 | −33.58** | −1.15 | −26.22 | −4.78 | ||
| % Minority children | −2.87 | −12.85* | −0.78 | −14.29* | 1.46 | −2.68 | ||
| Poverty rate | −8.66** | 0.08 | −3.37 | 3.10 | −3.62 | 1.66 | ||
| Urbanicity | −10.21 | −3.96 | −7.61 | 4.80 | −3.89 | 3.94 | ||
| Partial Republican Control of State Government | −21.70 | −3.65 | −36.55 | −23.85 | −33.74 | −24.08 | ||
| Republican Controlled State Government | 8.25 | −17.15 | −25.25 | −37.77 | −33.55 | −39.49* | ||
| Constant | 1054.23** | 1366.91* | 396.43*** | 418.33*** | 727.58* | 587.99 | ||
| State fixed effects | Yes | Yes | Yes | Yes | Yes | Yes | Yes | Yes |
| Year fixed effects | Yes | Yes | Yes | Yes | Yes | Yes | Yes | Yes |
| Observations | 232–242 | 240–250 | 242 | 250 | 232 | 240 | 232 | 240 |
| Adjusted R-squared | 0.443–0.523 | 0.727–0.779 | 0.527 | 0.756 | 0.503 | 0.782 | 0.547 | 0.780 |
| Foster care maintenance rates for 9 year-olds | ||||||||
| Unemployment | −35.87*** | −4.48 | −32.51** | −2.34 | −25.28* | −6.28 | ||
| % Minority children | −1.99 | −12.59* | 0.31 | −14.47* | 2.90 | −2.63 | ||
| Poverty rate | −8.59** | 0.40 | −3.64 | 3.26 | −3.76 | 2.08 | ||
| Urbanicity | −11.04 | −1.57 | −9.01 | 7.38 | −5.28 | 6.06 | ||
| Partial Republican Control of State Governmen | t −18.19 | −5.06 | −37.03 | −21.34 | −35.39 | −21.47 | ||
| Republican Controlled State Government | 1.91 | −12.00 | −32.04 | −30.45 | −42.08 | −33.16 | ||
| Constant | 1127.07** | 1127.18 | 433.40*** | 488.88*** | 777.61* | 394.31 | ||
| State fixed effects | Yes | Yes | Yes | Yes | Yes | Yes | Yes | Yes |
| Year fixed effects | Yes | Yes | Yes | Yes | Yes | Yes | Yes | Yes |
| Observations | 232–242 | 240–250 | 242 | 250 | 232 | 240 | 232 | 240 |
| Adjusted R-squared | 0.395–0.478 | 0.694–0.755 | 0.483 | 0.730 | 0.467 | 0.757 | 0.514 | 0.757 |
| Foster care maintenance rates for 16 year-olds | ||||||||
| Unemployment | −35.19*** | −1.50 | −31.55** | 1.01 | −23.54* | −5.31 | ||
| % Minority children | −0.74 | −12.12* | 1.64 | −14.14* | 4.25 | −1.60 | ||
| Poverty rate | −8.70** | −0.01 | −4.18 | 2.23 | −4.14 | 1.09 | ||
| Urbanicity | −10.37 | −0.85 | −8.98 | 7.95 | −5.21 | 6.46 | ||
| Partial Republican Control of State Governmen | t −14.84 | −9.21 | −30.46 | −25.98 | −30.92 | −25.79 | ||
| Republican Controlled State Government | 1.36 | −8.90 | −26.56 | −31.37 | −38.49 | −34.63 | ||
| Constant | 1105.35** | 1118.45 | 436.59*** | 597.46*** | 717.10* | 300.77 | ||
| State fixed effects | Yes | Yes | Yes | Yes | Yes | Yes | Yes | Yes |
| Year fixed effects | Yes | Yes | Yes | Yes | Yes | Yes | Yes | Yes |
| Observations | 232–242 | 240–250 | 242 | 250 | 232 | 240 | 232 | 240 |
| Adjusted R-squared | 0.441–0.512 | 0.699–0.761 | 0.516 | 0.729 | 0.508 | 0.765 | 0.548 | 0.763 |
| Fixed effects only |
||||||||
| Low states | High states | Low states | High states | |||||
| Foster care maintenance rates for 2 year-olds | ||||||||
| Constant | 337.05*** | 448.14*** | 369.49*** | 439.19*** | ||||
| State fixed effects | Yes | Yes | Yes | Yes | ||||
| Year fixed effects | No | No | Yes | Yes | ||||
| Observations | 242 | 250 | 242 | 250 | ||||
| Adjusted R-squared | 0.388 | 0.731 | 0.443 | 0.728 | ||||
| Foster care maintenance rates for 9 year-olds | ||||||||
| Constant | 368.05*** | 519.02*** | 393.70*** | 510.78*** | ||||
| State fixed effects | Yes | Yes | Yes | Yes | ||||
| Year fixed effects | No | No | Yes | Yes | ||||
| Observations | 242 | 250 | 242 | 250 | ||||
| Adjusted R-squared | 0.367 | 0.697 | 0.396 | 0.696 | ||||
| Foster care maintenance rates for 16 year-olds | ||||||||
| Constant | 383.71*** | 647.87*** | 401.55*** | 618.72*** | ||||
| State fixed effects | Yes | Yes | Yes | Yes | ||||
| Year fixed effects | No | No | Yes | Yes | ||||
| Observations | 242 | 250 | 242 | 250 | ||||
| Adjusted R-squared | 0.433 | 0.684 | 0.444 | 0.700 | ||||
p < 0.1,
p < 0.05, and
p < 0.01.
The very large between-state fixed effect indicates that much about how these rates are set arises from currently unknown sources. Key informant interviews may reveal systematic interstate differences which are presently unmeasured but which should be incorporated in future studies. Key informant interviews also may reveal a predominance of idiosyncratic factors, which lend themselves to a “path dependence” approach revealing how states arrive at the decisions they make through a series of historical contingencies (e.g. a powerful state senator who was a foster parent and advocated based on his/her experience). Given the public policy and dissemination and implementation implications, future studies of this type are warranted. Such research could build a foundation of knowledge on differential Child Welfare spending rates and their impact and on the wider economic concerns in Child Welfare, as influential factors in this area currently appear distinct from other child-serving areas like Medicaid.
This study has a number of limitations. First, the number of years for which comparable state-level data on foster care maintenance rates is relatively small. Ideally, regressions with greater sample sizes would be used to guard against potentially not detecting significant relationships due to lack of power. Similarly, information on key federal funding variables in all states is not available for all years. Somewhat reassuringly, relationships are largely the same in univariate analyses, multivariate analyses including subsets of variables, and full multivariate analyses. Furthermore, the portion of the variance explained by variables in any specification is small compared to state-level fixed effects. Second, decision making regarding Child Welfare systems is not entirely at the state level with both federal oversight and counties playing important roles. Furthermore, states and counties contract for services with contracts not necessarily starting and ending each annual state budget cycle. Both these reasons would lead to a lack of relationship between maintenance rates and state-year variables, even rates at a different level or timescale may be related to these outcomes. If this were the case, an alternative interpretation of our results would be that the amount of control that states exert over important Child Welfare service spending and delivery is less than one might have otherwise expected which is an important dimension to consider when planning statewide implementation of evidence-based programs within these systems. Third, state-level foster maintenance rates do not capture within-state variation at the county level and different structures of control and budgetary authority. It is possible that the high proportion of variation explained by state fixed effects is due to this effect, though we are aware of no nationally comparable longitudinal data at the county level to test this hypothesis. Fourth, the study does not have the ability to draw causal inference and only measures an association or rather lack of a strong association within states over time. We believe that without interpretation of the results causally, the wide variation in foster care maintenance rates and inability to explain or predict maintenance rates with a wide range of variables that should be theoretically related to the rates is important in and of itself.
The reason for the lack of relationship between changes in foster care maintenance rates and changes demographic, economic, political, and policy drivers may very well indicate differences in the system quality and outcomes achieved. In other words, while all states have “foster care maintenance rates”, what is embodied by foster care and surrounded by Child Welfare services may differ between states. Higher rates may indicate spending to increase quality. Initial cross-sectional analyses reported in our study do not find evidence of this, but just as researchers at Dartmouth have carefully examined variation in spending and variation in quality and outcomes of medical services, so too does this issue merit further study in the context of Child Welfare systems.
5. Conclusions
Foster care maintenance rates do not increase in response to challenging economic times, do not appear to be strongly influenced by social or political factors and are not strongly related to Child Welfare quality indicators. Thus, these data suggest that Child Welfare systems, unlike other systems serving children, may not be responsive to financial incentives to encourage the adoption of evidence-based practices, unless those incentives were specially designed and targeted. This important finding makes understanding the barriers and facilitators to the adoption of such practices critical and should prompt the development of a rigorous research agenda to identify facilitators/barriers so that interventions to change practice can be optimally structured.
Appendix Fig. 3.
Share of children who are members of a minority group.
Appendix Fig. 4.
Average state poverty rates.
Appendix Fig. 5.
Average state urbanicity levels.
Appendix Fig. 6.
Share of states with a Republican controlled state legislature or Republican governor (but not both).
Appendix Fig. 9.
Average annual funding per foster child under Title IV E.
Appendix Fig. 10.
Average monthly TANF benefit for a family of 3 reimbursed by the federal government (FMAP).
Appendix Fig. 11.
Average share of state population receiving TANF benefits.
Appendix Fig. 12.
Average per-capita state tax revenue.
Appendix Fig. 13.
Share of states that have undergone Child and Family Services Review within the previous 3 years.
Appendix Fig. 14.
Share of states that have undergone a first Title IV E Eligibility Review within the previous 3 years.
Appendix Fig. 15.
Share of states that have undergone a second Title IV E Eligibility Review within the previous 3 years.
Appendix Fig. 16.
Share of states in which lawsuits have been filed on behalf of foster children within the previous 3 years.
Appendix A
“What explains variation in state foster care maintenance rates across states and over time?”
The Appendix A reports additional results for the main analysis such as additional descriptions of the variables used and alternative specifications of the regression models used for assessment of robustness. Appendix Figs. 1–17 show the means and confidence intervals of the main outcomes and predictors based on local polynomial smoothing. These show general time trends in each of the variables; for example, in Appendix Fig. 1, state foster care maintenance rates are generally rising through the 1990s before beginning to fall with larger and earlier declines in 16 year-olds relative to those of 2 or 9 year-olds.
Contributor Information
Kimberly S. Babiarz, Email: babiarz@stanford.edu.
Rachel L. Garfield, Email: rachelg@kff.org.
Fred Wulczyn, Email: fwchapin@mindspring.com.
John Landsverk, Email: jlandsverk@casrc.org.
Sarah M. Horwitz, Email: sarahh2@stanford.edu.
References
- Aarons GA, Hurlburt M, Horwitz SM. Advancing a conceptual model of evidence-based practice implementation in public service sectors. Administration and Policy in Mental Health. 2011;38(1):4–23. doi: 10.1007/s10488-010-0327-7. [DOI] [PMC free article] [PubMed] [Google Scholar]
- Alt JE, Lowry RC. Divided government, fiscal institutions, and budget deficits: Evidence from the states. American Political Science Review. 1994;88(4):811–828. [Google Scholar]
- Baicker K. Government decision-making and the incidence of federal mandates. Journal of Public Economics. 2001;82(2):147–194. [Google Scholar]
- Barrilleaux CJ, Miller ME. The political economy of state Medicaid policy. American Political Science Review. 1988;82(4):1089–1107. [Google Scholar]
- Bohn H, Inman RP. Balanced-budget rules and public deficits: Evidence from the US states. Carnegie Rochester Conference Series on Public Policy. 1996;45:13–76. [Google Scholar]
- Bureau of Labor Statistics. The consumer price index [data file] 2012a Retrieved from. ftp://ftp.bls.gov/pub/special.requests/cpi/cpiai.txt.
- Bureau of Labor Statistics. Local area unemployment statistics information and analysis [www page] 2012b Retrieved from. http://www.bls.gov/lau/
- Child Welfare League of America. Child welfare consent decrees: analysis of thirty-five court actions from 1995–2005. Washington, DC: Child Welfare League of America; 2005. [Google Scholar]
- DeParle J. Welfare limits left poor adrift as recession hit. The New York Times, A1; Apr 7, [Google Scholar]
- Goldhaber-Fiebert JD, Bailey SL, Hurlburt M, Zhang J, Snowden LR, Wulczyn F, et al. Evaluating child welfare policies with decision-analytic simulation models. Administration and Policy in Mental Health and Mental Health Services Research. 2011;2011;39(6):466–477. doi: 10.1007/s10488-011-0370-z. [DOI] [PMC free article] [PubMed] [Google Scholar]
- Goldhaber-Fiebert JD, Snowden LR, Wulczyn F, Landsverk J, Horwitz SM. Economic evaluation research in the context of child welfare policy: a structured literature review and recommendations. Child Abuse & Neglect. 2011;35(9):722–740. doi: 10.1016/j.chiabu.2011.05.012. [DOI] [PMC free article] [PubMed] [Google Scholar]
- Grannemann TW. Reforming national health programs for the poor. In: Pauly MV, editor. National Health Insurance: What now, what later, what never? Washington DC: American Enterprise Institute; 1980. [Google Scholar]
- Grogan CM. Political-economic factors influencing state Medicaid policy. Political Research Quarterly. 1994;47(3):589–622. [Google Scholar]
- Hansen LP. Large sample properties of generalized method of moments estimators. Econometrica. 1982;50(4):1029–1054. [Google Scholar]
- Hanson RL. Medicaid and the politics of redistribution. American Journal of Political Science. 1984;28(2):313–339. [Google Scholar]
- Hendrickx J. COLDIAG2: Stata module to evaluate collinearity in linear regression. Statistical Software Components. 2004:S445202. [Google Scholar]
- HR 3734. The personal responsibility and work opportunity reconciliation act of 1996. 1996 104th Cong., 2nd Sess. [Google Scholar]
- Jacoby WG, Schneider SK. Variability in state policy priorities: An empirical analysis. The Journal of Politics. 2001;63(2):544–568. [Google Scholar]
- Kousser T. The politics of discretionary Medicaid spending, 1980–1993. Journal of Health Politics, Policy and Law. 2002;27(4):639–671. doi: 10.1215/03616878-27-4-639. [DOI] [PubMed] [Google Scholar]
- Kurre JA. Is the cost of living less in rural areas? International Regional Science Review. 2003;26(1):86–116. [Google Scholar]
- McHugh R. Cost-of-living differences in urban versus rural areas: an analysis with expenditure data (no. 90-sr49) Center for Agricultural and Rural Development (CARD) at Iowa State University; 1990. [Google Scholar]
- National Association of Public Child Welfare Administrators (on Behalf of Children’s Rights. Basic family foster care maintenance rates survey: Summary of findings. Washington DC: National Association of Public Child Welfare Administrators; 2007. [Google Scholar]
- National Center for Youth Law. Foster care reform litigation docket. Oakland, CA: National Center for Youth Law; 2010. [Google Scholar]
- Office of Management and Budget. Budget information for states, budget of the United States government, fiscal year 2003. Washington DC: Office of Management and Budget; 2002. [Google Scholar]
- Office of Management and Budget. Analytical perspectives, budget of the United States government, fiscal year 2004. Washington DC: Office of Management and Budget; 2003. [Google Scholar]
- Office of Management and Budget. Analytical perspectives, budget of the United States government, fiscal year 2005. Washington DC: Office of Management and Budget; 2004. [Google Scholar]
- Office of Management and Budget. Analytical perspectives, budget of the United States government, fiscal year 2006. Washington DC: Office of Management and Budget; 2005. [Google Scholar]
- Office of Management and Budget. Analytical perspectives, budget of the United States government, fiscal year 2007. Washington DC: Office of Management and Budget; 2006. [Google Scholar]
- Office of Management and Budget. Analytical perspectives, budget of the United States government, fiscal year 2008. Washington DC: Office of Management and Budget; 2007. [Google Scholar]
- Office of Management and Budget. Analytical perspectives, budget of the United States government, fiscal year 2009. Washington DC: Office of Management and Budget; 2008. [Google Scholar]
- Office of Management and Budget. Analytical perspectives, budget of the United States government, fiscal year 2010. Washington DC: Office of Management and Budget; 2009. [Google Scholar]
- Plotnick RD, Winters RF. A politico-economic theory of income redistribution. American Political Science Review. 1985;79(2):458–473. [Google Scholar]
- Poterba JM. State responses to fiscal crises: The effects of budgetary institutions and politics. Journal of Political Economy. 1994;102(4):799–821. [Google Scholar]
- ProQuest Statistical Datasets. Population estimates — detail (1980–present): Population ages 19 and under, 1990–2011 [data file] 2012 Retrieved from. https://web.lexis-nexis.com/statuniv.
- Republican National Committee. Republican platform of 2008 [www page] 2008 Retrieved from. http://www.gop.com/2008Platform/
- Republican Party Platforms. Republican party platform of 1972. Peters Gerhard, Woolley John T., editors. The American Presidency Project. 1972 Online by Retrieved from. http://www.presidency.ucsb.edu/ws/?pid=25842.
- Republican Party Platforms. Republican party platform of 1980. Peters Gerhard, Woolley John T., editors. The American Presidency Project. 1980 Online by Retrieved from. http://www.presidency.ucsb.edu/ws/?pid=25844.
- Republican Party Platforms. Republican party platform of 1992. Peters Gerhard, Woolley John T., editors. The American Presidency Project. 1992 Online by Retrieved from. http://www.presidency.ucsb.edu/ws/?pid=25847.
- Republican Party Platforms. Republican party platform of 2000. Peters Gerhard, Woolley John T., editors. The American Presidency Project. 2000 Online by Retrieved from. http://www.presidency.ucsb.edu/ws/?pid=25849.
- Sargan JD. The estimation of economic relationships using instrumental variables. Econometrica. 1958;26(3):393–415. [Google Scholar]
- Soss J, Schram SF, Vartanian TP, O’Brien E. Setting the terms of relief: Explaining state policy choices in the devolution revolution. American Journal of Political Science. 2001;45(2):378–395. [Google Scholar]
- StataCorp. Stata Statistical Software: Release 11. College Station, TX: StataCorp LP; 2009. [Google Scholar]
- The Lewin Group & the Nelson A. Rockefeller Institute of Government. Spending on social welfare programs in rich and poor states: Report prepared for the Department of Health and Human Services, Assistant Secretary for Planning and Evaluation. Washington, DC: US Department of Health and Human Services; 2004. [Google Scholar]
- United States Census Bureau. 1990 population and housing unit counts: United States [data file] 1993 Retrieved from. http://www.census.gov/population/www/
- United States Census Bureau. Current population survey, annual social and economic supplements [data file] 2011a Retrieved from. http://www.census.gov/hhes/www/poverty/data/historical/hstpov21.xls.
- United States Census Bureau. Current population survey, annual social and economic supplements [data file] 2011b Retrieved from. http://www.census.gov/hhes/www/income/data/historical/household/
- United States Census Bureau. The statistical abstract of the United States. United States Census of Population and Housing. Washington, DC: United States Census Bureau; 2012a. [Google Scholar]
- United States Census Bureau. Annual survey of state government tax collections [data file] 2012b Retrieved from. http://www.census.gov/govs/statetax/historical_data.html.
- United States Council of State Governments. United States census statistical abstract: The book of states. Chicago: U.S. Council of State Governments; 2011. [Google Scholar]
- United States Department of Health and Human Services. Title IV-E eligibility review schedule [www page] 2012 Retrieved from. http://www.acf.hhs.gov/programs/cb/cwmonitoring/general_info/review_sched.htm.
- United States Department of Health and Human Services Administration for Children and Families. National study of protective, preventive and reunification services delivered to children and their families. Washington DC: United States Department of Health and Human Services; 1994. [Google Scholar]
- United States Department of Health and Human Services Administration for Children and Families. CFSR review schedule [text file] 2004 Retrieved from. http://www.acf.hhs.gov/sites/default/files/cb/cfsr_2001_2004_review_schedule.pdf.
- United States Department of Health and Human Services Administration for Children and Families. Corrected federal register announcement [www page] 2007 Retrieved from. http://www.acf.hhs.gov/programs/cb/cwmonitoring/legislation/fed_reg.htm.
- United States Department of Health and Human Services Administration for Children and Families. Child welfare outcomes 2006–2009, report to congress. Washington, DC: United States Department of Health and Human Services; 2010a. [Google Scholar]
- United States Department of Health and Human Services Administration for Children and Families. Child welfare outcomes annual report [www page] 2010b Retrieved from. http://www.acf.hhs.gov/programs/cb/stats_research/
- United States Department of Health and Human Services Administration for Children and Families. Child and family services reviews and title IV-E foster care eligibility reviews Fact Sheet [www page] 2012 Retrieved from. http://www.acf.hhs.gov/programs/cb/cwmonitoring/general_info/07200fsheet.htm.
- United States Department of Health and Services. Federal medical assistance percentages [data file] 2012 Retrieved from. http://aspe.hhs.gov/health/fmap.htm.
- United States House of Representatives Ways and Means Committee. Background material and data on the programs within the jurisdiction of the committee on ways and means (Green Book) Washington DC: United States House of Representatives Ways and Means Committee; 1996. [Google Scholar]
- United States House of Representatives Ways and Means Committee. Background material and data on the programs within the jurisdiction of the committee on ways and means (Green Book) Washington DC: United States House of Representatives Ways and Means Committee; 1998. [Google Scholar]
- United States House of Representatives Ways and Means Committee. Background material and data on the programs within the jurisdiction of the committee on ways and means (Green Book) Washington DC: United States House of Representatives Ways and Means Committee; 2000. [Google Scholar]
- United States House of Representatives Ways and Means Committee. Background material and data on the programs within the jurisdiction of the committee on ways and means (Green Book) Washington DC: United States House of Representatives Ways and Means Committee; 2004. [Google Scholar]
- United States House of Representatives Ways and Means Committee. Background material and data on the programs within the jurisdiction of the committee on ways and means (Green Book) Washington DC: United States House of Representatives Ways and Means Committee; 2008. [Google Scholar]
- Wulczyn F, Lery B. Racial disparity in foster care admissions. Chicago, IL: Chapin Hall Center for Children at the University of Chicago; 2007. [Google Scholar]


