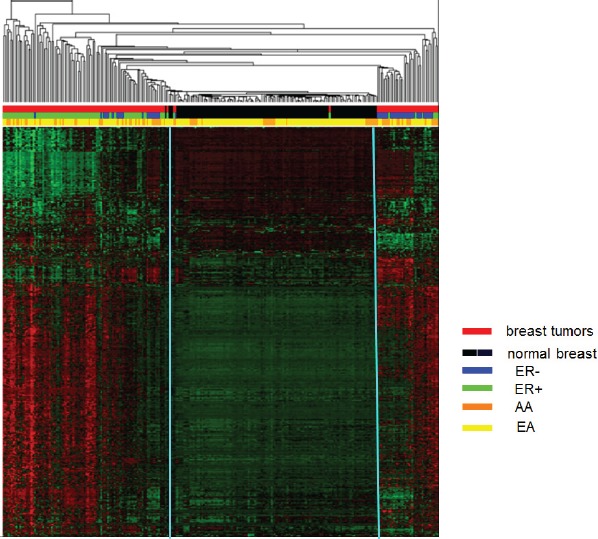
Figure 5. Unsupervised hierarchical cluster analysis of the most varied CpG loci probes among tumor and normal breast tissues (2,761 probes, SD > 0.189).

Based on the average linkage and Manhattan distance metric on 139 tumors and 126 controls, three distinct clusters were identified. Cluster 1 is primarily tumor samples (red bars) enriched for ER-positive tumors (green bars); cluster 2 is predominately normal samples (black bars); cluster 3 is primarily tumor samples (red bars) enriched for ER-negative tumors (blue bars). Status: red=tumor and black=normal; ER: green=ER-positive and blue=ER-negative; Race: orange=AA and yellow=EA. In heat map, red lines indicate hypermethylation and green lines indicate hypomethylation.
