Abstract
Background
MicroRNAs are small non-coding nucleotide sequences that regulate gene expression. These structures are fundamental to several biological processes, including cell proliferation, development, differentiation and apoptosis. Identifying the expression profile of microRNAs in healthy human gastric antrum mucosa may help elucidate the miRNA regulatory mechanisms of the human stomach.
Methodology/Principal Findings
A small RNA library of stomach antrum tissue was sequenced using high-throughput SOLiD sequencing technology. The total read count for the gastric mucosa antrum region was greater than 618,000. After filtering and aligning using with MirBase, 148 mature miRNAs were identified in the gastric antrum tissue, totaling 3,181 quality reads; 63.5% (2,021) of the reads were concentrated in the eight most highly expressed miRNAs (hsa-mir-145, hsa-mir-29a, hsa-mir-29c, hsa-mir-21, hsa-mir-451a, hsa-mir-192, hsa-mir-191 and hsa-mir-148a). RT-PCR validated the expression profiles of seven of these highly expressed miRNAs and confirmed the sequencing results obtained using the SOLiD platform.
Conclusions/Significance
In comparison with other tissues, the antrum’s expression profile was unique with respect to the most highly expressed miRNAs, suggesting that this expression profile is specific to stomach antrum tissue. The current study provides a starting point for a more comprehensive understanding of the role of miRNAs in the regulation of the molecular processes of the human stomach.
Introduction
MicroRNAs (miRNAs) are small non-coding nucleotide sequences between 17 and 25 nucleotides in length that primarily function in the regulation of gene expression [1], [2]. Studies have demonstrated that miRNAs form a complex, regulatory cell signaling network [2], [3] that results in differentiated gene expression. It is estimated that two-thirds of the human genome is regulated by these small nucleotide sequences. The mechanisms underlying the negative regulation of gene expression by miRNAs are similar in animals and plants, which implies that they are involved in fundamental cellular processes including cell proliferation, development, differentiation and apoptosis [4].
Altered miRNA expression levels may contribute to disease development in humans. Several reports have linked miRNAs to cancer; the first miRNAs to be characterized were involved in cellular proliferation and death. Human tumors and tumor cell lines exhibit large differences in miRNA expression levels compared with normal tissues [5], [6], [7]. The evidence suggests that differentiated miRNA expression may regulate tumor suppressor genes and oncogenes [8].
MiRNA expression profiles have also been studied in many healthy tissues, such as the heart, lung, liver, kidney, brain and cardia mucosa of the stomach [9], [10], [11]. The goal of these types of studies is to establish reference values for future comparisons with altered tissues; thus, expression levels in healthy tissues must be validated. Herein, we proposed to sequence the miRnome of the healthy human gastric antrum region using ultra-deep sequencing.
Epidemiologic changes have been observed in genetic diseases that affect both regions of the stomach, indicating molecular changes in the gastric cardia and gastric antrum mucosa [12]. Identifying the miRNA expression profile in the antrum mucosa and comparing these results with previous studies may elucidate the regulatory mechanisms present in different tissues or regions that are associated with several diseases, including cancer.
Materials and Methods
Biological Materials
Our fresh tissue sample for ultra-deep sequencing was obtained from a gastroscopic biopsy (∼4 mm3). The patient was 33 years old with no indication of cancer. A macroscopic observation of the tissue showed no evidence of lesions, and a histological examination confirmed the presence of normal and healthy conditions. The sample was collected from a patient at Hospital Universitário João de Barros Barreto/Universidade Federal do Pará in Brazil.
Immediately after the biopsy, a fragment was selected for the experiment. The sample was frozen at –170°C and stored separately in liquid nitrogen in accordance with standard procedure until miRNA extraction.
Ethics Statement
The ethical guidelines of the Helsinki declaration were followed, and written informed consent was obtained from the patient. This study was approved by the Research Ethics Committee (Comitê de Ética em Pesquisa - CEP) of João de Barros Barreto Teaching Hospital (Hospital Universitário João Barros Barreto - HUJBB) - Federal University of Pará (UFPA) (Protocol number 14052004/HUJBB).
miRNA Library
The mirVana Isolation Kit (Ambion Inc., USA) was used for total small RNA collection from the tissue sample. The concentration and quality were determined using a Nanodrop 1000 spectrophotometer (ND-1000; Nanodrop Technologies, Wilmington, DE), and purification and size selection were performed using 6% polyacrylamide gel electrophoresis. Using the SOLiD Small RNA Expression Kit (Ambion Inc., USA), 200 ng of small RNA (150–200 bp) was used as a template for the miRNA library. The miRNAs in the library were tagged with unique and specific amplification primers (“the barcode system”; Life Technologies, CA, USA). Next, 50 pg of the library was pooled with seven additional miRNA libraries at the same concentration. A fraction of the library pool (0.1 pg) was amplified and fixed on magnetic beads using emulsion PCR. The ePCR product was deposited onto a single slide, and multiplex SOLiD sequencing was performed.
SOLiD Ultra-Deep Sequencing and Data Analysis
First, the SOLiD (version 3.0) sequencing system (Life Technologies) was used to generate 35 bp long reads. The second step was to decode the barcode and match each bead sequence to the sample identity. The small RNA sequences data from the gastric tissue are available at European Nucleotide Archive under accession number ERP004687. Sequence analysis was performed using the SOLiD System Small RNA Analysis Tool (Life Technologies) and MiRanalyzer [13]. First, we filtered out the sequences that matched RNA contaminants, such as tRNA, rRNA, DNA repeats and adaptor molecules. After excluding the contaminant reads, we aligned the sequences against miRNA precursor sequences using MirBase (version 19) [14], and we included the reads that matched mature miRNA sequences. To compare the expression data with additional human tissues, miRNA expression data were imported from the microRNA.org database, and the expression for each mature miRNA was normalized by the total read count. A graphical analysis was performed using GenePattern 3.6.1 (http://genepattern.broadinstitute.org).
miRNA Real-Time PCR (Validation)
The RT-PCR was performed in 10 samples, including the same sample used in Ultra-Deep Sequence. Biopsy samples from gastric antrum tissues were collected from healthy patients and histological examination confirmed the presence of normal and healthy conditions. After collection, the samples were immediately processed and stored at –80°C until RNA extraction. The total RNA was extracted by homogenizing 40 mg of frozen tissue, and the RNA was isolated using the TRIzol reagent (Life Technologies) in accordance with the manufacturer’s instructions. The miRNA concentrations and quality were determined using a Nanodrop 1000 spectrophotometer. The total RNA was reverse transcribed using a TaqMan@- MicroRNA Reverse Transcription kit (Life Technologies).
The miRNA levels were analyzed using a 7500 Real-Time PCR System (Life Technologies) with TaqMan miRNA assays in accordance with the manufacturer’s instructions (Life Technologies); the primers were designed using Primer Express (Life Technologies). The mean expression level for the endogenous Z30 controls was used as an internal control for the miRNA experiments to compare the expression results.
The high miRNA expression levels demonstrated by ultra-deep sequencing (in descending order of expression level: hsa-mir-145, hsa-mir-29a, hsa-mir-29c, hsa-mir-21, hsa-mir-451a, hsa-mir-192 and hsa-mir-148a) were validated using TaqMan miRNA assays (Life Technologies).
The following analyses were used to measure the expression levels of mature miRNAs and the inter-individual variation in the 10 samples from healthy antrum tissue. The expression data for each mature miRNA were normalized to the mean expression level in the Z30 human endogenous control. The relative miRNA expression levels were then calculated using the comparative threshold cycle (Ct) method (2−Δct).
Results
Sequencing was performed using the SOLID platform (Life Technologies, CA, USA). The total read count for the antrum tissue exceeded 618,000. After filtering for sequence quality (a minimum of QV≥10 in the first 10 bases) [13] and aligning with MirBase (version 19) [14], 148 mature miRNAs in the human gastric antrum were identified, totaling 3,181 reads. From this set, seven highly expressed miRNAs were selected for validation by RT-PCR.
For the expression analyses, the miRNA library was divided into three read-count thresholds: i) greater than 100 reads, ii) between 10 and 100 reads and iii) less than 10 reads. A total of 107 miRNAs (72.3%) were expressed at below 10 reads, 33 miRNAs (22.3%) were expressed at between 10 and 100 reads, and 8 miRNAs (5.4%) were expressed at greater than 100 reads. The eight most highly expressed miRNAs (with expression levels greater than 100 reads) produced 2,021 reads, which corresponded to 63.5% of the human gastric antrum tissue total reads (Figure 1). It is worth noting that a small number of miRNAs is responsible for over 60% of the regulation in this region.
Figure 1. MiRNA distribution in the human gastric antrum by read count number.
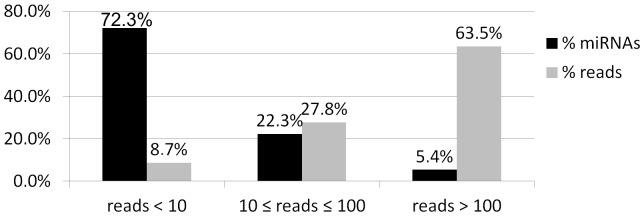
The miRNA library was divided into three read-count thresholds: i) greater than 100 reads, ii) between 10 and 100 reads and iii) less than 10 reads. Dark gray column: mature miRNA detected by deep-sequencing, grouped by read count. Light gray column: percentage of the respective group in the total count of reads.
To characterize the human gastric antrum miRnome profile, the miRNAs with the highest expression levels were selected. Detailed descriptions of these miRNAs are shown in Table 1 and Figure 2. When these results were compared with the cardia’s miRnome [11], it was observed that the miRNAs listed here are among the 15 most highly expressed miRNAs in the cardia, with the exception of hsa-mir-191. The number of predicted targets for each miRNA described in Table 1 was obtained from www.microrna.org [15].
Table 1. Characteristics of the eight most highly expressed miRNAs in human gastric antrum tissue and the number of possible targets.
| miRNA | Read count | Targets number |
| hsa-mir-145 | 453 | 7,464 |
| hsa-mir-29a | 444 | 6,777 |
| hsa-mir-29c | 359 | 6,856 |
| hsa-mir-21 | 240 | 5,203 |
| hsa-mir-451a | 143 | 1,605 |
| hsa-mir-192 | 140 | 6,545 |
| hsa-mir-191 | 133 | 2,015 |
| hsa-mir-148a | 109 | 7,402 |
Figure 2. The most highly expressed miRNAs in human gastric antrum region mucosa.
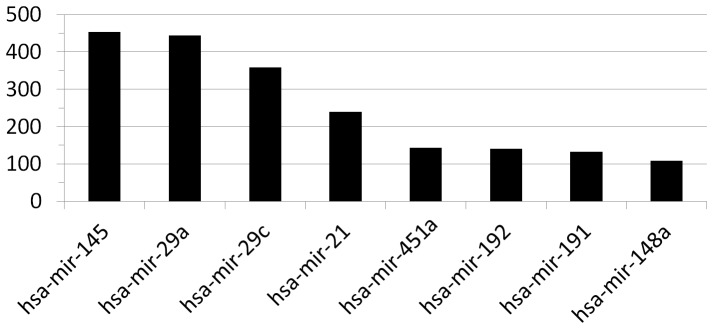
The reads counts are based on the number of reads detected during the deep-sequencing of the gastric antrum small RNA library using the SOLiD system. MiRNAs were detected using miRBase (version 19.0).
To compare the expression profiles of the antrum and cardia [11] tissues, Pearson’s correlation was applied to all of the miRNAs with at least 10 reads in the antrum (Figure 3). The results indicate that the relative expression levels of the antrum and cardia miRNAs are significantly correlated (r = 0.73; p-value < 0.001). A heatmap was used to compare the expression profiles of both tissues with other known healthy tissue profiles [10] (Figure 4).
Figure 3. Correlation between the relative expression profiles of the antrum and cardia [11].
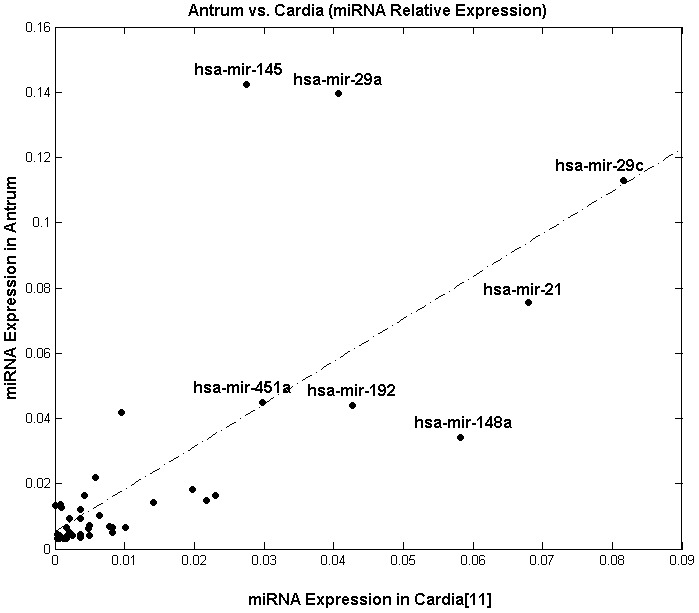
For this analysis, all of the miRNAs with at least 10 reads in the antrum were used. The Pearson’s correlation value indicates that the expression profiles of the antrum and cardia tissues are significantly correlated (r = 0.73; p-value < 0.001).
Figure 4. Heatmap of the normalized expression of the most highly expressed mature miRNAs in human gastric tissue in comparison with other normal tissues published in the mammalian microRNA expression atlas [10].
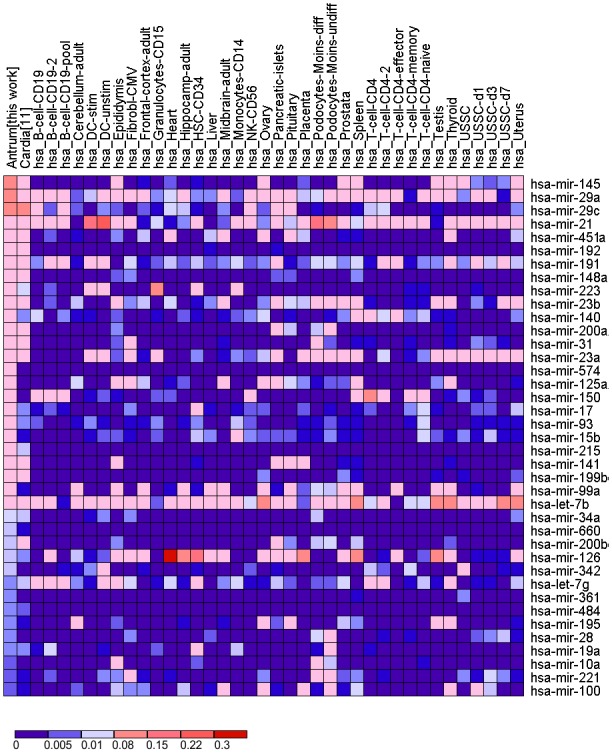
The sequencing results for seven highly expressed miRNAs (hsa-mir-145, hsa-mir-29a, hsa-mir-29c, hsa-mir-21, hsa-mir-451a, hsa-mir-192 and hsa-mir-148a) were validated using singleplex real-time PCR (qRT-PCR) to determine their expression levels in the gastric antrum region of 10 healthy individuals.
RT-PCR analysis confirmed that all seven of the miRNAs that were identified as highly expressed by the SOLiD platform were also significantly upregulated when compared with the expression levels of endogenous Z30 (p-value < 0.001; Figure 5). Therefore, these seven miRNAs were considered to be over-expressed [7], [16], [17], [18] in the human gastric antrum region.
Figure 5. Quantification of the highly expressed miRNAs in the human gastric antrum region mucosa using RT-PCR.
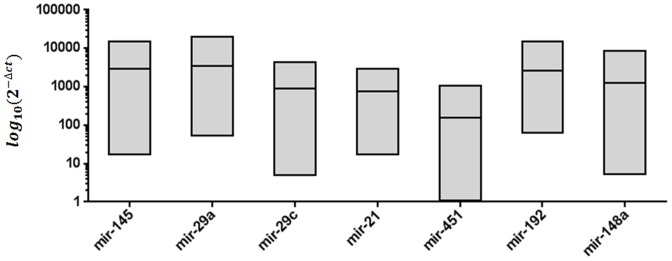
Quantification was based on Ct values and normalized using an endogenous Z30 expression control. The 2(−Δct) for each miRNA is the mean of ten replicates of gastric antrum tissue from ten different individuals.
Discussion
The total number of miRNA reads found in the present study was 3,181. A total of 63.5% (2,021) of these reads corresponded to the eight most highly expressed miRNAs in antrum tissue. These results suggest the specificity of epigenetic control, where a small number of miRNAs contributes to the majority of the gene regulation. Likewise, in cardia, eight miRNAs are responsible for 57.1% of the gene regulation [11].
Comparing the sequencing results obtained in this study with the cardia miRnome, it was found that seven of the eight most highly expressed miRNAs in the antrum are also among the 15 most highly expressed miRNAs in the cardia [11]. Of the seven miRNAs that were simultaneously expressed in both tissues, five miRNAs maintained a relatively similar expression level after normalization: hsa-mir-29c, hsa-mir-21, hsa-mir-451a, hsa-mir-192 and hsa-mir-148a (Table 2). A more in-depth investigation comparing the miRNAs with at least 10 reads in antrum tissue (Figure 3) indicated that the expression profiles of the cardia and antrum tissues were significantly correlated (r = 0.73; p-value < 0.001). This suggests the presence of an “organ signature” in addition to a tissue signature.
Table 2. Read counts of the eight most highly expressed miRNAs in human gastric antrum compared with their relative expression levels in the gastric cardia.
| miRNA | % reads Antrum | %reads Cardia |
| hsa-mir-145 | 14.2 | 3.6 |
| hsa-mir-29a | 14.0 | 5.3 |
| hsa-mir-29c | 11.3 | 10.5 |
| hsa-mir-21 | 7.5 | 8.8 |
| hsa-mir-451a | 4.5 | 3.9 |
| hsa-mir-192 | 4.4 | 5.5 |
| hsa-mir-191 | 4.2 | - |
| hsa-mir-148a | 3.4 | 7.5 |
Moreover, the miRNAs hsa-mir-145 and hsa-mir-29a exhibited significantly different expression levels in the referred tissues, and hsa-mir-191 was not identified as one of the 15 most highly expressed miRNAs in cardia tissue [11].
The results obtained in this study were compared with the expression profile of additional healthy tissues such as heart, lung, liver, kidney, brain and stomach’s cardia region (Figure 4). Although high expression levels had been previously observed for some of the selected miRNAs in the comparison, the other tissues did not produce a similar miRNA expression profile compared with the profile described herein, which suggests that there is a specific expression profile for the antrum mucosa.
The expression of hsa-mir-145 and hsa-mir-29c has been studied in other tissues, and both miRNAs are known to be cancer suppressor candidates. Their expression levels were found to be upregulated in several healthy tissues. Hsa-mir-145 is highly expressed in heart, lung, and breast tissues [19], [20], [21], and hsa-mir-29c is highly expressed in the stomach and liver [22], [23]. Hsa-mir-192 is upregulated in gastrointestinal organs and kidney [9]. Although hsa-mir-21 upregulation has been associated with several diseases, including cancer, it was also found to have high levels of expression in several healthy tissues [10], [11]. In healthy antrum tissue, hsa-mir-21 was highly expressed, as shown in this study.
Table 2 shows the number of predicted target genes [15] for each of the eight upregulated miRNAs in antrum tissue. An analysis of the potential targets for each miRNA shows that many of the predicted mRNA targets are associated with multiple highly expressed miRNAs in antrum.
A simultaneous analysis of miRNA targets showed that 4,748 different genes may be regulated by up to two of the eight most highly expressed miRNAs, and some genes can be regulated by up to seven of the eight miRNAs. Using the simultaneous presence of at least six miRNAs as a selection criterion, 43 potential target genes were grouped together, as shown in Table 3. For these analyses, only conserved miRNAs with high miSRV scores were used [15], [24].
Table 3. Common target genes for at least six of the eight most highly expressed miRNAs in the human gastric antrum region.
| miRNAs | HNRNPF | SNRPN | BRWD1 | RASSF8 | LPP | NCAM1 | LAMP2 | STRADB | UHRF2 | FAM123B | FGD4 | PRRG1 | TAPT1 | NIPBL | ZEB2 | HLA-DQB1 | PAFAH1B1 | PCDH15 | SLC25A37 | DISC1 | MMAA | TET2 |
| mir-145 | * | * | * | * | * | * | * | * | * | * | * | * | * | * | * | * | * | * | ||||
| mir-29a | * | * | * | * | * | * | * | * | * | * | * | * | * | * | * | * | * | * | * | * | * | |
| mir-29c | * | * | * | * | * | * | * | * | * | * | * | * | * | * | * | * | * | * | * | * | * | * |
| mir-21 | * | * | * | * | * | * | * | * | * | * | * | * | * | * | * | * | * | * | * | * | * | |
| mir-451a | * | * | ||||||||||||||||||||
| mir-192 | * | * | * | * | * | * | * | * | * | * | * | * | * | * | * | * | * | * | * | * | ||
| mir-191 | * | * | * | * | * | * | * | * | * | |||||||||||||
| mir-148a | * | * | * | * | * | * | * | * | * | * | * | * | * | * | * | * | * | * | * | * |
The results suggest that these genes are strong candidates for silencing in the gastric antrum region. Experimental validation of these genes and the functional analysis of each gene may demonstrate a physiological role for these miRNAs in normal gastric tissue.
Several cellular functions are regulated by the miRNA targets selected in this study, including the cell cycle, apoptosis, gene regulation, cell motility and cell migration, which indicates that these genes may play a role in tumorigenesis or tumor suppression. The LPP (Lipoma Preferred Partner) gene is target for seven of the eight upregulated miRNAs in the antrum and has been found to be deregulated in several benign and malignant tumors [25]. The RASSF8, UHRF2, FAM123B and STRADB genes are possible targets for six of the eight most highly expressed miRNAs and are tumor suppressor candidates [26], [27], [28], [29], [30], [31], [32]. BRWD1 may be regulated by six of the selected miRNAs and is involved in a variety of cellular functions [33].
The LAMP2, NCAM1, PCDH15 and LPP genes are associated with membrane formation and repair, as well as cell-cell adhesion [25], [34], [35], [36]. NCAM1 may also play a role in the healing processes of gastric ulcers [37]. HNRNPF, SNRPN and BRWD1 are involved in gene regulation and splicing processes [33], [38],[39]. These genes are possible targets for six of the eight most highly expressed miRNAs in antrum tissue.
The FGD4 and TAPT1 genes encode proteins that may play roles in cytoskeletal and cell-shape formation [40], [41]. FGD4 is also involved in mediating cellular invasion by Cryptosporidium Parvum, an intracellular parasite that infects the gastrointestinal tract [40]. The FGD4 and TAPT1 genes are also targets for six of the selected miRNAs.
This study validates the miRNA expression profile of the stomach’s antrum region tissue and provides complementary information on the role of miRNAs in the molecular regulation processes of healthy human stomach; this information can be used to establish a reference for future comparisons with the altered miRNA expression profiles observed in gastric tract diseases.
Acknowledgments
The authors would like to thank the patients who provided samples for the experiments and the staff of the Hospital Universitário João de Barros Barreto who contributed to the realization of this work.
Funding Statement
IGH is supported by Pós-Doc Junior (PDJ) fellowship from CNPq/Brazil (162605/2011- 0); ÂNDREA RIBEIRO-DOS-SANTOS supported by CNPq/Produtividade; SS supported by CNPq/Produtividade; ROMMEL BURBANO supported by CNPq/Produtividade; Governo do Para/SEDECT/FAPESPA, PROPESP/UFPA-FADESP. The funders had no role in study design, data collection and analysis, decision to publish, or preparation of the manuscript.
References
- 1. Lee RC, Feinbaum RL, Ambros V (1993) The C. elegans heterochronic gene lin-4 encodes small RNAs with antisense complementarity to lin-14. Cell 75: 843–854. [DOI] [PubMed] [Google Scholar]
- 2. Ricarte Filho JC, Kimura ET (2006) MicroRNAs: novel class of gene regulators involved in endocrine function and cancer. Arq Bras Endocrinol Metabol 50: 1102–1107. [DOI] [PubMed] [Google Scholar]
- 3. Lewis BP, Burge CB, Bartel DP (2005) Conserved seed pairing, often flanked by adenosines, indicates that thousands of human genes are microRNA targets. Cell 120: 15–20. [DOI] [PubMed] [Google Scholar]
- 4. Meltzer PS (2005) Cancer genomics: small RNAs with big impacts. Nature 435: 745–746. [DOI] [PubMed] [Google Scholar]
- 5. Calin GA, Croce CM (2006) MicroRNA signatures in human cancers. Nature Reviews Cancer 6: 857–866. [DOI] [PubMed] [Google Scholar]
- 6. Calin GA, Sevignani C, Dumitru CD, Hyslop T, Noch E, et al. (2004) Human microRNA genes are frequently located at fragile sites and genomic regions involved in cancers. Proceedings of the National Academy of Sciences of the United States of America 101: 2999–3004. [DOI] [PMC free article] [PubMed] [Google Scholar]
- 7. Gaur A, Jewell DA, Liang Y, Ridzon D, Moore JH, et al. (2007) Characterization of microRNA expression levels and their biological correlates in human cancer cell lines. Cancer Res 67: 2456–2468. [DOI] [PubMed] [Google Scholar]
- 8. Guo J, Miao Y, Xiao B, Huan R, Jiang Z, et al. (2009) Differential expression of microRNA species in human gastric cancer versus non-tumorous tissues. Journal of gastroenterology and hepatology 24: 652–657. [DOI] [PubMed] [Google Scholar]
- 9. Liang Y, Ridzon D, Wong L, Chen C (2007) Characterization of microRNA expression profiles in normal human tissues. BMC Genomics 8: 166–187. [DOI] [PMC free article] [PubMed] [Google Scholar]
- 10. Landgraf P, Rusu M, Sheridan R, Sewer A, Iovino N, et al. (2007) A mammalian microRNA expression atlas based on small RNA library sequencing. Cell 129: 1401–1414. [DOI] [PMC free article] [PubMed] [Google Scholar]
- 11. Ribeiro-dos-Santos Â, Khayat AS, Silva A, Alencar DO, Lobato J, et al. (2010) Ultra-deep sequencing reveals the microRNA expression pattern of the human stomach. PLoS ONE 5(10): e13205. [DOI] [PMC free article] [PubMed] [Google Scholar]
- 12. Gulmann C, Hegarty H, Grace A, Leader M, Patchett S, et al. (2004) Differences in proximal (cardia) versus distal (antral) gastric carcinogenesis via retinoblastoma pathway. WORLD JOURNAL OF GASTROENTEROLOGY 10(1): 17–21. [DOI] [PMC free article] [PubMed] [Google Scholar]
- 13. Hackenberg M, Sturm M, Langenberger D, Falcon-Perez JM, Aransay AM (2009) MiRanalyzer: a microRNA detection and analysis tool for nextgeneration sequencing experiments. Nucleic Acids Res 37: W68–76. [DOI] [PMC free article] [PubMed] [Google Scholar]
- 14. Griffiths-Jones S, Grocock RJ, van Dongen S, Bateman A, Enright AJ (2006) MiRBase: microRNA sequences, targets and gene nomenclature. Nucleic Acids Res 34: D140–4. [DOI] [PMC free article] [PubMed] [Google Scholar]
- 15.Betel D, Wilson M, Gabow A, Marks DS, Sander C (2008) The microRNA. org resource: targets and expression. Nucleic acids research (suppl 1): D149–D153. [DOI] [PMC free article] [PubMed]
- 16. Howell GR, Shindo M, Murray S, Gridley T, Wilson LA, et al. (2007) Mutation of a ubiquitously expressed mouse transmembrane protein (Tapt1) causes specific skeletal homeotic transformations. Genetics 175(2): 699–707. [DOI] [PMC free article] [PubMed] [Google Scholar]
- 17. Zhang Y, Li M, Wang H, Fisher WE, Lin PH, et al. (2009) Profiling of 95 miRNAs in Pancreatic cancer cell lines and surgical specimens by real-time PCR analysis. Word J Surg 33: 698–709. [DOI] [PMC free article] [PubMed] [Google Scholar]
- 18. Gibbons DL, Lin W, Creighton CJ, Rizvi ZH, Gregory PA, et al. (2009) Contextual extracellular cues promote tumor cell EMT and metastasis by regulating miR-200 family expression. Genes and Development 23: 2140–2151. [DOI] [PMC free article] [PubMed] [Google Scholar]
- 19. Rangrez AY, Massy ZA, Metzinger-Le Meuth V, Metzinger L (2011) miR-143 and miR-145 Molecular Keys to Switch the Phenotype of Vascular Smooth Muscle Cells. Circulation: Cardiovascular Genetics 4(2): 197–205. [DOI] [PubMed] [Google Scholar]
- 20. Cho W, Chow AS, Au JS (2009) Restoration of tumour suppressor hsa-miR-145 inhibits cancer cell growth in lung adenocarcinoma patients with epidermal growth factor receptor mutation. European Journal of Cancer 45(12): 2197–2206. [DOI] [PubMed] [Google Scholar]
- 21. Radojicic J, Zaravinos A, Vrekoussis T, Kafousi M, Spandidos DA, et al. (2011) MicroRNA expression analysis in triple-negative (ER, PR and Her2/neu) breast cancer. Cell Cycle 10(3): 507–517. [DOI] [PubMed] [Google Scholar]
- 22. Saito Y, Suzuki H, Imaeda H, Matsuzaki J, Hirata K, et al. (2013) The tumor suppressor microRNA-29c is downregulated and restored by celecoxib in human gastric cancer cells. International Journal of Cancer 132(8): 1751–1760. [DOI] [PubMed] [Google Scholar]
- 23. Wang CM, Wang Y, Fan CG, Xu FF, Sun WS, et al. (2011) miR-29c targets TNFAIP3, inhibits cell proliferation and induces apoptosis in hepatitis B virus-related hepatocellular carcinoma. Biochemical and biophysical research communications 411(3): 586–592. [DOI] [PubMed] [Google Scholar]
- 24. Betel D, Koppal A, Agius P, Sander C, Leslie C (2010) Comprehensive modeling of microRNA targets predicts functional non-conserved and non-canonical sites. Genome biology 11(8): R90. [DOI] [PMC free article] [PubMed] [Google Scholar]
- 25. Grunewald TG, Pasedag SM, Butt E (2009) Cell adhesion and transcriptional activity—defining the role of the novel protooncogene LPP. Translational oncology 2(3): 107. [DOI] [PMC free article] [PubMed] [Google Scholar]
- 26. Sherwood V, Recino A, Jeffries A, Ward A, Chalmers A (2010) The N-terminal RASSF family: a new group of Ras-association-domain-containing proteins, with emerging links to cancer formation. Biochem J 425: 303–311. [DOI] [PubMed] [Google Scholar]
- 27. Lock FE, Underhill-Day N, Dunwell T, Matallanas D, Cooper W, et al. (2010) The RASSF8 candidate tumor suppressor inhibits cell growth and regulates the Wnt and NF-κB signaling pathways. Oncogene 29(30): 4307–4316. [DOI] [PubMed] [Google Scholar]
- 28. Mori T, Ikeda DD, Yamaguchi Y, Unoki M (2012) NIRF/UHRF2 occupies a central position in the cell cycle network and allows coupling with the epigenetic landscape. FEBS letters 586(11): 1570–1583. [DOI] [PubMed] [Google Scholar]
- 29. Bai L, Wang X, Jin F, Yang Y, Qian G, Duan C (2012) UHRF2, another E3 ubiquitin ligase for p53. Biochemical and biophysical research communications 425(4): 908–911. [DOI] [PubMed] [Google Scholar]
- 30. Kim WJ, Rivera MN, Coffman EJ, Haber DA (2012) The WTX tumor suppressor enhances p53 acetylation by CBP/p300. Molecular cell 45(5): 587–597. [DOI] [PMC free article] [PubMed] [Google Scholar]
- 31. Boudeau J, Miranda-Saavedra D, Barton GJ, Alessi DR (2006) Emerging roles of pseudokinases. Trends in cell biology 16(9): 443–452. [DOI] [PubMed] [Google Scholar]
- 32. Sanna MG, da Silva Correia J, Luo Y, Chuang B, Paulson LM, et al. (2002) ILPIP, a novel anti-apoptotic protein that enhances XIAP-mediated activation of JNK1 and protection against apoptosis. Journal of Biological Chemistry 277(34): 30454–30462. [DOI] [PubMed] [Google Scholar]
- 33. Philipps DL, Wigglesworth K, Hartford SA, Sun F, Pattabiraman S, Schimenti K, et al. (2008) The dual bromodomain and WD repeat-containing mouse protein BRWD1 is required for normal spermiogenesis and the oocyte–embryo transition. Developmental biology 317(1): 72–82. [DOI] [PMC free article] [PubMed] [Google Scholar]
- 34. Gao J, Xia L, Lu M, Zhang B, Chen Y, et al. (2012) TM7SF1 (GPR137B): a novel lysosome integral membrane protein. Molecular biology reports 39(9): 8883–8889. [DOI] [PubMed] [Google Scholar]
- 35. Callahan JW, Bagshaw RD, Mahuran DJ (2009) The integral membrane of lysosomes: its proteins and their roles in disease. Journal of proteomics 72(1): 23–33. [DOI] [PubMed] [Google Scholar]
- 36. Halbleib JM, Nelson WJ (2006) Cadherins in development: cell adhesion, sorting, and tissue morphogenesis. Genes & development 20(23): 3199–3214. [DOI] [PubMed] [Google Scholar]
- 37. Ichiyanagi S, Sugiyama T, Ochiai T, Ogawa A, Fujita N, et al. (1992) Expression of neural cell adhesion molecule (NCAM) in the healing process of gastric ulcer. Journal of Gastroenterology 27(4): 559–559. [DOI] [PubMed] [Google Scholar]
- 38. Sun X, Zhang H, Wang D, Ma D, Shen Y, et al. (2004) DLP, a novel Dim1 family protein implicated in pre-mRNA splicing and cell cycle progression. Journal of Biological Chemistry 279(31): 32839–32847. [DOI] [PubMed] [Google Scholar]
- 39. Huntriss JD, Latchman DS, Williams DG (1993) The snRNP core protein SmB and tissue-specific SmN protein are differentially distributed between snRNP particles. Nucleic acids research 21(17): 4047–4053. [DOI] [PMC free article] [PubMed] [Google Scholar]
- 40. Liu HP, Chen CC, Wu CC, Huang YC, Liu SC, et al. (2012) Epstein-Barr Virus-Encoded LMP1 Interacts with FGD4 to Activate Cdc42 and Thereby Promote Migration of Nasopharyngeal Carcinoma Cells. PLoS pathogens 8(5): e1002690. [DOI] [PMC free article] [PubMed] [Google Scholar]
- 41. Merkerova M, Vasikova A, Belickova M, Bruchova H (2010) MicroRNA expression profiles in umbilical cord blood cell lineages. Stem Cells and Development 19(1): 17–25. [DOI] [PubMed] [Google Scholar]


