Summary
Current methods to characterize cell-biomaterial interactions are population-based and rely on imaging or biochemical analysis of end-point biological markers. The analysis of stem cells in cultures is further challenged by the heterogeneous nature and divergent fates of stem cells, especially in complex, engineered microenvironments. Here, we describe a high-content imaging-based platform capable of identifying cell subpopulations based on cell phenotype-specific morphological descriptors. This method can be utilized to identify microenvironment-responsive morphological descriptors, which can be used to parse cells from a heterogeneous cell population based on emergent phenotypes at the single cell level and has been successfully deployed to forecast long-term cell lineage fates and screen regenerative phenotype-prescriptive biomaterials.
Keywords: Bioimage Informatics, High-Content Image Analysis, Pluripotent Stem Cells, Phenotypic Classification, Immunocytochemistry
1. Introduction
Engineered microenvironments and biomaterials are capable of controlling a wide range of cellular phenomena including attachment, cell morphology, proliferation, and lineage commitment [1–5]. Characterization methods of biomaterial properties are well established, but methods to quantitatively characterize a cell's response to biomaterials are not. Traditionally, end-point biological assays have been used to determine the levels of lineage-specific markers of differentiated stem cells. These methods are time-consuming and fail to elucidate the role of the microenvironment on stem cell function at the single cell level. To accelerate biomaterial screening, methods that can simultaneously test a large number of conditions have been developed [6–8]. However, these techniques continue to rely on biological assays that measure markers specific to primarily mature phenotypes as opposed to emergent phenotypes. Additionally, these methods measure the average expression of cell populations, which produce only approximate and frequently inaccurate readouts in heterogeneous cell cultures [9].
In order to address these limitations, we demonstrate a high-content imaging-based platform capable of parsing numerical morphological descriptors from images of individual stem cells cultured on various microenvironments [10–12]. This method is based on the notion that there are several key cytoskeletal and nuclear proteins whose organization is sensitively influenced by a signaling pathways emanating from extracellular and environmental stimuli. The expression of these proteins can be captured via fluorescent labeling and high-content imaging, and ultimately quantified by morphological descriptors, which provide a “barcode-like” identity to single cells. By employing this approach, insights about the organization of various cellular proteins can be realized at a single cell level, and contextualized and parsed around the nature of the cellular environment, and tracked as a function of cellular development kinetics.
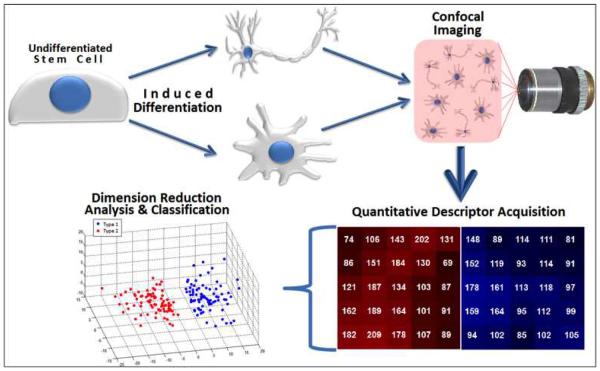
To date, the high content imaging-based approach has been applied to a number of cell systems (e.g., mesenchymal stem cells [10–12], embryonic stem cells [10], induced pluripotent stem cells [10], and breast epithelial cancer cells [13]) cultured in different micro-environments (e.g., orthopedic implants [14], PEG-variant biomaterials [10], and 3D Matrigel [13]), illustrating its versatility in biological research. The workflow procedure of this approach is very straightforward and relatively inexpensive (Figure 1), which allows for virtually any laboratory equipped with a fluorescent microscope to be able to perform this technique. More sophisticated microscopes (e.g., confocal laser scanning and super-resolution instruments) are able to achieve images of higher spatial resolution, which subsequently provide greater detail required for sub-cellular structures, but this is not necessary for larger organelles or protein distributions in the cell body and in the nuclear space.
Figure 1.
Workflow schematic for high content imaging-based characterization of different cellular phenotypes
2. Materials
Virtually any adherent cell type that can be cultured in vitro and immunocytochemically labeled can be used for this assay. As an example, we will provide the materials required for imaging of cultured human mesenchymal stem cells derived from the bone marrow. Unless indicated otherwise, store all reagents at 4°C. Follow appropriate waste disposal protocols with all materials after their use.
2.1 Mesenchymal Stem Cell Culture Media Formulations
Basal Mesenchymal Stem Cell Maintenance Media: Minimum Essential Medium (MEM)-α without deoxy- nor ribo-nucleosides (Gibco, CA), supplemented with 10% fetal bovine serum (FBS) (Gibco, CA) and 100 units/mL penicillin plus 100 μg/mL streptomycin (Gibco, CA).
Osteogenesis Induction Media: MEM-α without deoxy- nor ribo-nucleosides, supplemented with 10% FBS, 10 mM β-glycerophosphate (Sigma-Aldrich, Saint Louis, MO), 0.1 μM dexamethasone (Sigma-Aldrich, Saint Louis, MO), 0.5 mM L-ascorbic acid-2-phosphate (Sigma-Aldrich, Saint Louis, MO) and 100 units/mL penicillin plus 100 μg/mL streptomycin.
Adipogenesis Induction Media: MEM-α without deoxy- nor ribo-nucleosides, supplemented with 10% FBS, 1 μM dexamethasone, 0.2 mM indomethacin (Sigma-Aldrich, Saint Louis, MO), 0.01 mg/ml insulin (Sigma-Aldrich, Saint Louis, MO), 0.5 mM 3-isobutyl-1-methylxanthine (Sigma-Aldrich, Saint Louis, MO) and 100 units/mL penicillin plus 100 μg/mL streptomycin.
Adipogenic Maintenance Media: MEM-α without deoxy- nor ribo-nucleosides, supplemented with 10% FBS, 0.01 mg/mL insulin (Sigma-Aldrich, Saint Louis, MO) and 100 units/mL penicillin plus 100 μg/mL streptomycin.
2.2 Immunocytochemistry Components
Permeabilization Buffer: Phosphate Buffered Saline (PBS) (Lonza) without Ca2+, Mg2+ supplemented with 0.1% Triton X-100.
Blocking Buffer: PBS without Ca2+, Mg2+ supplemented with 5% Normal Goat Serum (NGS) (MP Biomedicals).
Primary and Secondary Antibody Solutions: Dilute antibodies in blocking buffer to antibody-specific concentrations (see Note 1).
2.3 Image Acquisition and Analysis Workstation Components
Microscope equipped with multiple fluorescence filters and/or photodetectors.
Computer equipped with Image Processing software (ImageJ was selected as the illustrative example).
3. Methods
Carry out all procedures at room temperature unless otherwise specified.
3.1 Cell Culture
Culture hMSCs until they reach 50% confluency (see Note 2).
Remove medium and wash cells 1X with pre-warmed PBS (Lonza).
Remove PBS and add trypsin (Sigma) to incubate for 5 minutes.
Gently tap expansion flask and verify cell detachment under a light microscope.
Add equal volume of basal mesenchymal stem cell maintenance media to neutralize trypsin.
Transfer contents of flask to a 15 mL conical tube and centrifuge at 600 RCF for 5 minutes.
Resuspend in 1 mL of basal mesenchymal stem cell maintenance media.
Determine viable cell count via Trypan Blue Stain (Lonza) on a hemacytometer (see Note 3).
Seed cells (density = 5,000 cells/cm2) onto a glass surface (e.g., glass-bottom plate).
Allow cells to attach for 6 hours and begin differentiation induction.
3.2 Immunocytochemistry and Imaging
Once cells have attached and reached the desired phenotype, wash cells with PBS and fix cells with 4% paraformaldehyde (Electron Microscopy Sciences) for 15 minutes.
Wash cells 3X with PBS for 5 minutes per wash.
Block and permeabilize samples with 0.1% Triton X-100 (Sigma) + 5% NGS (MP Biomedicals) in PBS for 1 hour.
After two washes with blocking buffer (5% NGS in PBS), add primary antibody solution at optimal concentration and incubate overnight at 4°C with agitation (see Note 4).
Remove primary antibody solutions and perform three 15 minute washes in blocking buffer.
Add secondary fluorophore antibody solution at optimal concentration for 2 hours at room temperature with agitation (see Note 5).
Remove secondary antibody solutions and wash with PBS for 2 hours, changing PBS every 30 minutes.
Add 1 μg/mL DAPI (Sigma) in PBS for 5 minutes.
Wash cells 2X with PBS.
Leave cells in PBS and cover in foil. Store at 4°C until ready for imaging.
Utilize an epifluorescence or confocal fluorescence microscope. Acquire images with a high-magnification objective lens (at least 40X) using the appropriate fluorescence filter cubes or laser excitation wavelengths that correspond to your secondary antibody fluorophores. Save images on a computer or portable hard drive such that these can be recalled for further image processing.
3.3 Quantitative Descriptor Acquisition Using an Image Processing Software (This example is based on ImageJ)
Obtain the latest version of software. For this example, ImageJ was used as the software of choice. This can be downloaded and installed from the Research Services Branch of the National Institute of Health in the US (http://rsb.info.nih.gov/ij/).
Make sure your image(s) is in a format recognizable by ImageJ and open it (File:Open).
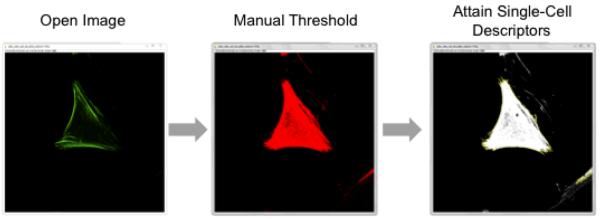
Set the upper and lower threshold according to your label of interest in the “Threshold” window (Image:Adjust:Threshold), and click “Apply.” This will convert any pseudo-colored image to greyscale (see Figure 2).
Choose quantitative descriptors of interest in the “Set Measurements” window (Analyze:Set Measurements).
Acquire measurements by accessing the “Analyze Particles” window (Analyze:Analyze Particles) and check the following options: Display results, Clear Results & Summarize. Leave every other option unchecked and click “OK”.
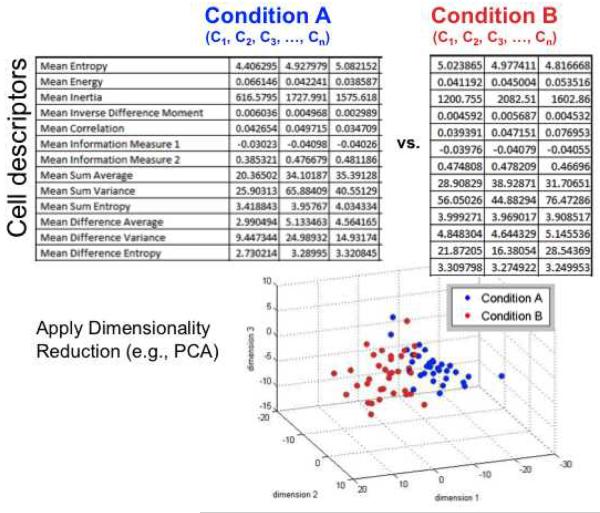
Selected quantitative descriptors will be measured and displayed in the “Results” window (Figure 3). This data can be saved as a spreadsheet (File:Save As). ImageJ offers several options to analyze this data in the “Results” tab of the “Results” window.
Figure 2.

Basic digital image processing steps on high resolution micrographs of cells yield images of single cells and intracellular organization that can be subsequently processed to yield cell descriptors.
Figure 3.
Single cell descriptors can be obtained and compared between two different treatment conditions following dimensionality reduction techniques such as principal component analysis (PCA). The three dimensions on the graph for example represent the three most influential combinations of cell descriptors that can parse the two cell populations shown in blue and red.
3.3 Dimension Reduction Analysis Using MATLAB
Open Matlab (Mathworks) equipped with their “Statistics Toolbox”.
Input your quantitative descriptor data banks as matrices, with each column corresponding to a different descriptor and each row corresponding to a different single cell. Assign different variables corresponding to different cell phenotypes or conditions.
Obtain the Matlab Toolbox for Dimensionality Reduction (http://www.mathworks.com/matlabcentral/linkexchange/links/1626-the-matlab-toolbox-for-dimensionality-reduction OR http://cseweb.ucsd.edu/~lvdmaaten/dr/download.php)
Implement dimension reduction algorithms via multidimensional scaling or principal component analysis (see Note 6; Figure 3).
4. Notes
For best results for immunocytochemistry, try incubation with several concentrations of antibody based on recommended levels for similar protein(s) and cell type(s) of interest and maximize signal-to-noise ratio relative to background staining and negative controls (isotype and secondary alone controls).
Culture hMSCs in expansion flasks (e.g., T25s, T75s). High-content imaging is best suited for sub-confluent seeding densities. 50% confluency is generally achieved when in any given field of view 50% is cells, and 50% is void space.
First aliquot a small, yet representative sample of cell suspension. Next, add Trypan Blue Stain and note the dilution factor. Then, add 10μL to a standard hemocytometer. To calculate cell solution concentration (number of cells per mL): a) divide cell count by number of quadrants counted, b) multiply by dilution factor, and c) multiply by 10,000.
It is recommended to use a standard rocker for this step.
This step and all subsequent steps should be performed with minimal light exposure in order to prevent bleaching of the secondary antibody fluorophore. At the final step, use an anti-fade reagent to preserve samples for prolonged or repeated imaging.
The output values of sensitivity and specificity provide statistical measures of classification accuracy.
Acknowledgments
This study was partially supported by NIH P41 EB001046 (RESBIO, Integrated Resources for Polymeric Biomaterials), Rutgers University Academic Excellence Fund, and NSF Stem Cell IGERT 0801620.
References
- 1.Causa F, Netti PA, Ambrosio L. A multi-functional scaffold for tissue regeneration: the need to engineer a tissue analogue. Biomaterials. 2007;28(34):5093–9. doi: 10.1016/j.biomaterials.2007.07.030. [DOI] [PubMed] [Google Scholar]
- 2.Guarino V, Causa F, Ambrosio L. Bioactive scaffolds for bone and ligament tissue. Expert review of medical devices. 2007;4(3):405–18. doi: 10.1586/17434440.4.3.405. [DOI] [PubMed] [Google Scholar]
- 3.Pasquinelli G, et al. Mesenchymal stem cell interaction with a non-woven hyaluronan-based scaffold suitable for tissue repair. Journal of anatomy. 2008;213(5):520–30. doi: 10.1111/j.1469-7580.2008.00974.x. [DOI] [PMC free article] [PubMed] [Google Scholar]
- 4.Reed CR, et al. Composite tissue engineering on polycaprolactone nanofiber scaffolds. Annals of plastic surgery. 2009;62(5):505–12. doi: 10.1097/SAP.0b013e31818e48bf. [DOI] [PubMed] [Google Scholar]
- 5.Shea LD, et al. Engineered bone development from a pre-osteoblast cell line on three-dimensional scaffolds. Tissue engineering. 2000;6(6):605–17. doi: 10.1089/10763270050199550. [DOI] [PubMed] [Google Scholar]
- 6.Weber N, et al. Small changes in the polymer structure influence the adsorption behavior of fibrinogen on polymer surfaces: validation of a new rapid screening technique. Journal of biomedical materials research. 2004;68(3):496–503. doi: 10.1002/jbm.a.20086. [DOI] [PubMed] [Google Scholar]
- 7.Flaim CJ, Chien S, Bhatia SN. An extracellular matrix microarray for probing cellular differentiation. Nature methods. 2005;2(2):119–25. doi: 10.1038/nmeth736. [DOI] [PubMed] [Google Scholar]
- 8.Dittrich PS, Manz A. Lab-on-a-chip: microfluidics in drug discovery. Nature reviews: Drug discovery. 2006;5(3):210–8. doi: 10.1038/nrd1985. [DOI] [PubMed] [Google Scholar]
- 9.Levsky JM, Singer RH. Gene expression and the myth of the average cell. Trends in cell biology. 2003;13(1):4–6. doi: 10.1016/s0962-8924(02)00002-8. [DOI] [PubMed] [Google Scholar]
- 10.Vega SL, et al. High-content imaging-based screening of microenvironment-induced changes to stem cells. Journal of biomolecular screening. 2012;17(9):1151–62. doi: 10.1177/1087057112453853. [DOI] [PMC free article] [PubMed] [Google Scholar]
- 11.Treiser MD, et al. Cytoskeleton-based forecasting of stem cell lineage fates. Proceedings of the National Academy of Sciences of the United States of America. 2010;107(2):610–5. doi: 10.1073/pnas.0909597107. [DOI] [PMC free article] [PubMed] [Google Scholar]
- 12.Liu E, et al. Parsing the early cytoskeletal and nuclear organizational cues that demarcate stem cell lineages. Cell cycle. 2010;9(11):2108–17. doi: 10.4161/cc.9.11.11864. [DOI] [PubMed] [Google Scholar]
- 13.Vidi PA, et al. Interconnected contribution of tissue morphogenesis and the nuclear protein NuMA to the DNA damage response. J Cell Sci. 2012;125(Pt 2):350–61. doi: 10.1242/jcs.089177. [DOI] [PMC free article] [PubMed] [Google Scholar]
- 14.McNamara LE, et al. Skeletal stem cell physiology on functionally distinct titania nanotopographies. Biomaterials. 2011;32(30):7403–10. doi: 10.1016/j.biomaterials.2011.06.063. [DOI] [PubMed] [Google Scholar]


