

Abstract
How cells degenerate from oxidative stress in aging-related disease is incompletely understood. The study’s intent was to identify key cytoprotective pathways activated by oxidative stress, and determine the extent of their protection. Using an unbiased strategy with microarray analysis, retinal pigmented epithelial (RPE) cells treated with cigarette smoke extract (CSE) had over-represented genes involved in the antioxidant and unfolded protein response (UPR). Differentially expressed antioxidant genes were predominantly located in the cytoplasm, with no induction of genes that neutralize superoxide and H2O2 in the mitochondria, resulting in accumulation of superoxide and decreased ATP production. Simultaneously, CSE induced the UPR sensors IRE1α, p-PERK, and ATP6, including CHOP, which was cytoprotective because CHOP knockdown decreased cell viability. In mice given intravitreal CSE, the RPE had increased IRE1α and decreased ATP, and developed epithelial-mesenchymal transition, as suggested by decreased LRAT abundance, altered ZO1 immunolabeling, and dysmorphic cell shape. Mildly degenerated RPE from early AMD samples had prominent IRE1α, but minimal mitochondrial TOM20 immunolabeling. While oxidative stress is thought to induce an antioxidant response with cooperation between the mitochondria and ER, herein, we show that mitochondria become impaired sufficiently to induce epithelial-mesenchymal transition despite a protective UPR. With similar responses in early AMD samples, these results suggest that mitochondria are vulnerable to oxidative stress despite a protective UPR during early phases of aging-related disease.
Keywords: Aging-related disease, epithelial-mesenchymal transition, ER stress, Mitochondria, Oxidative stress
Introduction
Oxidative stress is a well-established factor that contributes to several aging-related diseases where an inadequate cytoprotective response converts physiologic reactive oxygen species (ROS) into contributors of cellular dysfunction. Most studies have focused on specific components of this cytoprotective response without establishing the relative contribution of each component relative to another. Determining the elements that protect and those that fail would help understand how these complex diseases develop.
Age-related macular degeneration (AMD), the leading cause of blindness among the elderly, is a prototypical aging-related disease that, based on epidemiologic, genetic, and clinical evidence, is heavily influenced by oxidative stress. Epidemiologic studies have identified cigarette smoking, a complex mixture of nearly 5000 oxidants, as the strongest risk factor for AMD[1–4]. Single-nucleotide polymorphisms in mitochondrial genes are associated with AMD risk, implicating perturbations in energy metabolism with AMD development[5]. The Age-Related Eye Disease Study trial showed that high dose antioxidant supplementation reduced progression to advanced AMD in patients with intermediate, dry AMD[6].
The retinal pigmented epithelium (RPE) is a central cell type involved in AMD. Due to the high ambient oxygen tensions required to maintain its high metabolism that is necessary to maintain the health and function of the overlying photoreceptors, and the unique, constant exposure to photo-oxidative stress, the RPE is armed with a robust antioxidant system[7, 8], making it a valuable model to study the oxidative stress response. During early AMD, the RPE cell becomes progressively dysfunctional, and finally dies by apoptosis[9, 10]. Part of this deterioration has been attributed to inadequately neutralized oxidative stress, despite a potent antioxidant system, because oxidatively damaged biomolecules have been identified in the RPE from AMD samples[11–13].
Why the RPE in particular, and cells in general become oxidatively injured is incompletely understood, and how they respond to survive is also not entirely understood. The mitochondria and endoplasmic reticulum (ER) have been implicated in oxidative stress related disease. Mitochondria are the major source of cellular ROS[14, 15], which can be increased by exogenous stressors such as cigarette smoke[16–19], and must rely upon their own antioxidant system to maintain function. The ER provides the optimal environment for the synthesis, folding, and assembly for producing mature proteins, and is subject to oxidative injury. Indiscriminate accumulation of unfolded or damaged proteins within the ER lumen results in “ER stress” and is one downstream consequence of oxidative stress that must be resolved for the cell to maintain proper function. To restore homeostasis, the ER triggers the unfolded protein response (UPR), which is a sophisticated and coordinated transcriptional response that inhibits general transcription and translation while selectively enhancing the machinery for protein folding and degradation by the proteasome after retrograde transport to the cytosol. While these two organelles appear to be prime targets of oxidative stress, currently, it remains unclear how the collective cellular response protects against cellular dysfunction, and how the mitochondria and ER, as part of this collective response, react to oxidative stress. We therefore, took an unbiased approach using microarray analysis to first identify the elements of the cytoprotective response and with follow-up experiments, determined their relative contribution to RPE degeneration after oxidative stress.
Materials and Methods
Cell culture
The maintenance of the human ARPE-19 cell line has been previously described[20]. For experiments, cells were seeded at 100,000/cm2 and grown in Dulbecco’s Modified Eagle medium/Hams F12 (DMEM/F12) with 15mM Hepes buffer and 10% fetal bovine serum (FBS) and 2mM L-glutamine solution at 37°C until confluent, and then grown in DMEM/F12 with 1% bovine serum albumin (BSA). All experiments were performed at least 3 times.
Cigarette smoke extract (CSE)
CSE (Murty Pharmaceuticals, Inc., Lexington, KY) is 40mg/ml condensate, and 6% nicotine prepared by smoking University of Kentucky’s 3R4F Standard Research Cigarettes on an FTC Smoke Machine. The smoke on the filter is calculated by the weight gain of the filter after smoking. The amount of DMSO is calculated that will dissolve a 4% (40mg/mL) solution.
Cell viability
Cell viability was evaluated with the Propidium Iodide (PI) Viability Assay (Invitrogen Inc., Carlsbad, CA) following the manufacturer’s protocol. Confluent, serum-starved cultures were treated with 0–500μg/ml CSE for 24h, and labeled with 1μg/ml PI and Hoechst 33342 (1μg/ml). Live and dead cells were counted using the Cellomics ArrayScan VTI HCS Reader (Thermo Fisher Scientific, Waltham, MA). Some experiments measured apoptosis using fluorescein isothiocyanate(FITC)-conjugated annexin V (5μl/well), according to the manufacturer’s protocol (Invitrogen). The percentage of early apoptotic (FITC annexin V positive), late apoptotic (FITC annexin V and PI positive), or necrotic (PI positive) cells was calculated over the total cell population (Hoechst-positive cells).
Measurement of cellular ROS
Confluent cultures were treated with 0–500μg/ml CSE for 24h. To measure superoxide anion (O2·-), cells were labeled with 10μM dihydroethidium (DHE; Invitrogen) for 30min in the dark. Ethidium-DNA fluorescence was measured using a microplate reader (excitation 485nm, emission 590nm.) To measure mitochondrial superoxide anion, the Mitosox Red assay (Invitrogen) was used according to the manufacturer’s recommendation. Cells were immersed in 5μM Mitosox Red labeling solution and Hoechst (1μg/ml) for 10 min at 37°C and Mitotracker red staining per cell was quantified using the Cellomics ArrayScan HCS system.
RNA extraction
Total RNA was extracted using the RNeasy Mini-kit (Qiagen Inc., Gaithersburg, MD) according to the manufacturer’s recommendation. RNA quality was confirmed using the Agilent Bioanalyzer (Agilent Technologies, Palo Alto, CA).
Transcriptional profiling by oligonucleotide microarray
5μg total RNA was used to synthesize first strand cDNA using oligonucleotide probes with 24 oligo-dT plus T7 promoter (Proligo LLC, St. Louis, MO), and the SuperScript Choice System (Invitrogen). cRNA probe was generated and biotinylated using the BioArray RNA High Yield Transcript Labeling kit (ENZO Life Sciences Inc). Fragmented cRNA (10μg) was hybridized to the GeneChip Human Exon 1.0 ST Array (Affymetrix, Inc, Santa Clara, CA) for 16h at 45°C, and incubated with streptavidin-phycoerythrin conjugate. Staining was amplified with biotinylated goat anti-streptavidin antibody, followed by staining with a streptavidin-phycoerythrin conjugate. Fluorescence was detected using the Affymetrix G3000 GeneArray Scanner and GeneChips were analyzed with the GeneChip Operating System 1.1.1 (GCOS) software from Affymetrix.
Microarray data analysis
Gene expression was analyzed using Partek® software (version 6.3 Copyright © 1993–2010, Partek Inc., St. Louis, MO). We performed GC pre-background adjustment, RMA background correction based on core-level probes annotated by Affymetrix. Quantile normalization was performed across all 9 microarrays for different conditions. The gene expression was summarized as mean value of all core-level exons of a gene. The genes with low expression (25% lowest expression level) over all conditions were removed from further analysis.
Differentially expressed genes (DEGs)
The DEGs were determined based on both fold changes (FC) and P values. The P value was calculated using the unpaired t-test among different conditions. We chose the cutoffs of p < 0.05 and |FC| > 1.5 (linear).
Gene Ontology (GO) analysis
To determine whether certain biological functions (GO terms) were enriched in the differentially expressed genes (DEGs), we calculated the enrichment score as the ratio of percentage of DEGs associated with the GO term to the percentage of all genes on the microarray associated with the same GO term. The GO term was selected as an enriched GO if its enrichment score was larger than 1.5 and its P-value was less than 0.05 after multiple-test Bonferroni correction. The P-value was calculated based on the cumulative hypergeometric distribution[21].
Quantitative real-time RT-PCR (RT-qPCR)
Reverse transcription was performed using random hexamers and MultiScribe reverse transcriptase according to the manufacturer’s recommendations (Applied Biosystems, Foster City, California). RT-qPCR analyses were performed using Assay-on-Demand primers and probe sets (Applied Biosystems) with a StepOnePlus Taqman system (Applied Biosystems). β-actin was used for normalization.
Transfection of small interfering RNA
Small interfering RNA (siRNA) targeting human CHOP and non-targeting control siRNA (Applied Biosystems) were used as previously described[22]. Cells were transfected with either 30nM CHOP siRNA or control siRNA using Lipofectamine 2000 (Invitrogen) for 24h. Cells were serum starved for 24h, and treated with 0–500μg/ml CSE or DMSO. After 24h, cell viability was assessed, and RNA or protein was extracted.
Western analysis
Western analysis was performed as described[23]. Cell lysates (10μg protein) were separated on a 4% to 20% SDS-PAGE and electrophoretically transferred to a nitrocellulose membrane (Life Technologies, Grand Island, NY). Membranes were incubated with the intended primary antibody (mouse monoclonal anti-ATF6 (1:500, Santa Cruz); rabbit polyclonal anti-Caspase-3 (1:500, Cell Signaling); mouse monoclonal anti-Caspase-4 (1:500, Santa Cruz); mouse monoclonal anti-CHOP (1:500, Santa Cruz); rabbit polyclonal anti-IRE1a (1:500, Santa Cruz); rabbit polyclonal anti-p-PERK (1:500, Santa Cruz); mouse monoclonal anti-LRAT (1:500, Santa Cruz)), and then the appropriate horseradish peroxidase conjugated secondary antibody (rabbit polyclonal mouse IgG (1:5000, Abcam) or goat polyclonal rabbit IgG (1:5000, Abcam). Signal was detected with a chemiluminescence detection system (Supersignal West Pico Chemiluminescence, Thermo Fisher Scientific, Waltham, MA). Blots were imaged with an ImageQuant LAS4000 scanner (GE Healthcare, Inc, Piscataway, NJ), and band intensity is reported as arbitrary densitometric units. b-Actin was used for signal normalization across samples.
Proteasome Activity Assay
Cell lysates (100ug) were used to isolate proteasomes using a proteasome isolation kit (Calbiochem, Gibbstown, NJ) following manufacturer’s instructions. Peptidase activity was determined using the proteasome SDS-activated activity assay (Calbiochem, Gibbstown, NJ). The fluorogenicpeptides Suc-LLVY-AMC was used as substrate to analyze the chymotrypsin-like activity of the proteasome.
Celltiter-Glo ATP assay
Confluent cultures were treated with 100–500μg/ml CSE or control (DMSO) for 24h. ATP content was determined using the CellTiter-Glo (CTG) ATP assay (Promega, Inc., Madison, WI) following the manufacturer’s protocol. 30min after adding CTG, samples were read on a luminometer (Fluorstar, BMG Labtech, Cary, NC). CTG signal was normalized to protein content for each sample using the Protein DC Assay (BioRad, Inc., Hercules, CA). To measure ATP content of RPE in vivo, after removing the retina, eye cups were placed in a solution containing 49% CTG, 49% RIPA buffer (Sigma-Aldrich, Inc, St. Louis, MO) and 2% protease inhibitor cocktail P8340 (Sigma-Aldrich). Samples were sonicated on ice, cellular debris was removed by centrifugation at 25400g for 30 min at 4°C, and the supernatant was analyzed with a luminometer. The relative fluorescent intensity was normalized to total protein.
CSE treatment to Mice
C57Bl6/J mice (2 months old) were given 250ug/ml CSE by intravitreal injection in one eye and an equal volume (1ul) of vehicle control in the contralateral eye using a microinjection pump (Harvard Apparatus, Holliston, MA). After sacrifice (1–10 days), eyes were enucleated, and the RPE/choroid was prepared for Western analysis by extracting protein or for flatmount fluorescence immunohistochemistry.
Flatmount fluorescence immunohistochemistry
RPE-choroid-scleras were fixed in 2% paraformaldehyde. Flatmounts were rinsed with TBS that included 1% Triton X100, blocked with TBS/1%BSA with 5% goat serum overnight at 4°C, 2.5ug/ml anti-ZO1 antibody (Invitrogen, Inc) overnight at 4°C, and then Alexa Fluor 594 goat anti-rabbit antibody (1:200) overnight at 4°C. Flatmounts were examined with a confocal microscope (ZEN LSM 710, Carl Zeiss Microscopy, LLC, Thornwood, NY).
Human Tissue Processing
The protocol in this study adhered to the tenets of the Declaration for Helsinki for research involving human tissue. Human autopsy eyes (n=13) were obtained from the Ocular Pathology Division at the Wilmer Eye Institute. Donors were classified as “unaffected” (n=6) if they had no AMD history or histopathologic evidence of drusen. Early AMD donors (n=7) had an AMD history, and macular drusen, but no late stage disease such as geographic atrophy or choroidal neovascularization. Small drusen were defined as having a diameter of ≤4 RPE cells (approximately 63um) and large drusen as >8 RPE cells (approximately 125um). Eyes were fixed in 4% formaldehyde, paraffin embedded, and sectioned at 4μm thickness.
Immunohistochemistry
After deparaffinizing sections, antigens were retrieved using the Target Retrieval System (Dako, Inc., Carpinteria, CA) according to the manufacturer’s instructions. Sections were blocked with horse serum and then incubated with rabbit monoclonal human anti-IRE1α (1:50; Cell Signaling Technology, Inc., Danvers, MA) and rabbit polyclonal human anti-TOM20 (1:50; Santa Cruz Biotechnology) or rabbit IgG control overnight at 4°C, with biotinylated anti-rabbit IgG or anti-mouse IgG (Vectastain®ABC-AP Kit; Vector Labs, Burlingame, CA), and then with the ABC-AP. Slides were incubated with levamizole added to blue substrate working solution for 15 minutes. Sections were imaged with a light microscope equipped with the Cri-Nuance system (Perkin Elmer Corp, Inc. Hopkinton, MA) to subtract out melanin pigment.
Results
Cigarette Smoke Extract (CSE) induces oxidative stress and damage in RPE cells
To systematically understand the cytoprotective response from oxidative stress and how failure of this response contributes to cellular degeneration, we exposed RPE cells to CSE, a complex chemical oxidant, and in a comprehensive and agnostic fashion, determined the global transcriptional response in viable cells using microarray analysis. We first established that an exposure range of 0–250ug/ml CSE for 24h did not decrease the viability of confluent ARPE-19 cultures (Fig. 1). Cells were then treated with 100–250μg/ml CSE for 24h for microarray analysis. Principal component analysis of differentially expressed genes shows an obvious transcriptional separation between cells exposed to CSE and vehicle control (Fig. 2). The differential expression of selected genes was verified by RT-qPCR (Table 1). GO analysis identified differentially expressed genes with function related to the antioxidant response, UPR, and mitochondrial location were over-represented after treatment with CSE compared to vehicle treated cells (Table 2).
Figure 1.

ARPE-19 cells remain viable after exposure to CSE, except at 500ug/ml CSE using the Propidium Iodide assay. ***p<0.001; n=3 independent experiments.
Figure 2.
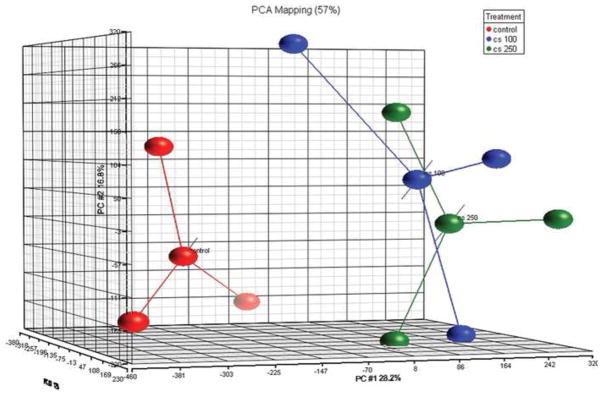
Principal component analysis of differentially expressed genes shows transcriptional separation between cells exposed to CSE 100ug/ml (blue dots) and 250ug/ml (green dots) from vehicle control (red dots).
Table 1.
Confirmation of differentially expressed genes by RT-qPCR FC, fold change.
| Microarray | RT-qPCR | |||||||
|---|---|---|---|---|---|---|---|---|
|
| ||||||||
| Gene symbol | FC CSE100/c on (Log2) | P value | FC CSE250/con (Log2) | P value | FC CSE100/con (Log2) | P value | FC CSE250/con (Log2) | P value |
|
| ||||||||
| GCLM | 1.74 | 0.0069 | 2.45 | 0.0025 | 1.60 | 0.0009 | 2.97 | 0.0002 |
| HMOX1 | 2.46 | 0.0027 | 4.23 | 0.00001 | 2.10 | 0.001 | 5.26 | 5.99E-05 |
| NQO1 | 2.50 | 0.0262 | 2.48 | 0.0251 | 2.13 | 0.002 | 2.58 | 3.76E-05 |
| CYP1A1 | 2.73 | 0.0001 | 2.35 | 0.0003 | 5.56 | 1.35E-08 | 4.78 | 2.88E-05 |
| TMX4 | 1.06 | 0.0055 | 1.29 | 0.0036 | 0.88 | 0.0008 | 1.10 | 7.43E-05 |
| SLC7A11 | 3.00 | 0.00011 | 3.28 | 6.88E-05 | 1.55 | 2.06E-06 | 2.63 | 4.08E-10 |
| DNAJB11 | 0.62 | 0.0156 | 0.99 | 0.0018 | 0.79 | 0.01 | 0.71 | 0.0005 |
| HYOU1 | 1.55 | 0.0035 | 1.77 | 0.0023 | 0.43 | 0.0004 | 2.13 | 3.06E-05 |
| ALG6 | 1.30 | 0.0182 | 1.50 | 0.0127 | 1.12 | 0.004 | 2.55 | 3.85E-05 |
| ME1 | 1.05 | 0.0010 | 1.62 | 0.0023 | 0.60 | 0.0001 | 1.59 | 1.2E-06 |
| PARP1 | 0.73 | 0.00487 | 0.69 | 0.007 | 0.57 | 0.01 | 0.49 | 0.03 |
| ELOVL4 | 0.80 | 0.00023 | 1.07 | 4.91E-05 | 0.53 | 1.27E-06 | 1.64 | 6.95E-06 |
| CRELD2 | 1.12 | 0.0315 | 1.18 | 0.0206 | 0.75 | 0.01 | 0.37 | 4.59E-05 |
Table 2.
Summary of enriched differentially expressed genes after CSE.
| Category | Number of Genes | Number of DEG | Enrichment score | p-value (enriched in DEGs) |
|---|---|---|---|---|
| Oxidative Stress | 966 | 84 | 8.7 | 1.70E-05 |
| UPR | 1929 | 175 | 9.07 | 2.23E-11 |
| Mitochondria | 1257 | 81 | 6.44 | 0.02 |
DEG, differentially expressed genes.
Proper neutralization of reactive oxygen species (ROS) is maintained by multiple interacting antioxidant systems. Superoxide is dismutated to H2O2 by SOD, and H2O2 is neutralized by catalase, and the glutathione and thioredoxin networks, which have evolved into separate cytoplasmic and mitochondrial systems. Supplemental Table 1 lists the differentially expressed genes with antioxidant function. The antioxidant transcriptional analysis highlights two trends. First, the majority of differentially expressed genes reside in the cytoplasm (79%) while 21% are located in the mitochondria. For example, of the 9 glutathione system genes induced, 7 reside in the cytoplasm and 2 are within the mitochondria while of the 3 thioredoxin system genes induced, 2 had cytoplasmic and 1 had mitochondrial location. Cytoplasmic glutathione synthesis machinery induced by CSE included both the regulatory subunit GCLM and the catalytic subunit GCLC of Glutamate-cysteine ligase, the rate limiting step in glutathione synthesis, and SLC7A11 which codes for the cystine-glutamate exchanger, the transporter responsible for the providing cells with cysteine, the rate-limiting amino acid necessary for glutathione synthesis[24]. Secondly, the transcriptional antioxidant response was incomplete. For example, both cytoplasmic SOD1 and mitochondrial SOD2, the principal neutralizers of superoxide, were not induced by CSE. Of the enzymes that neutralize H2O2, catalase, which is primarily involved in cytoplasmic, but not mitochondrial neutralization of H2O2[25], was not induced. In addition, the principal neutralizers of H2O2 in the mitochondria, Periredoxin-3 (Prx3) of the thioredoxin system and Glutathione Peroxidase-1 and -4 (GPx1, GPx4) of the glutathione system, were not induced. The thioredoxin and glutathione systems also donate electrons to mitochondrial Prx3 and the GPx’s, respectively [26–30]. Mitochondrial thioredoxin genes including Thioredoxin-2 and Thioredoxin reductase-2 were not induced by CSE. The NADPH system, the ultimate reductant for both the glutathione and thioredoxin systems, had several genes differentially expressed from the cytoplasm (n=3) and mitochondria (n=2). However, ME3, a mitochondrial gene important for NADPH regeneration, was downregulated by CSE.
We confirmed an incomplete antioxidant response by measuring superoxide as a marker of ROS, which was formed in a dose-dependent fashion (Fig. 3A). This degree of ROS induced oxidative injury in viable cells, as illustrated by protein carbonyl formation, a marker of irreversible oxidative protein damage (Fig. 3B, C). With increasing CSE dose, cells became susceptible to death. Of cells that died, we found that cells transitioned from early apoptosis without death (annexin V positive, PI negative) after 100ug/ml CSE, to late apoptosis or necrosis at the highest dose (500ug/ml; Fig. 3D).
Figure 3.

A. ARPE-19 cells exposed to CSE produce superoxide in a dose-dependent manner, as assessed by the DHE assay. *p<0.05; n=3 independent experiments. B. ARPE-19 cells exposed to CSE accumulate carbonylated proteins. Arrows were used to quantify the relative abundance of carbonylated proteins of different size. Lanes to the right of each condition are negative controls where proteins were not derived to expose carbonyl groups. C. Graphs of relative carbonylated protein at the arrows in B. *p<0.05, **p<0.01. D. ARPE-19 cells exposed to CSE developed in a dose-dependent manner, early apoptosis (annexin V+, PI-; green) at viable doses, and then late apoptosis (annexin V+, PI+; yellow), and necrosis (annexin V-, PI+; red). ***p<0.001; n=3 independent experiments.
The UPR protects RPE cells from cell death
Oxidative stress including cigarette smoke is known to induce protein carbonylation, which are distributed throughout the cell including the ER[31]. These damaged proteins can be sensed, resulting in the UPR, which is an early and downstream cytoprotective response elicited by the ER. Supplemental Table 2 lists the145 differentially expressed genes involved in the UPR after CSE exposure. This response, which coincides with the accumulation of oxidatively damaged proteins (Fig. 3B, C), includes genes encoding transcriptional and translational regulation, protein folding such as protein glycosylation, and transport/chaperones including HSP family genes, and degradation. The number of differentially expressed UPR genes increased from 13 with 100ug/ml CSE to 132 genes after 250ug/ml CSE. Because the largest transcriptional cytoprotective response involved the UPR, we focused further studies on this aspect of the cell’s response.
The UPR is activated by 3 stress sensors, including protein kinase RNA-activated-like ER kinase (PERK), inositol requiring enzyme 1α (IRE1α), and activating transcription factor 6 (ATF6)[32]. Consistent with UPR transcriptional activation, we next found that all three of these canonical UPR sensors were increased in a dose-dependent fashion (Fig. 4A-C). We also found that CHOP, which can be activated by any of these UPR sensors[33], was not induced with viable CSE doses, but was increased with 500ug/ml CSE, a dose that induced mild cell death (Fig. 4D). CHOP signaling is most commonly known to induce apoptosis[34, 35], but it can also be cytoprotective[36, 37]. To make this determination, we knocked down CHOP using an siRNA and found by decreasing CHOP mRNA by 70% compared to scrambled siRNA, that cell viability decreased from 90% to 76% with CSE 500ug/ml (p<0.01, Fig. 4E). These results suggest that the UPR including CHOP protects against cell death by CSE. Apoptosis can also be mediated through the ER by caspase-4, which can activate caspase-9, independent of CHOP[33]. However, using western analysis, neither caspase-4 nor its cleaved product was induced by any CSE dose relative to controls (Supplementary Fig 1).
Figure 4.

CSE induces the UPR in ARPE-19 cells. A. Representative western blots of A) IRE1α, B) p-PERK, C) ATF6, and D) CHOP using b-Actin as a loading control, and graph quantifying the relative abundance from 3 independent experiments for each protein after ARPE-19 cells were exposed to CSE. *p<0.05, **p<0.01. Note that because ATF6 is proteolyzed in response to ER stress, the full length protein decreases. E. CHOP is protective after ARPE-19 cells are exposed to CSE because CHOP knockdown using an siRNA to CHOP decreased cell viability compared to scrambled control siRNA. **p<0.01; n=3 independent experiments.
CSE impairs the proteasome response
Oxidatively damaged cytosolic proteins or misfolded proteins targeted for removal by the ER can be retrotranslocated to the cytosol and degraded by the proteasome system. We therefore, evaluated the extent that damaged proteins were removed by the proteasome by measuring proteasome activity. At all CSE doses, proteasomal activity was impaired (p<0.01; Fig. 5A). To determine if proteasome inhibition could induce cell death, cells were treated with a non-toxic dose of the proteasome inhibitor MG-132 (1μM), which has a Ki=4nM[38], and then with CSE. Fig. 5B shows that while MG-132 alone, or in combination with 100μg/ml CSE, does not decrease viability, but when combined with higher CSE doses, viability was decreased (p<0.05). These results suggest that CSE impairs the protective proteasomal response, but not to the extent that it decreases cell viability.
Figure 5.

CSE impairs the proteasome. A. CSE impairs proteasome activity using the proteasome SDS-activated activity assay at all doses of CSE compared to vehicle control treated ARPE-19 cells. **p<0.01; n=3 independent experiments. B. Non-toxic doses of proteasome inhibitor MG-132 alone or combined with 100ug/ml CSE, did not alter cell viability using the Propidium Iodide assay, but when combined with higher doses of CSE, decreased viability compared to controls. *p<0.05; n=3 independent experiments.
CSE induces mitochondrial dysfunction
CSE influenced mitochondrial gene expression. Supplemental Table 3 shows the 76 differentially expressed genes that reside in the mitochondria, with reported functions that include electron transport, citric acid cycle, oxidative stress, ion transport, mitochondrial UPR, and apoptosis. The incomplete mitochondrial antioxidant response and increased superoxide formation by CSE points to a mitochondrial source. We verified this possibility using the Mitosox assay, which showed that superoxide was increased by CSE (Fig. 6A). With these same CSE doses, ATP production was decreased, suggesting an uncoupling of oxidative phosphorylation, and mitochondrial dysfunction (Fig. 6B).
Figure 6.
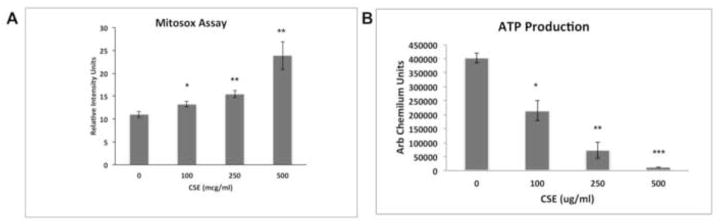
CSE induces mitochondrial injury. A. A dose dependent increase in mitochondrially generated superoxide, as measured by the Mitosox assay, and B. a decrease in ATP production was observed in ARPE-19 cells treated with CSE. *p<0.05, **p<0.01; ***p<0.001; n= 3 independent experiments.
CSE induces the UPR and mitochondrial dysfunction in the RPE of mice
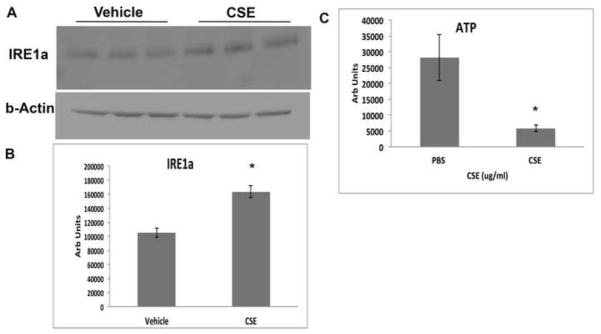
Because the extent of cell differentiation is limited in culture, to examine whether oxidative stress on the ER and mitochondria has functional impact on RPE differentiation, we exposed the RPE of C57Bl6J mice to 250ug/ml CSE by intravitreal injection. After 24h, IRE1α protein was increased (p<0.05) while ATP levels were reduced (p<0.05) in the RPE of mice that received CSE compared to controls (n=6 per group; Fig. 7A–C). These results suggest a compensatory UPR at a time when mitochondria have become impaired. Mitochondrial dysfunction can induce epithelial-mesenchymal transition (EMT) of the RPE, a relevant change in AMD[39]. Seven days following CSE injection, the RPE of CSE injected eyes had decreased TOM20 protein, a mitochondrial protein (p<0.05; Fig. 8A, B), and decreased LRAT, a microsomal enzyme that catalyzes the esterification of all-trans-retinol into all-trans-retinyl ester, an essential reaction for the retinoid cycle in visual system, that is reduced with EMT[39] (Fig. 8C, D), and by 10 days, developed enlarged and irregular cell shape instead of the typical hexagonal morphology, and ZO1 immunolabeling became irregular in intensity and cell location (Fig. 8E, F). We confirmed these findings by giving three intravenous doses of 125ug/ml CSE (total volume 50ul) every other day. After the first CSE injection, similar to intravitreal CSE, IRE1α protein was increased (p<0.05; n=3) while ATP levels were reduced (p<0.05; n=3) in the RPE of mice that received CSE compared to controls (Fig. 9A–C). Ten days after the first CSE injection, TOM20 was decreased (p<0.05; n=4; Fig. 10A–B), as was LRAT compared to PBS control injected mice (p<0.05; n=4; Fig. 10C–D). In addition, the RPE morphology was disrupted and ZO-1 immunolabeling was became irregular (n=4; Fig. 10E). The decreased LRAT, irregular ZO1 immunolabeling, and altered cell shape suggest EMT of the RPE following CSE injection.
Figure 7.
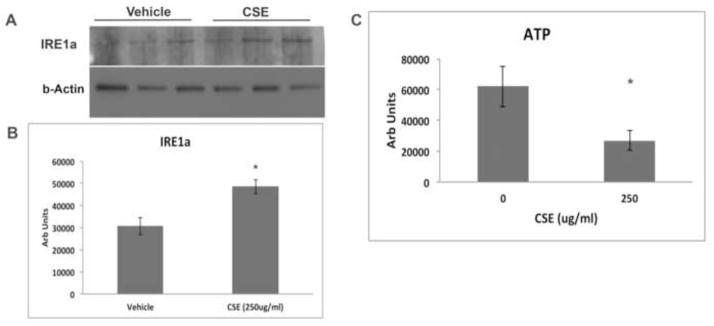
The UPR is induced and mitochondria are injured in the RPE/choroid 24 hours after mice were given an intravitreal injection of CSE. A. Western blot of IRE1α after mice received intravitreal injection of 250ug/ml CSE in one eye and vehicle in the other eye. B. Graph showing increased IRE1α protein in the RPE/choroid after intravitreal injection of 250ug/ml CSE compared to vehicle control. *p<0.05; n=3 eyes per condition. C. Graph showing decreased ATP production in the RPE/choroid of eyes that received an intravitreal injection of 250ug/ml CSE compared to vehicle control. *p<0.05; n=6 eyes per condition.
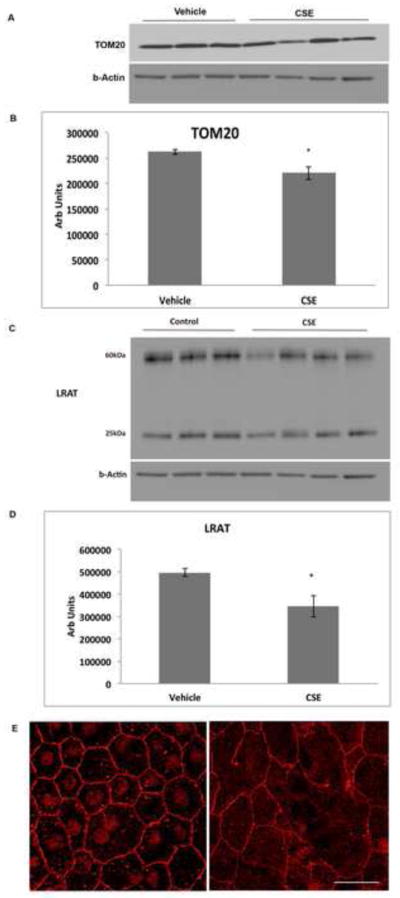
Figure 8.
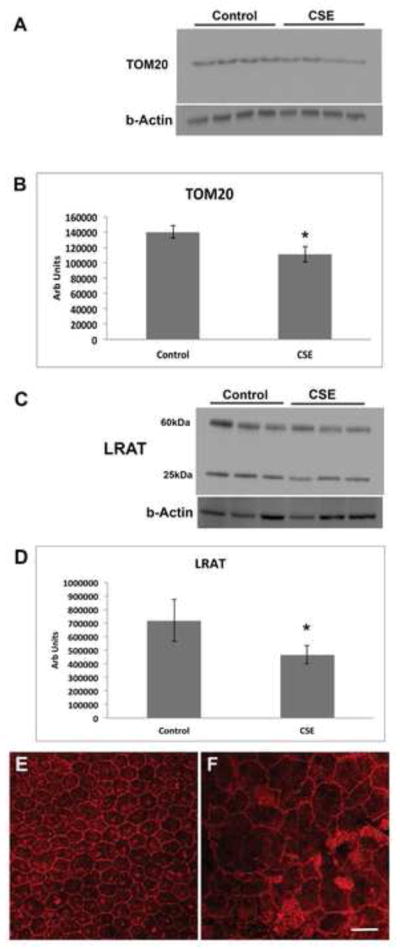
Intravitreal CSE induces epithelial-mesenchymal transition. Mice were given intravitreal injection of 250ug/ml CSE or vehicle control. A. Western blot of TOM20 using b-Actin as a loading control. B. Graph showing decreased TOM20 in the RPE/choroid 7 days after CSE treatment; n=4 eyes per condition. *p<0.05. C. Western blot of LRAT using b-Actin as a loading control. The 25kDa band represents the monomer and the 60kDa band represents the dimer. D. Graph showing decreased LRAT (monomer and dimer) in the RPE/choroid 7 days after CSE treatment; n=3 eyes per condition. *P<0.05. E. Representative confocal micrograph of an RPE flatmount of a vehicle control injected eye 10 days after CSE treatment. Note the regular cobblestone shape of the RPE and the regular ZO-1 immunostaining at the cell periphery. F. Representative RPE flatmount of CSE injected eye showing enlarged, irregularly shaped RPE with variable ZO-1 immunostaining compared to E, which was imaged at the same magnification. n=4 eyes per group. Bar=25um.
Figure 9.
The UPR is induced and mitochondria are injured in the RPE/choroid 24 hours after mice were given an intravenous injection of CSE. A. Western blot of IRE1α after mice received intravenous injection of 125ug/ml CSE (in 50ul volume) or vehicle. B. Graph showing increased IRE1α protein in the RPE/choroid after intravenous injection of CSE compared to vehicle control. *p<0.05; n=3 eyes per condition. C. Graph showing decreased ATP production in the RPE/choroid of eyes from mice that received intravenous CSE compared to vehicle control. *p<0.05; n=3 eyes per condition.
Figure 10.
Intravenous CSE induces epithelial-mesenchymal transition. Mice were given intravenous injection of 125ug/ml CSE (in 50ul volume) or vehicle every other day for 3 doses. A. Western blot of TOM20 using b-Actin as a loading control after 10 days. B. Graph showing decreased TOM20 in the RPE/choroid 7 days after CSE treatment; n=4 eyes per condition. *p<0.05. C. Western blot of LRAT using b-Actin as a loading control. The 25kDa band represents the monomer and the 60kDa band represents the dimer. D. Graph showing decreased LRAT (monomer and dimer) in the RPE/choroid 7 days after CSE treatment; n=3 eyes per condition. *P<0.05. E. Representative confocal micrograph of an RPE flatmount of a vehicle control injected eye 10 days after CSE treatment. Note the regular cobblestone shape of the RPE and the regular ZO-1 immunostaining at the cell periphery. F. Representative RPE flatmount after intravenous CSE showing enlarged, irregularly shaped RPE with variable ZO-1 immunostaining compared to E, which was imaged at the same magnification. n=4 eyes per group. Bar=25um.
IRE1α is increased and TOM20 is decreased in early AMD
To connect the above findings with AMD, we examined markers of the UPR and mitochondrial function by immunohistochemistry on early AMD maculas (n=7) and unaffected donors (n=6). Strong immunolabeling of IRE1α, a canonical UPR sensor, was seen in macular RPE of unaffected age-matched donors (n=6; Fig. 11A, B). In early AMD maculas (n=8, Fig. 11C, D), the prominent immunolabeling pattern in the RPE overlying small drusen, a marker of aging, was equivalent in intensity and cellular distribution to adjacent, morphologically normal RPE overlying uninvolved Bruch’s membrane. In dystrophic RPE overlying large drusen, a marker of AMD, IRE1α immunolabeling was reduced compared to adjacent morphologically healthy RPE within the same sections of AMD samples (Fig. 11E, F). Table 3A summarizes the IRE1α labeling pattern in our cohort of eyes.
Figure 11.

IRE1α is decreased in the RPE overlying large drusen. A. Macular section from a 54 yo unaffected M. IRE1α immunolabeling is consistent and prominent in morphologically normal RPE overlying unthickened Bruch’s membrane. Bar=25um. Ch, choroid. B. IRE1α labeling is obvious in the same section after Nuance software has subtracted melanin pigment. C. Macular section from a 61 yo M with early AMD. IRE1α immunolabeling remains prominent in the RPE with thinned morphology that is overlying a small druse (*). D. IRE1α labeling in the RPE after Nuance subtraction of melanin from the section in C. E. Macular section from an 87 yo M with early AMD has a large druse (***). The thinned RPE overlying the druse and the adjacent RPE have decreased IRE1α labeling. F. Same section as E after Nuance subtraction of melanin. G. IgG control. Druse (**) H. IgG control after Nuance subtraction of melanin.
Table 3A.
IRE 1 alpha Immunolabeling of the RPE in early AMD
| Donor | Age (Yrs) | Gender | Race | D–E (Hr) | RPE Macula | Periphery | ||||
|---|---|---|---|---|---|---|---|---|---|---|
|
| ||||||||||
| BrM | Small Drusen | Large Drusen | BrM | Small Drusen | Large Drusen | |||||
| Unaffected | ||||||||||
| 1 | 65 | M | B | 22 | Yes | NP | NP | Yes | NP | NP |
| 2 | 62 | F | B | 40 | Yes | NP | NP | Yes | NP | NP |
| 3 | 52 | M | W | 23 | Yes | NP | NP | Yes | NP | NP |
| 4 | 42 | F | W | 14 | Yes | NP | NP | Yes | NP | NP |
| 5 | 54 | M | W | 13 | Yes | NP | NP | Yes | NP | NP |
| 6 | 83 | F | W | 13 | Yes | NP | NP | Yes | NP | NP |
| Early AMD | ||||||||||
| 1 | 60 | M | B | 28 | Yes | Yes | No | Yes | NP | NP |
| 2 | 96 | F | W | 19 | Yes | NP | No | Yes | NP | NP |
| 3 | 61 | M | W | 20 | Yes | Yes | No | Yes | NP | NP |
| 4 | 87 | F | W | 24 | Yes | Yes | No | Yes | NP | NP |
| 5 | 83 | F | W | 12 | Yes | NP | No | Yes | NP | NP |
| 6 | 94 | F | W | 8 | Yes | NP | No | Yes | NP | NP |
| 7 | 68 | F | W | 20 | Yes | Yes | No | Yes | NP | NP |
IRE1a immunolabeling in the RPE overlying unthickened Bruch’s membrane (BrM) or when overlying small or hard drusen. D–E, death to enucleation; F, female; M, male; B, Black; W, White; NP, not present.
Mitochondrial function was assessed using TOM20, a mitochondrial protein important for transporting cytosolic proteins to the mitochondria[40]. Strong TOM20 immunolabeling is seen in the basal RPE of unaffected maculas (Fig. 12A, B). In early AMD samples (Fig. 12C, D), in contrast to IRE1α, less intense TOM20 immunolabeling is seen in the mildly dysmorphic RPE overlying small drusen, a marker of aging, but not AMD, compared to adjacent, morphologically normal RPE that are attached to unthickened Bruch’s membrane. Even less TOM20 immunolabeling is appreciated in the RPE overlying large drusen, a hallmark indicator of AMD, again, compared to adjacent morphologically healthy RPE (Fig. 12E, F). Table 3B summarizes the TOM20 labeling pattern in our samples.
Figure 12.
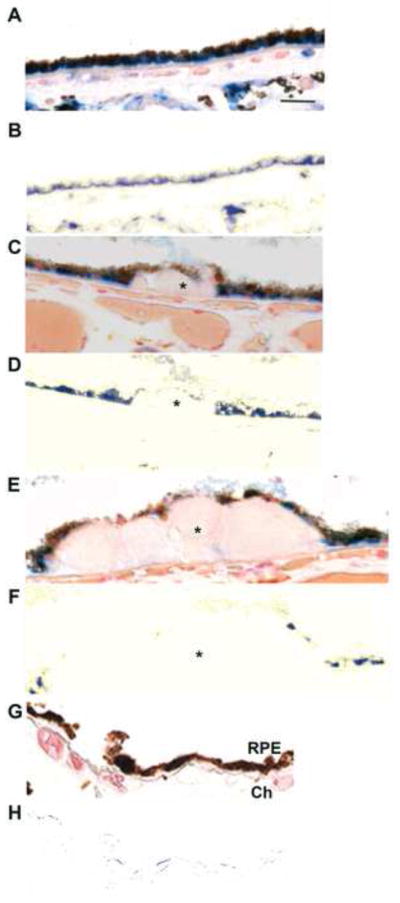
Decreased mitochondrial TOM20 immunolabeling in early AMD. A. Macular section from a 54 yo unaffected M. RPE morphology is preserved and TOM20 immunolabeling is basally located. Bar = 25um. B. Nuance subtraction of melanin. C. Macular section from a 68 yo F with early AMD. The RPE over a small druse (*) shows decreased TOM20 labeling compared to adjacent RPE. D. Nuance subtraction of melanin. E. Macular section from the same donor as C, D (68 yo F with early AMD). The RPE overlying a large druse (*) has minimal or absent TOM20 labeling. Residual TOM20 labeling is seen in RPE adjacent to druse. F. Nuance subtraction of melanin. G. IgG control. Ch, choroid. H. IgG control after Nuance subtraction of melanin.
Table 3B.
TOM 20Immunolabeling of the RPE in early AMD
| Donor | Age (Yrs) | Gender | Race | D–E (Hr) | RPE Macula | Periphery | ||||
|---|---|---|---|---|---|---|---|---|---|---|
|
| ||||||||||
| BrM | Small Drusen | Large Drusen | BrM | Small Drusen | Large Drusen | |||||
| Unaffected | ||||||||||
| 1 | 65 | M | B | 22 | Yes | NP | NP | Yes | NP | NP |
| 2 | 62 | F | B | 40 | Yes | NP | NP | Yes | NP | NP |
| 3 | 52 | M | W | 23 | Yes | NP | NP | Yes | NP | NP |
| 4 | 42 | F | W | 14 | Yes | NP | NP | Yes | NP | NP |
| 5 | 54 | M | W | 13 | Yes | NP | NP | Yes | NP | NP |
| 6 | 83 | F | W | 13 | yes | NP | NP | Yes | NP | NP |
| Early AMD | ||||||||||
| 1 | 60 | M | B | 28 | Yes | Yes* | No | Yes | NP | NP |
| 2 | 96 | F | W | 19 | Yes | NP | No | Yes | NP | NP |
| 3 | 61 | M | W | 20 | Yes | No | No | Yes | NP | NP |
| 4 | 87 | M | W | 24 | Yes | No | No | Yes | NP | NP |
| 5 | 83 | F | W | 12 | Yes | NP | No | Yes | NP | NP |
| 6 | 94 | F | W | 8 | Yes | NP | No | Yes | NP | NP |
| 7 | 68 | F | W | 20 | Yes | Yes* | No | Yes | NP | NP |
TOM20 immunolabeling in the RPE overlying unthickened Bruch’s membrane (BrM) or when overlying small or hard drusen. D–E, death to enucleation; F, female; M, male; B, Black; W, White; NP, not present. Yes* indicates decreased immunolabeling compared to adjacent RPE.
Discussion
How the cell responds to oxidative stress will determine its fate. Our microarray experiments gave us an unbiased and comprehensive assessment of this response to a complex oxidative stressor like CSE, and showed that RPE cells generate a robust, global transcriptional cytoprotective response that was enriched with genes related to the antioxidant response, the unfolded protein response, and mitochondrial location. The largest cytoprotective transcriptional response was the UPR, and complementary experiments indicate that this response, including CHOP signaling, indeed was protective. While GO analysis showed that antioxidant genes were over-represented after CSE, a close examination showed us that the antioxidant response was biased toward induction of cytoplasmic antioxidant genes, and was limited in its response of genes that manage superoxide and H2O2, both in the cytoplasm and the mitochondria, such that cells accumulated ROS and protein carbonylation. The mitochondria appear particularly susceptible to injury, as indicated by the increased superoxide and decreased ATP production. Despite a UPR, mitochondrial dysfunction led to retinal pigmented epithelial-mesenchymal transition, a change that is seen in AMD, a prototypical aging related disease. In fact, a similar response by the ER and mitochondria was seen in the RPE of early AMD specimens. Collectively, these results suggest that despite a robust UPR, mitochondrial impairment influenced cellular function with changes that have been observed in an aging-related disease.
Due to the robust UPR transcriptional response, we focused much of our study on the UPR. We found that all three of the canonical UPR sensors were activated by CSE and that the UPR along with proteasome activity was protective since cells remained viable. Even at a cytotoxic CSE dose, CHOP, which is commonly regarded to induce apoptosis[34, 35], was cytoprotective because CHOP knockdown reduced cell survival. These results contradict those of Tagawa et al, who found that a different formulation of CSE, through superoxide, induced CHOP and apoptosis in lung epithelial cells[41]. This difference might be due to cell-type specific differences in CHOP’s response, or by post-translational modifications to CHOP that can influence whether it is protective and apoptotic[42]. Alternatively, the action attributed to CHOP, a bZip factor, could instead be caused by other bZip factors which are known to be promiscuous, since we did not study other bZip factors such as ATF4 or c/EBP-b[37].
At the same time that the cell elicited a protective UPR, the mitochondria became impaired, as suggested by increased superoxide and reduced ATP production. A close examination of the antioxidant transcriptional response provides insights into why mitochondria might be vulnerable to CSE. While over-represented by GO analysis, the antioxidant response was imbalanced because the majority of differentially expressed genes were located in the cytoplasm compared to the mitochondria. Mitochondrial antioxidants are a pivotal, first line defense that protect mitochondria from excessive ROS because mitochondria continuously produce 90% of cellular ROS, an amount that can increase 10-fold when damaged[14, 15]. A decrease in the mitochondrial antioxidant system can render mitochondria susceptible to injury despite adequate cytosolic antioxidant levels. Much of the mitochondrial ROS produced is superoxide, which is dismutated by SOD2, which was not induced. Since catalase levels are low in the mitochondria[25], H2O2 is primarily neutralized Periredoxin-3 (Prx3) of the thioredoxin system and Glutathione Peroxidase-1 and -4 (GPx1, GPx4) of the glutathione system [26–30], none of which were induced by CSE. Other members of the thioredoxin system that are involved in donating electrons to Prx3 such as Thioredoxin-2 and Thioredoxin Reductase-2 were also not induced. The NADPH system is the ultimate reductant, and ME3, a central mitochondrial component involved in the NADPH system, was not induced. We did not measure the redox potential of the thioredoxin and glutathione systems. However, the transcriptional profile where elements involved in neutralizing superoxide, H2O2, and the regeneration of the thioredoxin, glutathione, and the NADPH systems were not induced raises the possibility of a transcriptionally initiated, inadequate antioxidant response that leaves the mitochondria vulnerable to oxidative stress. Future work will focus on understanding the mitochondrial relative to the cytoplasmic antioxidant response.
Under stress, mitochondria and the ER form mitochondria-associated ER membrane (MAM) communication networks that maintain cellular homeostasis or determine cell fate[43]. MAM networks interact during the onset of ER stress, where the mitochondria provide ATP to fuel the UPR[44]. Dou et al recently found that ER stress initiated mitochondria driven RPE cell apoptosis[45]. This group found that tunicamycin, a potent UPR inducer, activated caspase-4, which mediated RPE cell apoptosis. They also found that inhibiting either PERK or ATF6 decreased apoptosis and inhibited the effects of tunicamycin, indicating that the UPR is involved in ER stress-induced mitochondrial dysfunction in RPE cells. Our results seem to contradict this work since the UPR was not linked to cell death through CHOP or caspase-4. We believe that this difference is due to the greater degree of UPR induced by tunicamycin than that induced by CSE, such that apoptotic signals were communicated from the ER to the mitochondria. With the less severe ER stress, as in our experiments, the UPR remained protective without initiating cell death. Our experiments also found that mitochondria produced less ATP after CSE. With the protective UPR, these data point toward mitochondrial impairment as the origin of cellular dysfunction.
Our in vivo experiments confirmed that even with a UPR, CSE, whether by intravitreal or intravenous injection, induced mitochondrial dysfunction sufficient to induce epithelial-mesenchymal transition, as suggested by decreased LRAT, altered ZO1 immunolabeling, and altered cell morphology. These findings are similar to that found by Zhao et al, where mitochondrial dysfunction from genetic ablation of mitochondrial transcription factor A, Tfam, induced RPE epithelial to mesenchymal transition, which enabled the RPE to survive, but with compromised function that led to photoreceptor degeneration[39]. Feher et al found damaged and fewer mitochondria in the RPE of AMD than control eyes, and suggested that mitochondria contribute to RPE degeneration[46]. Our immunohistochemical evaluation of human AMD specimens agree with these findings of mitochondrial impairment, but also found that the UPR was simultaneously active. Collectively, these results point toward mitochondrial vulnerability when the ER elicits a cytoprotective UPR by RPE cells exposed to oxidative stress. With more severe morphologic AMD changes however, such as dysmorphic RPE overlying large drusen, a marker for AMD, our immunohistochemical analysis found decreased IRE1α labeling. Thus, with continued cellular stress, the UPR will eventually fail, contributing to further RPE degeneration.
Conclusions
Our results implicate the mitochondria as a source of cellular impairment by converting physiological ROS to pathological levels, and decreasing ATP production before the UPR fails. Because the mitochondria and ER interact through MAMs, our work suggests that the early mitochondrial impairment, instead of cooperating with the ER, might add to ER stress by increasing ROS and/or decreasing ATP. Given the evidence of decreased mitochondria and a UPR in the RPE with early disease that eventually declines with more severe AMD changes, further work clarifying the impact of the mitochondrial antioxidant system, and the interactive role between these ancient organelles in the RPE seems warranted, given that both the mitochondria and ER are susceptible to oxidative stress.
Supplementary Material
Supplemental Figure 1. CSE neither induced nor cleaved Caspase-4 in ARPE-19 cells. Representative western blot of Caspase-4 (50 kDa) after ARPE-19 cells were exposed to CSE (0–500ug/ml). GAPDH serves as loading control. n=3 independent experiments.
Highlights.
Cigarette smoke extract (CSE) induced antioxidant and UPR clusters in RPE cells.
CSE impaired mitochondria while activating a protective UPR including CHOP.
Despite a UPR, the RPE of mice given CSE had damaged mitochondria and developed EMT.
Mitochondria are vulnerable to CSE despite a protective UPR in age-related disease.
Acknowledgments
Funding: NIH EY019904 (JTH), Thome Foundation (JTH), EY14005 (JTH), Research to Prevent Blindness Senior Scientist Award (JTH), Unrestricted grant from Research to Prevent Blindness to the Wilmer Eye Institute, NIH P30EY001765 core grant, Robert Bond Welch Professorship, and a gift from the Merlau family.
List of Abbreviations
- AMD
age-related macular degeneration
- ATF4
activating transcription factor 4
- ATF6
activating transcription factor 6
- CHOP
CCAAT/enhancer-binding protein-homologous protein
- C/EPB-beta
CCAAT/enhancer binding protein (C/EBP), bet
- GCLM
glutamate-cysteine ligase, modifier subunit
- IRE1α
inositol requiring enzyme 1α
- LRAT
lecithin retinol acyltransferase (phosphatidylcholine--retinol O-acyltransferase)
- ME3
malic enzyme 3, NADP(+)-dependent, mitochondrial
- p-PERK
phosphorylated protein kinase RNA-activated-like ER kinase
- PSMB6
proteasome (prosome, macropain) subunit, beta type, 6
- SOD
superoxide dismutase
- RPE
retinal pigmented epithelium
- TOM20
translocase of outer mitochondrial membrane 20
- UPR
unfolded protein response
- ZO-1
zonula occludens-1
Footnotes
This work includes microarray analysis. The array data are available on the GEO database (record number: GSE49107).
Conflict of interest: None.
Publisher's Disclaimer: This is a PDF file of an unedited manuscript that has been accepted for publication. As a service to our customers we are providing this early version of the manuscript. The manuscript will undergo copyediting, typesetting, and review of the resulting proof before it is published in its final citable form. Please note that during the production process errors may be discovered which could affect the content, and all legal disclaimers that apply to the journal pertain.
References
- 1.Tomany SC, Wang JJ, Van Leeuwen R, Klein R, Mitchell P, Vingerling JR, Klein BE, Smith W, De Jong PT. Risk factors for incident age-related macular degeneration: pooled findings from 3 continents. Ophthalmology. 2004;111:1280–1287. doi: 10.1016/j.ophtha.2003.11.010. [DOI] [PubMed] [Google Scholar]
- 2.Vingerling JR, Hofman A, Grobbee DE, de Jong PT. Age-related macular degeneration and smoking. The Rotterdam Study. Arch Ophthalmol. 1996;114:1193–1196. doi: 10.1001/archopht.1996.01100140393005. [DOI] [PubMed] [Google Scholar]
- 3.Smith W, Assink J, Klein R, Mitchell P, Klaver CC, Klein BE, Hofman A, Jensen S, Wang JJ, de Jong PT. Risk factors for age-related macular degeneration: Pooled findings from three continents. Ophthalmology. 2001;108:697–704. doi: 10.1016/s0161-6420(00)00580-7. [DOI] [PubMed] [Google Scholar]
- 4.Mitchell P, Wang JJ, Smith W, Leeder SR. Smoking and the 5-year incidence of age-related maculopathy: the Blue Mountains Eye Study. Arch Ophthalmol. 2002;120:1357–1363. doi: 10.1001/archopht.120.10.1357. [DOI] [PubMed] [Google Scholar]
- 5.Canter JA, Olson LM, Spencer K, Schnetz-Boutaud N, Anderson B, Hauser MA, Schmidt S, Postel EA, Agarwal A, Pericak-Vance MA, Sternberg P, Jr, Haines JL. Mitochondrial DNA polymorphism A4917G is independently associated with age-related macular degeneration. PLoS ONE. 2008;3:e2091. doi: 10.1371/journal.pone.0002091. [DOI] [PMC free article] [PubMed] [Google Scholar]
- 6.Age-related Eye Disease Study Research Group. A randomized, placebo-controlled, clinical trial of high-dose supplementation with vitamins C and E, beta carotene, and zinc for age-related macular degeneration and vision loss: AREDS report no. 8. Arch Ophthalmol. 2001;119:1417–1436. doi: 10.1001/archopht.119.10.1417. [DOI] [PMC free article] [PubMed] [Google Scholar]
- 7.Alder VA, Cringle SJ. The effect of the retinal circulation on vitreal oxygen tension. Curr Eye Res. 1985;4:121–129. doi: 10.3109/02713688508999977. [DOI] [PubMed] [Google Scholar]
- 8.Rozanowska M, Jarvis-Evans J, Korytowski W, Boulton ME, Burke JM, Sarna T. Blue light-induced reactivity of retinal age pigment. In vitro generation of oxygen-reactive species. J Biol Chem. 1995;270:18825–18830. doi: 10.1074/jbc.270.32.18825. [DOI] [PubMed] [Google Scholar]
- 9.Dunaief JL, Dentchev T, Ying GS, Milam AH. The role of apoptosis in age-related macular degeneration. Arch Ophthalmol. 2002;120:1435–1442. doi: 10.1001/archopht.120.11.1435. [DOI] [PubMed] [Google Scholar]
- 10.Del Priore LV, Kuo YH, Tezel TH. Age-related changes in human RPE cell density and apoptosis proportion in situ. Invest Ophthalmol Vis Sci. 2002;43:3312–3318. [PubMed] [Google Scholar]
- 11.Schutt F, Bergmann M, Holz FG, Kopitz J. Proteins modified by malondialdehyde, 4-hydroxynonenal, or advanced glycation end products in lipofuscin of human retinal pigment epithelium. Invest Ophthalmol Vis Sci. 2003;44:3663–3668. doi: 10.1167/iovs.03-0172. [DOI] [PubMed] [Google Scholar]
- 12.Weismann D, Hartvigsen K, Lauer N, Bennett KL, Scholl HP, Charbel Issa P, Cano M, Brandstatter H, Tsimikas S, Skerka C, Superti-Furga G, Handa JT, Zipfel PF, Witztum JL, Binder CJ. Complement factor H binds malondialdehyde epitopes and protects from oxidative stress. Nature. 2011;478:76–81. doi: 10.1038/nature10449. [DOI] [PMC free article] [PubMed] [Google Scholar]
- 13.Zhou J, Cai B, Jang YP, Pachydaki S, Schmidt AM, Sparrow JR. Mechanisms for the induction of HNE- MDA- and AGE-adducts, RAGE and VEGF in retinal pigment epithelial cells. Exp Eye Res. 2005;80:567–580. doi: 10.1016/j.exer.2004.11.009. [DOI] [PubMed] [Google Scholar]
- 14.Chance B, Sies H, Boveris A. Hydroperoxide metabolism in mammalian organs. Physiological reviews. 1979;59:527–605. doi: 10.1152/physrev.1979.59.3.527. [DOI] [PubMed] [Google Scholar]
- 15.Grivennikova VG, Kareyeva AV, Vinogradov AD. What are the sources of hydrogen peroxide production by heart mitochondria? Biochim Biophys Acta. 2010;1797:939–944. doi: 10.1016/j.bbabio.2010.02.013. [DOI] [PMC free article] [PubMed] [Google Scholar]
- 16.Anbarasi K, Vani G, Devi CS. Protective effect of bacoside A on cigarette smoking-induced brain mitochondrial dysfunction in rats. J Environment Pathol Toxicol Oncol. 2005;24:225–234. doi: 10.1615/jenvpathtoxoncol.v24.i3.80. [DOI] [PubMed] [Google Scholar]
- 17.Smith PR, Cooper JM, Govan GG, Harding AE, Schapira AH. Smoking and mitochondrial function: a model for environmental toxins. Quarter J Med. 1993;86:657–660. doi: 10.1093/qjmed/86.10.657. [DOI] [PubMed] [Google Scholar]
- 18.van der Toorn M, Slebos DJ, de Bruin HG, Leuvenink HG, Bakker SJ, Gans RO, Koeter GH, van Oosterhout AJ, Kauffman HF. Cigarette smoke-induced blockade of the mitochondrial respiratory chain switches lung epithelial cell apoptosis into necrosis. Am J Physiol. 2007;292:L1211–1218. doi: 10.1152/ajplung.00291.2006. [DOI] [PubMed] [Google Scholar]
- 19.Jia L, Liu Z, Sun L, Miller SS, Ames BN, Cotman CW, Liu J. Acrolein, a toxicant in cigarette smoke, causes oxidative damage and mitochondrial dysfunction in RPE cells: protection by (R)-alpha-lipoic acid. Invest Ophthalmol Vis Sci. 2007;48:339–348. doi: 10.1167/iovs.06-0248. [DOI] [PMC free article] [PubMed] [Google Scholar]
- 20.Dunn KC, Aotaki-Keen AE, Putkey FR, Hjelmeland LM. ARPE-19, a human retinal pigment epithelial cell line with differentiated properties. Exp Eye Res. 1996;62:155–169. doi: 10.1006/exer.1996.0020. [DOI] [PubMed] [Google Scholar]
- 21.Wan J, Masuda T, Hackler L, Jr, Torres KM, Merbs SL, Zack DJ, Qian J. Dynamic usage of alternative splicing exons during mouse retina development. Nucleic Acids Res. 2011;39:7920–7930. doi: 10.1093/nar/gkr545. [DOI] [PMC free article] [PubMed] [Google Scholar]
- 22.Singh A, Misra V, Thimmulappa RK, Lee H, Ames S, Hoque MO, Herman JG, Baylin SB, Sidransky D, Gabrielson E, Brock MV, Biswal S. Dysfunctional KEAP1-NRF2 interaction in non-small-cell lung cancer. PLoS Med. 2006;3:e420. doi: 10.1371/journal.pmed.0030420. [DOI] [PMC free article] [PubMed] [Google Scholar]
- 23.Handa JT, Reiser KM, Matsunaga H, Hjelmeland LM. The advanced glycation endproduct pentosidine induces the expression of PDGF-B in human retinal pigment epithelial cells. Exp Eye Res. 1998;66:411–419. doi: 10.1006/exer.1997.0442. [DOI] [PubMed] [Google Scholar]
- 24.Sato H, Tamba M, Ishii T, Bannai S. Cloning and expression of a plasma membrane cystine/glutamate exchange transporter composed of two distinct proteins. J Biol Chem. 1999;274:11455–11458. doi: 10.1074/jbc.274.17.11455. [DOI] [PubMed] [Google Scholar]
- 25.Antunes F, Han D, Cadenas E. Relative contributions of heart mitochondria glutathione peroxidase and catalase to H(2)O(2) detoxification in in vivo conditions. Free Radic Biol Med. 2002;33:1260–1267. doi: 10.1016/s0891-5849(02)01016-x. [DOI] [PubMed] [Google Scholar]
- 26.Kowaltowski AJ, de Souza-Pinto NC, Castilho RF, Vercesi AE. Mitochondria and reactive oxygen species. Free Radic Biol Med. 2009;47:333–343. doi: 10.1016/j.freeradbiomed.2009.05.004. [DOI] [PubMed] [Google Scholar]
- 27.Murphy MP. How mitochondria produce reactive oxygen species. Biochem J. 2009;417:1–13. doi: 10.1042/BJ20081386. [DOI] [PMC free article] [PubMed] [Google Scholar]
- 28.Stowe DF, Camara AK. Mitochondrial reactive oxygen species production in excitable cells: modulators of mitochondrial and cell function. Antioxid Redox Signal. 2009;11:1373–1414. doi: 10.1089/ars.2008.2331. [DOI] [PMC free article] [PubMed] [Google Scholar]
- 29.Yin F, Sancheti H, Cadenas E. Mitochondrial thiols in the regulation of cell death pathways. Antioxid Redox Signal. 2012;17:1714–1727. doi: 10.1089/ars.2012.4639. [DOI] [PMC free article] [PubMed] [Google Scholar]
- 30.Imai H, Nakagawa Y. Biological significance of phospholipid hydroperoxide glutathione peroxidase (PHGPx, GPx4) in mammalian cells. Free Radic Biol Med. 2003;34:145–169. doi: 10.1016/s0891-5849(02)01197-8. [DOI] [PubMed] [Google Scholar]
- 31.Gornati R, Colombo G, Clerici M, Rossi F, Gagliano N, Riva C, Colombo R, Dalle-Donne I, Bernardini G, Milzani A. Protein carbonylation in human endothelial cells exposed to cigarette smoke extract. Toxicol Letters. 2013;218:118–128. doi: 10.1016/j.toxlet.2013.01.023. [DOI] [PubMed] [Google Scholar]
- 32.Davenport EL, Morgan GJ, Davies FE. Untangling the unfolded protein response. Cell Cycle. 2008;7:865–869. doi: 10.4161/cc.7.7.5615. [DOI] [PubMed] [Google Scholar]
- 33.Selimovic D, Ahmad M, El-Khattouti A, Hannig M, Haikel Y, Hassan M. Apoptosis-related protein-2 triggers melanoma cell death by a mechanism including both endoplasmic reticulum stress and mitochondrial dysregulation. Carcinogenesis. 2011;32:1268–1278. doi: 10.1093/carcin/bgr112. [DOI] [PubMed] [Google Scholar]
- 34.Zinszner H, Kuroda M, Wang X, Batchvarova N, Lightfoot RT, Remotti H, Stevens JL, Ron D. CHOP is implicated in programmed cell death in response to impaired function of the endoplasmic reticulum. Genes Develop. 1998;12:982–995. doi: 10.1101/gad.12.7.982. [DOI] [PMC free article] [PubMed] [Google Scholar]
- 35.Oyadomari S, Mori M. Roles of CHOP/GADD153 in endoplasmic reticulum stress. Cell Death Differ. 2004;11:381–389. doi: 10.1038/sj.cdd.4401373. [DOI] [PubMed] [Google Scholar]
- 36.Forus A, Florenes VA, Maelandsmo GM, Fodstad O, Myklebost O. The protooncogene CHOP/GADD153, involved in growth arrest and DNA damage response, is amplified in a subset of human sarcomas. Cancer Genet Cytogenet. 1994;78:165–171. doi: 10.1016/0165-4608(94)90085-x. [DOI] [PubMed] [Google Scholar]
- 37.Halterman MW, Gill M, DeJesus C, Ogihara M, Schor NF, Federoff HJ. The endoplasmic reticulum stress response factor CHOP-10 protects against hypoxia-induced neuronal death. J Biol Chem. 2010;285:21329–21340. doi: 10.1074/jbc.M109.095299. [DOI] [PMC free article] [PubMed] [Google Scholar]
- 38.Lee DH, Goldberg AL. Proteasome inhibitors: valuable new tools for cell biologists. Trends Cell Biol. 1998;8:397–403. doi: 10.1016/s0962-8924(98)01346-4. [DOI] [PubMed] [Google Scholar]
- 39.Zhao C, Yasumura D, Li X, Matthes M, Lloyd M, Nielsen G, Ahern K, Snyder M, Bok D, Dunaief JL, LaVail MM, Vollrath D. mTOR-mediated dedifferentiation of the retinal pigment epithelium initiates photoreceptor degeneration in mice. J Clin Invest. 2011;121:369–383. doi: 10.1172/JCI44303. [DOI] [PMC free article] [PubMed] [Google Scholar]
- 40.Ramage L, Junne T, Hahne K, Lithgow T, Schatz G. Functional cooperation of mitochondrial protein import receptors in yeast. EMBO J. 1993;12:4115–4123. doi: 10.1002/j.1460-2075.1993.tb06095.x. [DOI] [PMC free article] [PubMed] [Google Scholar]
- 41.Tagawa Y, Hiramatsu N, Kasai A, Hayakawa K, Okamura M, Yao J, Kitamura M. Induction of apoptosis by cigarette smoke via ROS-dependent endoplasmic reticulum stress and CCAAT/enhancer-binding protein-homologous protein (CHOP) Free Radic Biol Med. 2008;45:50–59. doi: 10.1016/j.freeradbiomed.2008.03.003. [DOI] [PubMed] [Google Scholar]
- 42.Wang XZ, Ron D. Stress-induced phosphorylation and activation of the transcription factor CHOP (GADD153) by p38 MAP Kinase. Science. 1996;272:1347–1349. doi: 10.1126/science.272.5266.1347. [DOI] [PubMed] [Google Scholar]
- 43.Simmen T, Lynes EM, Gesson K, Thomas G. Oxidative protein folding in the endoplasmic reticulum: tight links to the mitochondria-associated membrane (MAM) Biochim Biophys Acta. 2010;1798:1465–1473. doi: 10.1016/j.bbamem.2010.04.009. [DOI] [PMC free article] [PubMed] [Google Scholar]
- 44.Bravo R, Vicencio JM, Parra V, Troncoso R, Munoz JP, Bui M, Quiroga C, Rodriguez AE, Verdejo HE, Ferreira J, Iglewski M, Chiong M, Simmen T, Zorzano A, Hill JA, Rothermel BA, Szabadkai G, Lavandero S. Increased ER-mitochondrial coupling promotes mitochondrial respiration and bioenergetics during early phases of ER stress. J Cell Sci. 2011;124:2143–2152. doi: 10.1242/jcs.080762. [DOI] [PMC free article] [PubMed] [Google Scholar]
- 45.Dou G, Sreekumar PG, Spee C, He S, Ryan SJ, Kannan R, Hinton DR. Deficiency of alphaB crystallin augments ER stress-induced apoptosis by enhancing mitochondrial dysfunction. Free Radic Biol Med. 2012;53:1111–1122. doi: 10.1016/j.freeradbiomed.2012.06.042. [DOI] [PMC free article] [PubMed] [Google Scholar]
- 46.Feher J, Kovacs I, Artico M, Cavallotti C, Papale A, Balacco Gabrieli C. Mitochondrial alterations of retinal pigment epithelium in age-related macular degeneration. Neurobiol Aging. 2006;27:983–993. doi: 10.1016/j.neurobiolaging.2005.05.012. [DOI] [PubMed] [Google Scholar]
Associated Data
This section collects any data citations, data availability statements, or supplementary materials included in this article.
Supplementary Materials
Supplemental Figure 1. CSE neither induced nor cleaved Caspase-4 in ARPE-19 cells. Representative western blot of Caspase-4 (50 kDa) after ARPE-19 cells were exposed to CSE (0–500ug/ml). GAPDH serves as loading control. n=3 independent experiments.