

Abstract
Objectives
To examine regions of cortical thinning and cerebrospinal fluid (CSF) Alzheimer’s disease (AD) biomarkers associated with apathy and hallucinations in a continuum of individuals including clinically normal elderly, mild cognitive impairment and mild AD dementia.
Design
Cross-sectional and longitudinal studies.
Setting
57 research sites across North America.
Participants
812 community dwelling volunteers; 413 participants in the CSF sub-study.
Measurements
Structural magnetic resonance imaging data and CSF concentrations of amyloid-β 1-42, total tau and phosphorylated tau derived from the Alzheimer’s Disease Neuroimaging Initiative database were analyzed. Apathy and hallucinations were measured at baseline and over 3 years using the Neuropsychiatric Inventory-Questionnaire. General linear models and mixed effects models were used to evaluate the relationships among baseline cortical thickness in 7 regions, baseline CSF biomarkers and apathy and hallucinations at baseline and longitudinally. Covariates included diagnosis, gender, age, Apolipoprotein E genotype, premorbid intelligence, memory performance, processing speed, antidepressant use, and AD duration.
Results
Reduced baseline inferior temporal cortical thickness was predictive of increasing apathy over time, while reduced supramarginal cortical thickness was predictive of increasing hallucinations over time. There was no association with cortical thickness at baseline. CSF biomarkers were not related to severity of apathy or hallucinations in cross-sectional or longitudinal analyses.
Conclusions
These results suggest that greater baseline temporal and parietal atrophy is associated with worsening apathy and hallucinations in a large AD spectrum cohort, while adjusting for multiple disease-related variables. Localized cortical neurodegeneration may contribute to the pathophysiology of apathy and hallucinations and their adverse consequences in AD.
Keywords: Apathy, Hallucinations, MRI, cortical thinning, CSF biomarkers, Alzheimer’s disease
INTRODUCTION
Apathy and hallucinations are neuropsychiatric features of Alzheimer’s disease (AD) that herald functional and global decline.(1–3) Apathy occurs commonly in early symptomatic stages of AD, persists with disease progression and is the most prevalent neuropsychiatric symptom in individuals with AD dementia.(4) In contrast, hallucinations typically become evident in later stages of AD and identify a smaller subset of individuals with an accelerated course of illness and early mortality.(3, 5, 6) Despite the gravity of these neuropsychiatric symptoms in AD, their emergence and expression as part of the AD pathophysiological process are not well understood. In recent longitudinal analyses of the Alzheimer’s Disease Neuroimaging (ADNI) database, we found that apathy and hallucinations, but not other neuropsychiatric symptoms, were significant predictors of global functional impairment, while controlling for numerous confounders, in a continuum of older individuals with normal cognition, mild cognitive impairment (MCI) and AD dementia.(1) Building on these findings, this study concerns the relations of these prominent neuropsychiatric symptoms to AD biomarkers in the same ADNI cohort, and examines longitudinal data from individuals potentially in preclinical as well as clinical stages of AD.
A number of studies have defined a characteristic pattern of cortical thinning in AD that includes changes detectable in preclinical, MCI and dementia stages of AD.(7–9) Moreover, abnormal levels of CSF amyloid-β 1-42 peptide (Aβ1-42), tau phosphorylated at the threonine 181 (p-tau181p) and total tau (t-tau) have been associated with increased atrophy in these AD-related cortical regions in individuals classified as clinically normal and MCI, supporting their utility as markers of early AD pathology.(8, 10) The relationship of apathy and hallucinations to neuroimaging and cerebrospinal fluid (CSF) biomarkers of AD has not been investigated longitudinally, across the full spectrum of AD, from preclinical to amnestic MCI and to dementia.
In individuals with AD dementia, apathy has been associated cross-sectionally with reduced perfusion and metabolic activity in bilateral regions of the anterior cingulate cortex on single photon emission computed tomography (SPECT)(11–14) and 18F-fluorodeoxyglocuse positron emission tomography (FDG-PET) imaging(13), with decreased anterior cingulate cortical volume(15, 16) and thickness(17) using structural magnetic resonance imaging (MRI) and with altered microstructural white matter anisotropy in the left anterior cingulate.(18) Reductions in orbitofrontal metabolism and perfusion have also been demonstrated with apathy in multiple studies of AD dementia(11–13, 15) with less consistent findings of apathy-associated orbitofrontal cortical tissue loss.(17) No studies have examined the relations of apathy to neuroimaging biomarkers of AD in amnestic MCI or preclinical AD populations despite abundant evidence that apathy often presents in early phases of the AD spectrum.
Prior SPECT studies of comorbid delusions and hallucinations in AD have identified hypoperfusion in diverse regions of the prefrontal, temporal, parietal and cingulate cortices and, to a lesser extent, the striatum, as cross-sectionally related to the presence of these symptoms in AD dementia.(19–21) In a limited number of neuroimaging studies with more narrowly defined samples, visual hallucinations in AD dementia were cross-sectionally associated with hypoperfusion in the left dorsolateral prefrontal, left medial temporal and right parietal cortices with PET imaging(22) and with occipital atrophy on MRI.(23)
The objective of this study was to investigate the cross-sectional and longitudinal relations of MRI cortical thickness and CSF AD biomarkers with apathy and hallucinations in a large, well-defined cohort of clinically normal older (CN), MCI, and mild AD dementia subjects. The CN group was included in these analyses because it consists of some subjects at the preclinical stage of AD. We hypothesized that cortical thinning in regions previously implicated in apathy and hallucinations and abnormal CSF concentrations (low Aβ1-42 and elevated t-tau and p-tau181p) of amyloid and tau would predict the presence and worsening of these neuropsychiatric symptoms over time, while adjusting for many factors. Covariates included diagnosis, gender, age, Apolipoprotein E genotype, premorbid intelligence, memory performance, processing speed, antidepressant use, AD duration and (for longitudinal analyses) baseline dependent variable.
The identification of regional cortical atrophy and/or a CSF AD biomarker relationship may help elucidate the neural and pathophysiological mechanisms which mediate symptoms of apathy and hallucinations in AD.
MATERIALS AND METHODS
Subjects
Data used in the preparation of this article were derived from the ADNI database (www.loni.ucla.edu\ADNI, PI Michael W. Weiner) (see Supplemental Digital Content).(24)
The ADNI study sample, as previously described,(1) is comprised of 812 subjects (diagnoses at baseline:229 CN, 395 MCI, 188 AD dementia) who underwent serial cognitive, clinical, neuropsychiatric and neuroimaging assessments at baseline and at 6 or 12 month intervals over a follow up period of up to 3 years (mean 2.3 years, standard deviation 0.9). MRI data was available for 802 subjects. A subset of 413 subjects (114 CN, 198 MCI, 101 AD dementia) participated in an optional CSF sub-study. The demographic and clinical characteristics of the CSF sub-study group are comparable to the full ADNI cohort (http://www.adni-info.org/index).
At screening, ADNI subjects were ages 55–91 (inclusive), were medically stable and in general good health, did not have significant neurological conditions and had a designated study partner able to participate in assessments. Subjects did not have significant cerebrovascular risk factors (Modified Hachinski Ischemic Score(25) ≤ 4) and were not significantly depressed (Geriatric Depression Scale(26) short form ≤ 5). Psychiatric exclusion criteria included severe psychotic symptoms within the past 3 months, any history of schizophrenia, a history of alcohol or substance abuse within the past 2 years, or active psychiatric disorder (such as Major Depressive Disorder or Bipolar Disorder) within the past 1 year.
Subjects were assigned to diagnostic group by ADNI site investigators at screening and baseline visits using quantitative data, more qualitative global assessments and clinical determinations as previously reported (see Supplemental Digital Content). (1, 27)
The ADNI study was approved by the Institutional Review Board (IRB) of each participating site. Written informed consent was obtained from all subjects and study partners in accordance with local IRB guidelines.
Clinical assessments
Symptoms of apathy and hallucinations were assessed using the informant-based Neuropsychiatric Inventory brief questionnaire form (NPI-Q).(28) Twelve neuropsychiatric symptom items, including apathy and hallucinations, are rated for presence and severity over the past month. Each item is scored ordinally (0–3) with higher score indicating greater severity.
Other assessments relevant to this study include Apolipoprotein E ε4 (APOE4) genotype and the following cognitive tests: the American National Adult Reading Test (AMNART) intelligence quotient (IQ)(29) (an estimate of premorbid verbal IQ and a proxy measure for cognitive reserve, range 74–132; higher score indicates higher premorbid intelligence), the Rey Auditory Verbal Learning Test (RAVLT)(30) total learning score (a measure of episodic memory performance, range 0–75; lower score indicates greater impairment) and the Wechsler Adult Intelligence Scale-Revised (WAIS-R) Digit Symbol(31) (a measure of processing speed, visual scanning and working memory, range 0–110; lower score indicates greater impairment).
MRI data
For the current study, MRI scans were obtained at baseline according to standardized protocol (http://www.loni.ucla.edu/ADNI/Research/Cores/index.shtml). The magnetization-prepared rapid gradient echo sagittal T1-weighted 3D sequence was used. Cortical reconstruction and automated thickness measures (reported in mm) were performed using the Freesurfer (version 4.3.0) analysis suite/pipeline, which is documented and freely available for download online (http://surfer.nmr.mgh.harvard.edu/). There were 4 a priori defined regions of interest (ROI) studied relating to apathy: bilateral rostral anterior cingulate, inferior temporal, medial orbitofrontal and supramarginal (lateral parietal) cortices. 7 ROIs pertaining to hallucinations were the 4 above and bilateral lingual (occipital), rostral middle frontal (dorsolateral prefrontal) and superior parietal cortices.
CSF data
Baseline CSF samples were obtained, processed and stored according to the ADNI procedures manual (http://www.adni-info.org) and referenced previously.(32) CSF assays of Aβ1-42,, t-tau and p-tau181p were performed using the multiplex xMAP Luminex platform (Luminex Corp, Austin, TX) with Innogenetics (INNO-BIA AlzBio3; Ghent Belgium; for research use-only reagents) immunoassay kit-based reagents.(32, 33)
Statistical Analyses
SAS Version 9.3 was used in all analyses. Associations between demographics/characteristics and diagnostic groups were assessed using analysis of variance with post-hoc pairwise t-test comparisons with Bonferroni correction for continuous variables and the chi-square test for categorical variables.
Cross-sectional analysis
A general linear regression model with backward elimination (p<0.01 retention requirement) was used to evaluate the cross–sectional relations of the dependent variable, baseline NPI-Q apathy, with the following baseline predictors: 4 MRI regions and their interaction with diagnosis, CSF biomarkers and their interaction with diagnosis, diagnosis, sex, interaction of diagnosis and sex, age (linear and quadratic effects), APOE4 carrier status, AD dementia symptom duration (set to zero for CN and MCI subjects), use of antidepressant medications, AMNART IQ, RAVLT total learning and Digit Symbol scores. Significance test results (p values) were complemented with effect size estimates such as covariate adjusted means and estimates of percent variance accounted for in the dependent variable uniquely by individual predictors as well as by the model as a whole (R2). The inclusion of the interaction of MRI and CSF variables with diagnosis allowed us to test for any differential relation of any given MRI and/or CSF variable to apathy across diagnostic groups.
A parallel cross-sectional analysis of baseline NPI-Q hallucinations as dependent variable versus MRI and CSF biomarker predictors was not undertaken due to inadequate power related to the low prevalence of hallucinations at baseline in the study sample.
Longitudinal analyses
In longitudinal analyses across time in the study (in years), separately for the dependent variables of NPI-Q apathy and NPI-Q hallucinations, a mixed fixed and random-coefficient regression model was employed using a backward elimination procedure (with a p=0.05 cut-off) on a large initial pool of fixed predictors and variances/covariances of random terms. The fixed predictors were diagnostic group and their interactions with time, the CSF biomarkers and their interactions with time and with diagnosis, the baseline dependent variable and its interaction with time, and the same additional covariates as used in the cross-sectional analyses. Subsequently, these models were rerun including a set of baseline MRI regions as predictors (4 regions for apathy and 7for hallucinations) and their interactions with time. The random terms in all these models included correlated intercept and linear slopes of time. Partial regression coefficient estimates (β) with confidence intervals (CI) were reported. The squared correlations of predicted values from fixed and random predictor sets vs. actual values were used to indicate the percent of variance of the dependent variable linearly accounted for by the predictors as a set. Residuals from fixed and random components of models were checked for conformance to assumptions and model fit.
RESULTS
Table 1 shows demographic and clinical data for all subjects and across diagnostic groups as previously reported (see Supplemental Digital Content).(1)
Table 1.
Baseline demographic and clinical data.
| Group | All subjects | CN | MCI | AD dementia | F or χ2 | df | pa |
|---|---|---|---|---|---|---|---|
| n | 812 | 229 | 395 | 188 | |||
| Age (years) | 75.3±6.9b | 76.0±5.0 | 74.8±7.5 | 75.3±7.5 | 2 | 2,809 | 0.1 |
| Sex (% male) | 57.9b | 52.0 | 64.3 | 51.6 | χ2=13 | 2 | 0.002 |
| AMNART IQ | 117.2±11.6b | 121.1±10.6 | 116.6±11.5 | 114.0±11.7 | 22 | 2,805 | <0.0001 |
| AD dementia symptom duration (years) | 3.5±2.5 | ||||||
| APOE4 (% non-carrier/heterozygous carrier/homozygous carrier) | 51.1/38.1/10.6b | 72.9/24.5/2.2 | 46.6/41.8/11.4 | 34.0/46.8/19.1 | χ2=79 | 4 | <0.0001 |
| MMSE | 26.8±2.7b | 29.1±1.0 | 27.04±1.8 | 23.3±2.0 | 650 | 2,809 | <0.0001 |
| RAVLT Total Learning | 32.5±11.5b | 43.1±10.0 | 30.8±9.0 | 23.19±7.6 | 272 | 2,809 | <0.0001 |
| Digit Symbol | 36.9±13.4b | 45.8±10.2 | 36.8±11.3 | 26.5±13.2 | 144 | 2,808 | <0.0001 |
| Antidepressant use (%present) | 20.7b | 10.0 | 21.5 | 31.9 | χ2=30 | 2 | <0.0001 |
|
Apathy (% present) |
0.2±0.6c (15.0) |
0.01±0.1 (1.3) |
0.2±0.6 (13.9) |
0.5±0.8 (34.0) |
41 | 2,809 | <0.0001 |
|
Hallucinations (% present) |
0.02 ±0.1d (1.5) |
0.004±0.07 (0.4) |
0.003±0.05 (0.3) |
0.06±0.3 (5.3) |
13 | 2,809 | <0.0001 |
AD (Alzheimer’s disease), AMNART IQ (American National Adult Reading Test intelligence quotient), APOE4 (Apolipoprotein E ε4), CN (clinically normal older), df (degrees of freedom), F (F test statistic), MCI (mild cognitive impairment), MMSE (Mini-Mental State Examination), RAVLT (Rey Auditory Verbal Learning Test). All values (except n, sex, APOE4, and antidepressant use) represent mean ± standard deviation.
Significance tests used were the chi-square test for categorical variables and analysis of variance with Bonferroni correction for continuous variables.
Additional post-hoc pair-wise comparisons of diagnostic groups were performed (see Supplemental Digital Content).
Post-hoc t-tests: for CN vs. MCI (df=622), CN vs. AD (df=415)= and MCI vs. AD (df=581), p<0.0001 for all pairs.
Post-hoc t-tests for CN vs. AD (df=415) and MCI vs. AD (df=581)=, p<0.0001 for both pairs.
Table 1 displays significant group pairwise differences in the percent presence of apathy and mean NPI-Q apathy scores between all diagnostic groups at baseline, with lowest values in CN, intermediate values in MCI, and highest values in the AD dementia group. The percent presence of hallucinations and the mean NPI-Q hallucination score at baseline were significantly elevated in the AD dementia group as compared with the CN and MCI groups but there was no significant difference between the CN and MCI groups (see Supplemental Digital Content for all post-hoc pairwise tests).
Table 2 displays baseline MRI region and CSF biomarker values for all subjects and for each diagnostic group.
Table 2.
Cortical thickness by region and concentrations of CSF biomarkers at baseline.
| Group | All Subjects | CN | MCI | AD dementia | F | df | pa |
|---|---|---|---|---|---|---|---|
| MRI Variables (mm) | |||||||
| n | 802 | 227 | 389 | 186 | |||
| Medial orbitofrontal | 2.23±0.20 b | 2.30±0.17 | 2.22±0.19 | 2.14±0.21 | 38 | 2,799 | <0.0001 |
| Rostral middle frontal (dorsolateral prefrontal) | 2.12±0.17b | 2.20±0.15 | 2.11±0.16 | 2.04±0.18 | 51 | 2,799 | <0.0001 |
| Rostral anterior cingulate | 2.81±0.25 c | 2.86±0.22 | 2.79±0.24 | 2.78±0.30 | 7 | 2,799 | 0.0003 |
| Superior parietal | 1.91±0.19 b | 1.98±0.17 | 1.90±0.18 | 1.85±0.21 | 24 | 2,799 | <0.0001 |
| Lingual (occipital) | 1.75±0.11 b | 1.78±0.10 | 1.75±0.11 | 1.71±0.12 | 21 | 2,799 | <0.0001 |
| Supramarginal (lateral parietal) | 2.22±0.19 b | 2.31±0.17 | 2.22±0.18 | 2.13±0.19 | 55 | 2,799 | <0.0001 |
| Inferior temporal | 2.64±0.23 b | 2.76±0.17 | 2.64±0.21 | 2.48±0.24 | 97 | 2,799 | <0.0001 |
| CSF Variables (pg/ml) | |||||||
| n | 413 | 114 | 198 | 101 | |||
| Aβ 1-42 | 170.3 ±57 d | 205.6 ± 55 | 163.9 ± 55 | 142.8 ± 41 | 42 | 2,409 | <0.0001 |
| t-tau | 98.6 ± 57 d | 69.7 ± 30 | 103.7 ± 61 | 121.8 ± 58 | 27 | 2,404 | <0.001 |
| p-tau181p | 34.1 ± 19 d | 24.9 ± 15 | 35.6 ± 18 | 41.7 ± 20 | 26 | 2,410 | <0.0001 |
Aβ1-42 (amyloid-β 1-42 peptide), AD (Alzheimer’s disease), CN (clinically normal older), CSF (cerebrospinal fluid), df (degrees of freedom), F (F test statistic), MCI (mild cognitive impairment), MRI (magnetic resonance imaging), p-tau181p (tau phosphorylated at threonine 181), t-tau (total tau). MRI values represent bilateral averaged cortical thickness by region. All values (except n) represent mean ± standard deviation.
Associations among diagnostic groups were evaluated using analysis of variance with Bonferroni correction.
Post -hoc t-tests for CN vs. MCI, (df=614), CN vs. AD (df=411) and MCI vs. AD t(df=573), p<0.0001 for all pairs.
Post -hoc t-tests for CN vs. MCI (df=614) and CN vs. AD (df=411), p<0.003 for both pairs.
For post -hoc pairwise comparisons across groups, see Supplemental Digital Content.
Cross-sectional analysis
In the general linear regression model, after backward elimination, there were no MRI regions or CSF biomarkers that were significantly associated with NPI-Q apathy scores cross-sectionally. Diagnostic group was the only significant predictor of apathy cross-sectionally (F (2, 809)=41.3, p <0.0001, r2=0.09 for model; all pairwise group means were significantly different from each other, by post hoc t- tests; AD mean highest, CN lowest as shown in Table 1).
Longitudinal analyses
The preliminary mixed effects model for apathy, examining CSF biomarkers without MRI regions showed, after backward elimination, a significant association between lower baseline Aβ1-42 and greater rate of increase in apathy over time (F(1,716)=4.7, β=−0.0006, 95% CI: −0.00005, −0.001, p=0.03 for interaction of Aβ1-42 x time in study) There were other significant covariates of secondary interest in the model (see Supplemental Digital Content).
In the final mixed effects model for apathy incorporating both CSF biomarkers and MRI regions, none of the CSF biomarkers, including Aβ1-42, were significantly associated with apathy over time. After backward elimination, lower baseline inferior temporal cortical thickness was significantly associated with greater rate of increase in apathy over time; see Table 3 and Figure 1. Other predictors significantly associated with apathy over time were as follows: baseline apathy, use of antidepressant medication, AD dementia symptom duration, RAVLT Total Learning, and Digit Symbol; see Table 3.
Table 3.
Longitudinal mixed effects model of association of baseline bilateral averaged regional cortical thickness and apathy over time, displaying predictors retained in the final model.
| Model: Correlations of predicted values versus actual values of the dependent variable: Pearson r=0.44, r2=0.20, df=2823, p<0.0001 for fixed effects; r=0.77, r 2=0.59, df=2821, p<0.0001 including random terms. | ||||||
|---|---|---|---|---|---|---|
| Predictor | β | 95% CI for β | F | df | p | |
| Inferior temporal | 0.30 | 0.11, 0.49 | 9.4 | 1,1341 | 0.002 | |
| Time in study (years) | 0.64 | 0.35, 0.93 | 18.9 | 1,720 | <0.0001 | |
| Inferior temporal x time | −0.22 | −0.33, −0.11 | 15.4 | 1,1341 | <0.0001 | |
| Baseline Apathy | 0.35 | 0.29, 0.41 | 152.5 | 1,1341 | <0.0001 | |
| Antidepressant medication use | Yes | 0.08 | 0.004, 0.15 | 4.3 | 1,761 | 0.04 |
| No | 0 | |||||
| Baseline AD dementia symptom duration (years) | 0.04 | 0.02, 0.06 | 20.3 | 1,1341 | <0.0001 | |
| Baseline RAVLT Total Encoding | −0.006 | −0.009, −0.003 | 14.9 | 1,1341 | 0.0001 | |
| Baseline Digit Symbol | −0.005 | −0.008, −0.003 | 15.5 | 1,1341 | <0.0001 | |
AD (Alzheimer’s disease), β (partial regression coefficient estimate), CI (confidence interval), df (degrees of freedom), F (F test statistic), RAVLT (Rey Auditory Verbal Learning Test). x indicates an interaction.
Figure 1.
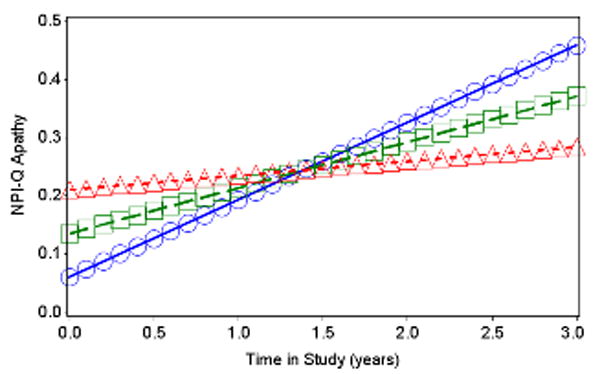
Predicted values from fixed effects of best fitting longitudinal model of NPI-Q Apathy by inferior temporal cortical thickness across time. Baseline AD dementia symptom duration, NPI-Q Apathy, RAVLT Total Encoding, and Digit Symbol were set to equal their grand means, and antidepressant medication use was set to “No”. Lines with squares represent the mean for inferior temporal cortical thickness, lines with triangles represent 1 standard deviation above the mean, and lines with circles represent 1 standard deviation below the mean. AD (Alzheimer’s disease), NPI-Q (Neuropsychiatric Inventory Questionnaire brief form), RAVLT (Rey Auditory Verbal Learning Test).
Analogous longitudinal mixed effects models examined the association with hallucinations as the dependent variable. In the final model, lower baseline supramarginal cortical thickness was significantly associated with greater rate of increase in hallucinations over time; see Table 4 and Figure 2. Other predictors significantly associated with hallucinations over time were as follows: baseline hallucinations, age, Digit Symbol, duration of AD dementia symptoms, and the interaction of diagnostic group with time such that the AD group had significantly faster increase over time in hallucinations than the other two groups which did not differ from each other; see Table 4. None of the CSF biomarkers were significantly associated with hallucinations over time in the preliminary model excluding MRI regions or in the final model including both CSF biomarkers and MRI regions. (For sub-group analyses see Supplemental Digital content.)
Table 4.
Longitudinal mixed effects model of association of baseline bilateral averaged regional cortical thickness and hallucinations over time, displaying predictors retained in the final model and reference terms (supramarginal gyrus and baseline diagnosis).
| Model: Correlations of predicted values versus actual values of the dependent variable: Pearson r=0.29, r2=0.09, df=2823, p<0.0001 for fixed effects; r=0.81, r 2=0.66, df=2821, p<0.0001 including random terms. | ||||||
|---|---|---|---|---|---|---|
| Predictor | β | 95% CI for β | F | df | p | |
| Supramarginal gyrus | 0.04 | −.03, 0.11 | 1.3 | 1,1340 | 0.25 | |
| Time in study (years) | 0.14 | 0.007, 0.28 | 6.5 | 1,719 | 0.01 | |
| Supramarginal gyrus x time | −0.06 | −0.12, −0.004 | 4.4 | 1,1340 | 0.04 | |
| Baseline Hallucinations | 0.32 | 0.24, 0.39 | 69.9 | 1,1340 | <0.0001 | |
| Baseline Diagnosis | AD | −0.06 | −0.1, −0.009 | 2.7 | 2,760 | 0.07 |
| MCI | −0.01 | −0.04, 0.02 | ||||
| CN | 0 | |||||
| Baseline Diagnosis x time | AD | 0.07 | 0.04, 0.10 | 9.8 | 2,719 | <0.0001 |
| MCI | 0.005 | −0.02, 0.03 | ||||
| CN | 0 | |||||
| Baseline AD dementia symptom duration (years) | 0.01 | 0.002, 0.02 | 6.3 | 1,1340 | 0.01 | |
| Baseline Digit Symbol | −0.002 | −0.003, −0.0007 | 12.3 | 1,1340 | 0.0005 | |
| Baseline Age | −0.003 | −0.004, −0.001 | 10.9 | 1,1340 | 0.001 | |
AD (Alzheimer’s disease), β (partial regression coefficient estimate), CI (confidence interval), CN (clinically normal older), df (degrees of freedom), F (F test statistic), MCI (mild cognitive impairment). x indicates an interaction.
Figure 2.
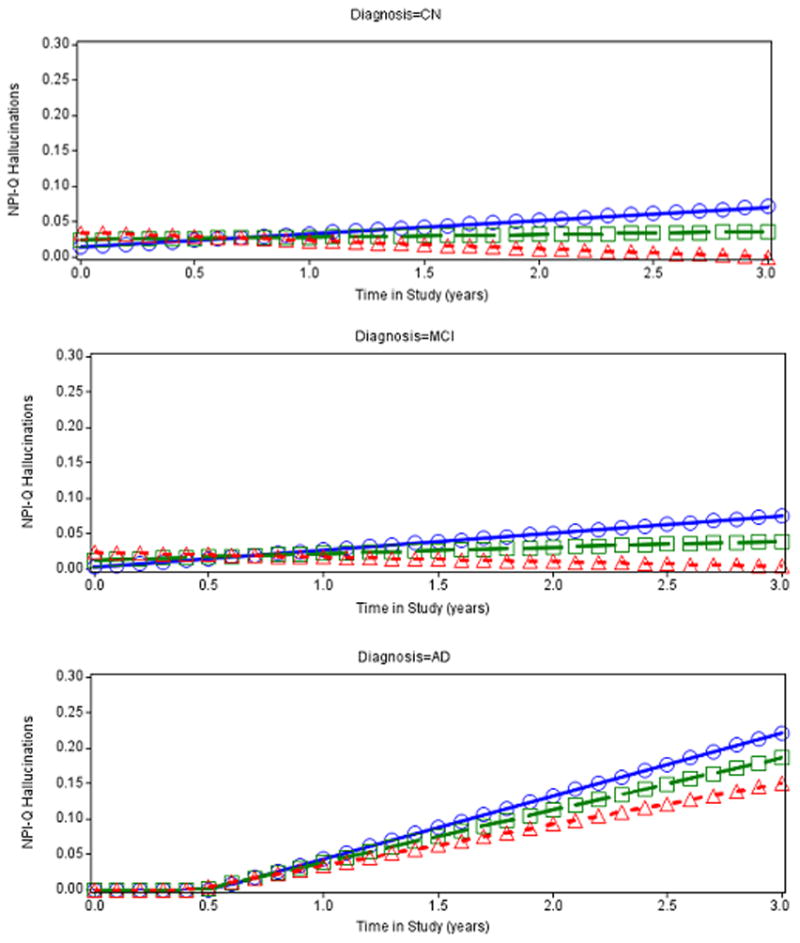
Predicted values from fixed effects of best fitting longitudinal model of NPI-Q Hallucinations by supramarginal cortical thickness by diagnostic groups: CN(Top), MCI (Middle), and AD dementia (Bottom). Age, AD dementia symptom duration, NPI-Q Hallucinations, and Digit Symbol at baseline were set to equal their grand means. Values below zero are not possible for the dependent variable NPI-Q Hallucinations. Regression values below zero that are predicted by the model are artifactual and were reset to zero thereby producing a bend in the curve in the bottom panel (for AD dementia diagnostic group). Lines with squares represent the mean for supramarginal cortical thickness, lines with triangles represent 1 standard deviation above the mean, and lines with circles represent 1 standard deviation below the mean. AD (Alzheimer’s disease), CN (clinically normal older), MCI (mild cognitive impairment), NPI-Q (Neuropsychiatric Inventory Questionnaire brief form).
DISCUSSION
Apathy and hallucinations are neuropsychiatric symptoms which display distinct clinical patterns of expression during the course of AD and carry important functional and prognostic significance. (1, 6, 34) In prior longitudinal analyses of the ADNI cohort, we demonstrated that apathy and hallucinations, but not other neuropsychiatric symptoms, significantly and independently predicted global functional impairment over time as measured by the Clinical Dementia Rating Scale sum of boxes score. The relations of these neuropsychiatric symptoms to alterations in brain structure and function and to AD pathophysiology, however, are poorly understood.
In this study we sought to identify regions of cortical atrophy that are associated with the presence and progression of neuropsychiatric symptoms of apathy and hallucinations in a large cohort of older individuals comprising the full spectrum of AD, including those in MCI and preclinical stages. We found that reduced baseline bilateral inferior temporal cortical thickness is associated with increasing apathy over time and reduced baseline bilateral supramarginal (lateral parietal) cortical thickness is associated with increasing hallucinations over time independent of numerous factors. There was no significant cross-sectional relationship between regions of cortical thickness and apathy.
This study demonstrated a relationship between longitudinal apathy and inferior temporal atrophy but no significant cross-sectional or longitudinal relationship between apathy and rostral anterior cingulate or medial orbitofrontal atrophy. This was an unexpected finding and contrasts with a number of prior studies in which apathy in AD dementia has been cross-sectionally associated with reduced cortical thickness and volume and decreased perfusion and metabolism in the anterior cingulate(11–17, 35) and orbitofrontal cortices.(11–13, 15, 17, 35) In general, prior studies differed from these analyses by focusing on smaller samples comprised solely of individuals at later stages of dementia and did not include those with MCI, they examined cross-sectional rather than longitudinal data, and they used measurements of apathy as dichotomous rather than continuous variables.
Tunnard et al. (17) found significantly greater cortical thinning in left caudal anterior cingulate and left lateral orbitofrontal, superior and ventrolateral frontal regions in a cross-sectional study of 111 AD dementia subjects, 63 (57%) with apathy. Exploratory analyses of several posterior cortical regions, not including the inferior temporal cortex, showed greater atrophy in subjects with apathy but none were significant when correcting for multiple comparisons. Taken together with other studies, they advocate a model of frontostriatal circuit dysfunction with impaired decision-making and behavioral response initiation as a basis for apathy in AD at the dementia stage. They also acknowledge less frequent findings implicating posterior cortical structures in apathy and, with others, suggest that additional mechanisms such as dysfunctional reward processing and impaired emotional awareness and salience may play a role in clinical symptoms of apathy.(36)
In contrast to the above findings, Kim et al. reported altered regional white matter integrity but no difference in voxel-based grey matter density in any cortical region in 51 very mild and mild AD dementia subjects with and without apathy matched for age, sex, education, dementia severity, APOE4 genotype, and vascular risk factors.(18) Subjects with clinically significant apathy had lower fractional anisotropy values in the left anterior cingulum than apathy-free subjects, independent of depression and use of psychotropic medication. They introduce a model of apathy in AD as a disconnection syndrome involving anterior cingulate, limbic and diffuse cortical regions, and suggest that axonal and myelin related pathology may precede and contribute to neurodegeneration in the anterior cingulate.
Our study adds to prior research examining apathy in AD dementia but also includes those with amnestic MCI in whom apathy frequently presents as an early clinical symptom. Cross-sectional and longitudinal analyses included significant covariates such as diagnosis, AD dementia symptom duration, APOE4 genotype, and baseline performance on cognitive tests thereby minimizing effects of background neurodegeneration associated with disease stage and cognitive decline. Indeed, cortical thinning in the inferior temporal cortex may identify a subset of individuals with onset of apathy in earlier stage disease consistent with ADNI analyses by McDonald et al. showing accelerated inferior lateral temporal atrophy beginning at early stage MCI (Clinical Dementia Rating (CDR) sum of boxes 0.5–1.0) and continuing into mild AD dementia.(37) Our results suggest that inferior temporal atrophy is associated with increasing apathy over time independent of disease stage and are consistent with epidemiological data documenting the persistence and increased prevalence of apathy, across MCI and AD dementia stages.
In a second longitudinal analysis, we found that baseline atrophy in the supramarginal gyrus (lateral parietal) predicted greater hallucinations over time. However, hallucinations were not associated with atrophy in other regions.
Prior PET, SPECT and structural MRI studies of hallucinations in AD dementia are difficult to interpret and compare due to methodological differences, small samples uncontrolled for many confounders, and the heterogeneity of psychotic symptoms within and across samples. Hallucinations in AD dementia have been cross-sectionally associated with hypoperfusion in multiple regions including the dorsolateral prefrontal(20, 22), anterior cingulate(20), inferior temporal,(19) medial temporal (22) and parietal cortices(20, 22, 38) and with striatal hyperperfusion(20) in SPECT and PET studies. Other findings associated with hallucinations in AD include hypometabolism in orbitofrontal, cingulate and superior parietal regions(39) using FDG-PET, and with lingual(39) and occipital atrophy on MRI.(23) Lin et al. hypothesized disruption of geniculocalcarine white matter fibers with preserved subcortical and overactive primary visual cortical function as a basis for visual hallucinations in AD while other models implicate widespread cortical-subcortical, “top-down” network dysfunction in AD-related psychosis.(40)
In our sample, hallucinations were rare in CN and MCI groups but present in 5% of individuals with dementia. This contrasts with two to three fold higher prevalence rates of hallucinations in AD dementia reported in population based studies.(4) This discrepancy may reflect psychiatric exclusion criteria and early stage dementia in the ADNI sample. Rates of supramarginal atrophy have been shown to accelerate markedly in mild AD dementia as compared to MCI and preclinical phases of AD.(37) This also coincides with the clinical stage of AD when hallucinations typically begin to manifest. We demonstrated that supramarginal atrophy was associated with worsening hallucinations independent of significant effects of age, diagnosis, AD dementia symptom duration, and processing speed. Additional studies in MCI and AD dementia subjects with well characterized hallucinations and accompanying neuropsychiatric symptoms are necessary to further define regional cortical changes in structure and function specifically associated with hallucinations. This may advance the understanding of hallucinations as a marker of poor prognosis and increased mortality in AD and inform therapeutic strategies for the treatment of AD-related hallucinations.
Finally, our analyses did not demonstrate a cross-sectional or longitudinal association between levels of CSF biomarkers (Aβ1-42,, t-tau and p-tau181p) and apathy or hallucinations when combining both CSF and MRI variables in a comprehensive model. A preliminary model examining CSF biomarkers but no MRI variables in relation to longitudinal apathy showed that lower baseline CSF Aβ1-42 was related to worsening apathy over time. This is consistent with lower CSF Aβ1-42 as a marker of greater AD pathology, also related to cortical atrophy and disease stage in AD.(10) In the final model inferior temporal cortical thickness but not CSF Aβ1-42 retained significance suggesting that CSF Aβ1-42 was a related but weaker predictor than the regional atrophy marker for apathy severity over time and that this clinical manifestation was primarily mediated by neurodegeneration and atrophy. Our findings contrast with those of Skogseth et al. who reported a cross-sectional association of apathy with CSF levels of t-tau and p-tau181p in a small study of AD dementia with mixed neuropsychiatric symptoms. The large ADNI study sample allowed us to examine these associations cross-sectionally and longitudinally in a broader spectrum of subjects and with greater power to covary for numerous disease-related confounders, which might explain these contradictory findings.(41)
There are a number of limitations to our study. Here, morphometric measures sampled a limited number of cortical regions and we did not address structural white matter changes which may play a role in the pathogenesis and pathophysiology of apathy and hallucinations in AD. Secondly, apathy, broadly defined, may derive from dysfunction in multiple distributed networks that are involved in AD pathophysiology at different stages of the disease process. The MCI group is over-represented in the ADNI study sample and AD dementia subjects are selected for mild rather than later stage severity. This likely skewed our findings towards those subjects with apathy in the context of earlier stage disease with AD pathology and possible apathy-related network dysfunction in posterior rather than anterior cortical regions. Additional studies that utilize a sensitive and specialized apathy instrument are planned to further elucidate symptoms of apathy in relation to brain structure and function in MCI and at the earliest symptomatic stages of AD. Lastly, hallucinations were rare in our sample at baseline as expected in mild AD dementia, MCI, and CN elderly individuals. It is possible that subjects who developed hallucinations over time in our study were developing dementia with Lewy bodies alone or in combination with AD rather than AD alone since hallucinations are prevalent early on in dementia with Lewy bodies. Moreover, hallucinations occur in later stage AD, often accompanied by delusions and other psychiatric symptoms, and the use of the NPI-Q in this study did not provide information regarding sensory modality of hallucinations which may be expected to have regional significance. Future studies with improved characterization of hallucinations, comorbid delusions and other neuropsychiatric symptoms in AD dementia subjects are necessary to examine more closely the structural and functional correlates of visual and auditory hallucinations in AD. This may facilitate an understanding of hallucinations as a marker of accelerated global decline and early mortality.
In conclusion, we found that regional atrophy in the inferior temporal and supramarginal cortices predicted worsening apathy and hallucinations, respectively, across a large cohort of older individuals classified as CN, MCI and AD dementia. These newly identified regions of atrophy, linked to apathy and hallucinations, focus attention on early as well as later stages of AD, and contribute to an understanding of the genesis and pathophysiology of these neuropsychiatric symptoms in AD.
Supplementary Material
Acknowledgments
The Alzheimer’s Disease Neuroimaging Initiative (ADNI) (NIH Grant U01 AG024904) is funded by the National Institute on Aging, the National Institute of Biomedical Imaging and Bioengineering, and through generous contributions from the following: Abbott, AstraZeneca AB, Bayer Schering Pharma AG, Bristol-Myers Squibb, Eisai Global Clinical Development, Elan Corporation, Genentech, GE Healthcare, GlaxoSmithKline, Innogenetics, Johnson and Johnson, Eli Lilly and Co., Medpace, Inc., Merck and Co., Inc., Novartis AG, Pfizer Inc, F. Hoffman-La Roche, Schering-Plough, Synarc, Inc., as well as non-profit partners the Alzheimer’s Association and Alzheimer’s Drug Discovery Foundation, with participation from the U.S. Food and Drug Administration. Private sector contributions to ADNI are facilitated by the Foundation for the National Institutes of Health (www.fnih.org). The grantee organization is the Northern California Institute for Research and Education, and the study is coordinated by the Alzheimer’s Disease Cooperative Study at the University of California, San Diego. ADNI data are disseminated by the Laboratory for Neuro Imaging at the University of California, Los Angeles.
This study was also supported by R01 AG027435, K23 AG033634, K24 AG035007, D01 HP08794-04-00, the Rosalinde and Arthur Gilbert Foundation/AFAR New Investigator Awards in Alzheimer’s disease, the Massachusetts Alzheimer’s Disease Research Center (P50 AG005134) and the Harvard Aging Brain Study (P01 AGO36694).
Footnotes
PREVIOUS PRESENTATION
This was presented as an abstract at the Alzheimer’s Association International Conference 2012: Donovan NJ, Wadsworth LP, Lorius N, Locascio JJ, Rentz DM, Johnson KA, Sperling RA, Marshall GA. Regional cortical thinning predicts worsening apathy and hallucinations in mild cognitive impairment and mild Alzheimer’s disease dementia. Alzheimer’s Association International Conference (AAIC) 2012, Vancouver, British Columbia, Canada July 14-19, 2012 (abstract)
CONFLICTS OF INTEREST AND SOURCES OF FUNDING
No disclosures to report.
Publisher's Disclaimer: This is a PDF file of an unedited manuscript that has been accepted for publication. As a service to our customers we are providing this early version of the manuscript. The manuscript will undergo copyediting, typesetting, and review of the resulting proof before it is published in its final citable form. Please note that during the production process errors may be discovered which could affect the content, and all legal disclaimers that apply to the journal pertain.
References
- 1.Wadsworth LP, Lorius N, Donovan NJ, et al. Neuropsychiatric symptoms and global functional impairment along the Alzheimer’s continuum. Dementia and Geriatric Cognitive Disorders. 2012;34:96–111. doi: 10.1159/000342119. [DOI] [PMC free article] [PubMed] [Google Scholar]
- 2.Boyle PA, Malloy PF, Salloway S, et al. Executive dysfunction and apathy predict functional impairment in Alzheimer disease. Am J Geriatr Psychiatry. 2003;11(2):214–21. [PubMed] [Google Scholar]
- 3.Scarmeas N, Brandt J, Albert M, et al. Delusions and hallucinations are associated with worse outcome in Alzheimer disease. Arch Neurol. 2005;62(10):1601–8. doi: 10.1001/archneur.62.10.1601. [DOI] [PMC free article] [PubMed] [Google Scholar]
- 4.Lyketsos CG, Lopez O, Jones B, et al. Prevalence of neuropsychiatric symptoms in dementia and mild cognitive impairment: results from the cardiovascular health study. Jama. 2002;288(12):1475–83. doi: 10.1001/jama.288.12.1475. [DOI] [PubMed] [Google Scholar]
- 5.Ropacki SA, Jeste DV. Epidemiology of and risk factors for psychosis of Alzheimer’s disease: a review of 55 studies published from 1990 to 2003. Am J Psychiatry. 2005;162(11):2022–30. doi: 10.1176/appi.ajp.162.11.2022. [DOI] [PubMed] [Google Scholar]
- 6.Wilson RS, Gilley DW, Bennett DA, et al. Hallucinations, delusions, and cognitive decline in Alzheimer’s disease. J Neurol Neurosurg Psychiatry. 2000;69(2):172–7. doi: 10.1136/jnnp.69.2.172. [DOI] [PMC free article] [PubMed] [Google Scholar]
- 7.Bakkour A, Morris JC, Dickerson BC. The cortical signature of prodromal AD: regional thinning predicts mild AD dementia. Neurology. 2009;72(12):1048–55. doi: 10.1212/01.wnl.0000340981.97664.2f. [DOI] [PMC free article] [PubMed] [Google Scholar]
- 8.Dickerson BC, Wolk DA. MRI cortical thickness biomarker predicts AD-like CSF and cognitive decline in normal adults. Neurology. 2012;78(2):84–90. doi: 10.1212/WNL.0b013e31823efc6c. [DOI] [PMC free article] [PubMed] [Google Scholar]
- 9.Putcha D, Brickhouse M, O’Keefe K, et al. Hippocampal hyperactivation associated with cortical thinning in Alzheimer’s disease signature regions in non-demented elderly adults. J Neurosci. 2011;31(48):17680–8. doi: 10.1523/JNEUROSCI.4740-11.2011. [DOI] [PMC free article] [PubMed] [Google Scholar]
- 10.Tosun D, Schuff N, Shaw LM, et al. Relationship between CSF biomarkers of Alzheimer’s disease and rates of regional cortical thinning in ADNI data. J Alzheimers Dis. 2011;26 (Suppl 3):77–90. doi: 10.3233/JAD-2011-0006. [DOI] [PMC free article] [PubMed] [Google Scholar]
- 11.Lanctot KL, Moosa S, Herrmann N, et al. A SPECT study of apathy in Alzheimer’s disease. Dement Geriatr Cogn Disord. 2007;24(1):65–72. doi: 10.1159/000103633. [DOI] [PubMed] [Google Scholar]
- 12.Robert PH, Darcourt G, Koulibaly MP, et al. Lack of initiative and interest in Alzheimer’s disease: a single photon emission computed tomography study. Eur J Neurol. 2006;13(7):729–35. doi: 10.1111/j.1468-1331.2006.01088.x. [DOI] [PubMed] [Google Scholar]
- 13.Benoit M, Clairet S, Koulibaly PM, et al. Brain perfusion correlates of the apathy inventory dimensions of Alzheimer’s disease. Int J Geriatr Psychiatry. 2004;19(9):864–9. doi: 10.1002/gps.1163. [DOI] [PubMed] [Google Scholar]
- 14.Migneco OBM, Koulibaly PM, Dygai I, et al. Perfusion brain SPECT and statistical parametric mapping analysis indicate that apathy is a cingulate syndrome: a study in Alzheimer’s disease and nondemented patients. Neuroimage. 2001;13(5):896–902. doi: 10.1006/nimg.2000.0741. [DOI] [PubMed] [Google Scholar]
- 15.Marshall GA, Monserratt L, Harwood D, et al. Positron emission tomography metabolic correlates of apathy in Alzheimer disease. Arch Neurol. 2007;64(7):1015–20. doi: 10.1001/archneur.64.7.1015. [DOI] [PubMed] [Google Scholar]
- 16.Apostolova LG, Akopyan GG, Partiali N, et al. Structural correlates of apathy in Alzheimer’s disease. Dement Geriatr Cogn Disord. 2007;24(2):91–7. doi: 10.1159/000103914. [DOI] [PubMed] [Google Scholar]
- 17.Tunnard C, Whitehead D, Hurt C, et al. Apathy and cortical atrophy in Alzheimer’s disease. Int J Geriatr Psychiatry. 2011;26(7):741–8. doi: 10.1002/gps.2603. [DOI] [PubMed] [Google Scholar]
- 18.Kim JW, Lee DY, Choo IH, et al. Microstructural alteration of the anterior cingulum is associated with apathy in Alzheimer disease. Am J Geriatr Psychiatry. 2011;19(7):644–53. doi: 10.1097/JGP.0b013e31820dcc73. [DOI] [PubMed] [Google Scholar]
- 19.Moran EK, Becker JA, Satlin A, et al. Psychosis of Alzheimer’s disease: Gender differences in regional perfusion. Neurobiol Aging. 2008;29(8):1218–25. doi: 10.1016/j.neurobiolaging.2007.02.024. [DOI] [PubMed] [Google Scholar]
- 20.Mega MS, Lee L, Dinov ID, et al. Cerebral correlates of psychotic symptoms in Alzheimer’s disease. J Neurol Neurosurg Psychiatry. 2000;69(2):167–71. doi: 10.1136/jnnp.69.2.167. [DOI] [PMC free article] [PubMed] [Google Scholar]
- 21.Kotrla KJ, Chacko RC, Harper RG, et al. Clinical variables associated with psychosis in Alzheimer’s disease. Am J Psychiatry. 1995;152(9):1377–9. doi: 10.1176/ajp.152.9.1377. [DOI] [PubMed] [Google Scholar]
- 22.Lopez OL, Smith G, Becker JT, et al. The psychotic phenomenon in probable Alzheimer’s disease: a positron emission tomography study. J Neuropsychiatry Clin Neurosci. 2001;13(1):50–5. doi: 10.1176/jnp.13.1.50. [DOI] [PubMed] [Google Scholar]
- 23.Holroyd S, Shepherd ML, Downs JH., 3rd Occipital atrophy is associated with visual hallucinations in Alzheimer’s disease. J Neuropsychiatry Clin Neurosci. 2000;12(1):25–8. doi: 10.1176/jnp.12.1.25. [DOI] [PubMed] [Google Scholar]
- 24.Weiner MW, Veitch DP, Aisen PS, et al. The Alzheimer’s Disease Neuroimaging Initiative: a review of papers published since its inception. Alzheimers Dement. 2012;8(1 Suppl):S1–68. doi: 10.1016/j.jalz.2011.09.172. [DOI] [PMC free article] [PubMed] [Google Scholar]
- 25.Rosen WG, Terry RD, Fuld PA, et al. Pathological verification of ischemic score in differentiation of dementias. Ann Neurol. 1980;7(5):486–8. doi: 10.1002/ana.410070516. [DOI] [PubMed] [Google Scholar]
- 26.Sheikh JI, Yesavage J. Geriatric depression scale (gds): Recent evidence and development of a shorter version. New York: The Haworth Press; 1986. [Google Scholar]
- 27.Marshall GA, Rentz DM, Frey MT, et al. Executive function and instrumental activities of daily living in mild cognitive impairment and Alzheimer’s disease. Alzheimers Dement. 2011;7(3):300–8. doi: 10.1016/j.jalz.2010.04.005. [DOI] [PMC free article] [PubMed] [Google Scholar]
- 28.Kaufer DI, Cummings JL, Ketchel P, et al. Validation of the NPI-Q, a brief clinical form of the Neuropsychiatric Inventory. J Neuropsychiatry Clin Neurosci. 2000;12(2):233–9. doi: 10.1176/jnp.12.2.233. [DOI] [PubMed] [Google Scholar]
- 29.Nelson HE, O’Connell A. Dementia: the estimation of premorbid intelligence levels using the New Adult Reading Test. Cortex. 1978;14(2):234–44. doi: 10.1016/s0010-9452(78)80049-5. [DOI] [PubMed] [Google Scholar]
- 30.Rey A. L’examen clinique en psychologie. Paris: Presses Universitaires de France; 1964. [Google Scholar]
- 31.Wechsler D. Wais r manual. New York: The Psychological Corporation; 1981. [Google Scholar]
- 32.Shaw LM, Vanderstichele H, Knapik-Czajka M, et al. Cerebrospinal fluid biomarker signature in Alzheimer’s disease neuroimaging initiative subjects. Ann Neurol. 2009;65(4):403–13. doi: 10.1002/ana.21610. [DOI] [PMC free article] [PubMed] [Google Scholar]
- 33.Olsson A, Vanderstichele H, Andreasen N, et al. Simultaneous measurement of beta-amyloid(1-42), total tau, and phosphorylated tau (Thr181) in cerebrospinal fluid by the xMAP technology. Clin Chem. 2005;51(2):336–45. doi: 10.1373/clinchem.2004.039347. [DOI] [PubMed] [Google Scholar]
- 34.Starkstein SE, Jorge R, Mizrahi R, et al. A prospective longitudinal study of apathy in Alzheimer’s disease. J Neurol Neurosurg Psychiatry. 2006;77(1):8–11. doi: 10.1136/jnnp.2005.069575. [DOI] [PMC free article] [PubMed] [Google Scholar]
- 35.Bruen PD, McGeown WJ, Shanks MF, et al. Neuroanatomical correlates of neuropsychiatric symptoms in Alzheimer’s disease. Brain. 2008;131(Pt 9):2455–63. doi: 10.1093/brain/awn151. [DOI] [PubMed] [Google Scholar]
- 36.Landes AM, Sperry SD, Strauss ME, et al. Apathy in Alzheimer’s disease. J Am Geriatr Soc. 2001;49(12):1700–7. doi: 10.1046/j.1532-5415.2001.49282.x. [DOI] [PubMed] [Google Scholar]
- 37.McDonald CR, McEvoy LK, Gharapetian L, et al. Regional rates of neocortical atrophy from normal aging to early Alzheimer disease. Neurology. 2009;73(6):457–65. doi: 10.1212/WNL.0b013e3181b16431. [DOI] [PMC free article] [PubMed] [Google Scholar]
- 38.Kotrla KJ, Chacko RC, Harper RG, et al. SPECT findings on psychosis in Alzheimer’s disease. Am J Psychiatry. 1995;152(10):1470–5. doi: 10.1176/ajp.152.10.1470. [DOI] [PubMed] [Google Scholar]
- 39.Blanc FNV, Philippi N, Cretin B, Armspach J-P, Rousseau F. Alzheimer’s and Dementia. 2011. Hallucinations in Alzheimer’s disease, correlations to brain volume and metabolism: A study of the ADNI cohort. [Google Scholar]
- 40.Lin SH, Yu CY, Pai MC. The occipital white matter lesions in Alzheimer’s disease patients with visual hallucinations. Clin Imaging. 2006;30(6):388–93. doi: 10.1016/j.clinimag.2006.09.025. [DOI] [PubMed] [Google Scholar]
- 41.Skogseth R, Mulugeta E, Jones E, et al. Neuropsychiatric correlates of cerebrospinal fluid biomarkers in Alzheimer’s disease. Dement Geriatr Cogn Disord. 2008;25(6):559–63. doi: 10.1159/000137671. [DOI] [PubMed] [Google Scholar]
Associated Data
This section collects any data citations, data availability statements, or supplementary materials included in this article.