

Abstract
The mammalian superior colliculus (SC) is made up of seven distinct layers. Based on overall differences in neuronal morphology, afferent and efferent projection patterns, physiological properties, and presumptive behavioral role, the upper three layers have been classically grouped together as the superficial layers and the remaining four layers collectively make up the deep layers. Although the superficial layers receive their primary inputs from the retina and primary visual cortex, the deep layers receive inputs from extrastriate visual cortical areas and from auditory, somatosensory, and motor-related structures. In contrast, there is no evidence of monosynaptic nonvisual inputs to the superficial layers. However, more recent studies have revealed anatomical connections between the superficial and deep layers, thus providing the substrate for possible communication between these two functional divisions of the SC. In this study, we provide physiological evidence for auditory influences on visual responses in the superficial layers of the SC. Using extracellular recordings of local field potentials (LFPs) and multiunit activity, we demonstrate multisensory effects in the superficial layers of the cat SC such that subthreshold auditory activity (as seen in the LFP) modulates visual responses (reflected in spiking activity) when the two stimuli are presented together. These results have important implications for our understanding of the functional organization of the SC and for the neural basis of multisensory integration in general.
Keywords: Local field potential, multisensory, spikes, superficial layers, superior colliculus
Introduction
The mammalian superior colliculus (SC) has been shown to play an integral role in moving the eyes, ears, and head toward a stimulus of interest (Huerta, 1984; Munoz and Guitton, 1985, 1989). Traditionally, the SC has been divided into two structural and functional distinctions, superficial layers and intermediate/deep layers. This classic distinction is based on observations that the superficial layers are exclusively visual, whereas the intermediate and deep layers show visual, auditory, and somatosensory responses and premotor activity (Casagrande et al., 1972; Ogasawara et al., 1984; Grantyn and Berthoz, 1985; Meredith and Stein, 1986a; Stein, 1993; May, 2006). This functional dichotomy is also reflected in the respective input/output architecture of these two laminar compartments, which differ dramatically from one another (Edwards et al., 1979; Kudo and Niimi, 1980; Tortelly et al., 1980; Kudo, 1981; Clemo and Stein, 1982; Mucke et al., 1982; Segal and Beckstead, 1984; Huerta, 1984). The anatomical structure and input/output architecture of the mammalian SC is remarkably well conserved across species (Vanegas, 1984), likely reflecting the common organizational framework needed to transform sensory signals into appropriate orientation commands.
Recent anatomical evidence has revealed reciprocal connections between the superficial and intermediate/deep layers of the SC, suggesting the presence of previously unrealized functional interactions across these layers (Behan et al., 1987; Behan and Appell, 1992; Behan and Kime, 1996; Hall and Lee, 1997; Doubell et al., 2003). Most notably, neurons in the deeper SC layers have been shown to have axons and apical dendrites that extend up into the superficial layers, thus providing a possible structural substrate for functional interactions between these compartments. This anatomical finding raises questions about the strict functional distinctions that have been drawn across the SC layers, including the absence of multisensory influences in the superficial layers. This question is particularly pressing because the vast majority of neurophysiological studies conducted within the superficial SC layers have used only visual stimuli.
In the present study, we examine the impact of auditory stimuli on visual responses in the superficial layers of the cat SC. In addition to assessing whether (and how) auditory stimuli affect visually evoked spiking responses, the analyses also tested for multisensory interactions in the local field potential (LFP), which has been shown to be sensitive to subthreshold, weak, and modulatory synaptic processes. Our results show for the first time that auditory stimulation significantly alters the nature of visual information processing in the superficial layers of the mammalian SC.
Materials and Methods
General procedures.
Experiments were conducted in adult male cats (n = 2; n1 = 21 sessions, n2 = 34 sessions) raised under standard housing conditions. All experiments were done in an anesthetized and paralyzed semichronic preparation (see below in Materials and Methods: Implantation and recording procedures) and consisted of multiunit and LFP extracellular recordings from the midbrain SC. Experiments were run on a weekly basis on each of the animals. All surgical and recording procedures were performed in compliance with the Guide for the Care and Use of Laboratory Animals at Vanderbilt University Medical Center, which is accredited by the American Association for Accreditation of Laboratory Animal Care.
Implantation and recording procedures.
For anesthesia during surgical procedures, animals were initially induced with ketamine hydrochloride (20 mg/kg, i.m.) and acepromazine maleate (0.04 mg/kg, i.m.). For implantation of the recording chamber over the SC, animals were transported to a central surgical suite, where they were intubated and artificially respired. A stable plane of surgical anesthesia was achieved using inhalation of isoflurane (1–3%). Body temperature, expiratory CO2, blood pressure, and heart rate were continuously monitored (VSM7; Vetspecs/SCIL), recorded, and maintained within ranges consistent with a deep and stable plane of anesthesia. A craniotomy was made to allow access to SC and a head holder was attached to the skull using stainless steel screws and orthopedic cement to hold the animal during recording sessions without obstructing the face and ears. Postoperative care (antibiotics and analgesics) was done in close consultation with veterinary staff.
For neurophysiological recordings, animals were anesthetized with ketamine (20 mg/kg, i.m.) and acepromazine maleate (0.04 mg/kg, i.m.) and maintained throughout the procedure with a constant rate infusion of ketamine (5 mg/kg/h, i.v.) delivered through a cannula placed in the saphenous vein. The head-holding system was used to keep the animal comfortably in a recumbent position. To prevent ocular drift, animals were paralyzed using pancuronium bromide or vecuronium bromide (0.1 mg/kg/h, i.v.) and artificially respired for the duration of recording. On completion of experiments, animals were subcutaneously given 60–100 ml of lactated Ringer's solution to facilitate recovery. Parylene-insulated tungsten electrodes (initial impedance at 1 kHz = 4–5 MΩ) were advanced into the SC using an electronically controlled mechanical microdrive. Multiunit neural activity (MUA), defined as voltage peaks crossing a preset threshold (2 SDs from the mean), and LFPs (1–300 Hz) were recorded, amplified, and routed to an oscilloscope, audio monitor, and computer for performing online and offline analysis (see below for details in Materials and Methods: Stimulus presentation, receptive field mapping, and search strategy.).
Stimulus presentation, receptive field mapping, and search strategy.
The superficial layers of the SC were identified by their characteristic burst-like firing (Wurtz and Albano, 1980; Grantyn et al., 1983; Lo et al., 1998). The visual receptive fields (RFs) of the MUA were mapped via a Keeler pantoscope using rectangular bars and moving spots of light (1–6° in diameter) until reliable boundaries of the minimal response field could be discerned. RF mappings and associated recordings were performed at three different depths during each electrode penetration.
First, the top of SC (just beneath the pial surface) was identified by the initial appearance of the characteristic robust responses elicited by moving visual stimuli. Once identified, the RF(s) at this location was mapped. After this determination of RF borders, stimuli were presented from an array of locations both within and outside of the RF in a randomly interleaved fashion while both MUA and LFP responses were recorded. Once data were recorded from this most superficial location, the electrode was advanced by 200–600 μm, the RF was mapped again, and a stimulus battery was presented as above in the Materials and Methods section. This procedure was repeated at a depth an additional 700–1000 μm below the location of the second recording.
Visual stimuli consisted of the illumination of stationary light-emitting diodes (LEDs: 100 ms duration, luminance = 104 cd/m2). Auditory stimuli were delivered through speakers (impedance = 8Ω; DigiKey) and consisted of 100-ms-duration broadband (20 Hz-20 KHz) noise bursts with an intensity of 67 dB SPL on a background of 45 dB SPL measured at the head of the animal with a sound level meter (SoundTrack LxT; Larson Davis). Both the LED and the speakers were mounted on a hoop placed 60 cm in front of the animal at azimuthal locations ranging from 0° to 90° on either side of the midline in 10° increments. The hoop was rotated along different elevations that allowed sampling of locations from 90° above to 40° below the interaural plane, again in 10° increments. The physical characteristics of the stimuli were identical in all respects except for the spatial location at which they were presented. Multisensory combinations consisted of visual and auditory stimuli presented at the same spatial location. The order in which stimulus locations were tested was pseudorandomized along a single elevation. A minimum of 60 trials (i.e., 20 visual, 20 auditory, 20 multisensory) was collected for any given stimulus location. In most cases, 40 trials per condition were obtained. Consecutive stimulus presentations were separated by at least 1.5 s and randomly jittered to avoid neural response habituation.
Two different conditions of stimulus timing (stimulus onset asynchrony or SOA) were used throughout the study-simultaneous visual and auditory stimulation (V0A0) and with the visual stimulus preceding the auditory stimulus by 50 ms (V0A50). These intervals were chosen based on prior data suggesting that these SOAs optimize the opportunity for multisensory interactions (Meredith et al., 1987; Stein, 1993; Ghose et al., 2012).
Data acquisition and analysis.
A custom-built, PC-based real-time data acquisition system controlled the structure of the trials and the timing of the stimulus using custom scripts written in Labview (National Instruments). The analog waveform of the extracellular voltage fluctuations picked up by the electrode were transferred to an MAP system (Plexon) where they were high-pass filtered and digitized at 40 kHz (for spikes) and low-pass filtered and digitized at 1 kHz (for LFPs). MUA responses were thresholded and sorted online using the Sort Client software (Plexon). Spike time stamps were recorded and stored digitally for offline analysis. Using custom MATLAB scripts (The MathWorks), neuronal responses were characterized through construction of peristimulus time histograms (PSTHs) and rasters for each condition [visual only (V), auditory only (A), or visual-auditory together (AV)] and for each location tested within the spatial RF. Baseline activity for each PSTH was calculated as mean firing rate during the 500 ms period immediately preceding stimulus onset. Stimulus-evoked response onset was defined as the first spike within the bin at which the PSTH crossed above a virtual threshold of two SDs above baseline and remained above this value for at least 30 ms. Response offset was defined as the latest time at which the PSTH remained below the two SD threshold for ≥30 ms. Mean spontaneous firing rate was subtracted from responses to obtain the mean stimulus evoked response for all the three conditions. Data were collected for a total of 55 recording sessions. Latency was calculated as the difference between time of stimulus onset and response onset.
Measures for quantifying multisensory integration.
Two separate statistical measures were used to assess multisensory integration. The first measure, called the interactive index (ii), measures how the multisensory response differs from the largest evoked unisensory response. The magnitude of this change was calculated as follows:
 |
where CM is the mean response evoked by the combined modality stimulus, and SMmax is the mean response evoked by the most effective single modality stimulus (Meredith and Stein, 1983, 1986a, 1986b). Statistical comparisons between these conditions were done using a nonparametric Wilcoxon rank test. Response enhancement was defined as statistically significant positive ii values, whereas response depression was defined as statistically significant negative ii values. All cases where ii values were statistically nonsignificant were deemed as showing no interaction.
The second measure is termed mean statistical contrast (msc). This metric evaluates whether the multisensory response exceeds the response predicted by summation of the two component unisensory responses. Multisensory contrast is calculated using the following formula:
 |
where Ai is the evoked auditory response on a given trial (i), Vi is the evoked visual response on a given trial, AVi is the evoked multisensory response on a given trial, and n is the number of trials. The msc model assumes independence between the visual and auditory inputs and uses additive factors logic to distinguish between subadditive (contrast <0), additive (contrast = 0) and superadditive (contrast >0) modes of integration (Perrault et al., 2003, 2005; Stanford et al., 2005; Stanford and Stein, 2007). Significant differences from a contrast value of 0 were determined by the Wilcoxon rank test.
Evoked LFP analyses.
LFPs were sampled at 1000 Hz and converted to voltage as a function of time. To quantify the peak LFP amplitude, for both of the recorded SOAs (V0A0 and V0A50), the evoked LFP response for all stimulus locations showing response enhancements in the spiking data (see above in the Materials and Methods section: Measures for quantifying multisensory integration) were averaged to produce a grand average event-related potential. This procedure was repeated for all stimulus locations showing response depression and for those showing no interaction. To quantify the changes in LFP amplitude in response to the stimuli, we compared LFP amplitude before and after stimulus onset using Student's t test (with Bonferroni's correction for multiple comparisons) for each condition. More specifically, the mean voltage within a 150 ms prestimulus window was taken as the baseline. Peak voltage changes within a window 300 ms after stimulus presentation were then compared against this baseline to assess stimulus related changes in the LFP. Next, mean peak voltages within the response window were compared between visual and multisensory conditions using a t test to determine whether the visually evoked LFP amplitude differed significantly from the multisensory LFP amplitude.
In addition to these peak-based analyses, the area under the curve (AUC) for the averaged evoked LFPs over the interval spanning 0–200 ms after stimulus were computed for the three stimulus conditions (V, A, AV) for each of the different types of interactions (response enhancement, response depression, and no interaction) and for both SOAs (V0A0 and V0A50). Next, for each of the different types of interactions, the AUC for the visual condition was statistically compared with that of the multisensory condition using t tests. The choice of the 200 ms poststimulus analysis window was based on visual inspection of the data to capture the majority of the stimulus-evoked changes.
Time frequency analysis of LFPs.
To test for stimulus-induced LFP power changes in different frequency bands, spectrograms were computed using a fast Fourier transform with a running (Hamming) window size of 256 ms and an overlap of 255 ms. Each spectrogram was normalized to a prestimulus baseline by subtracting the average baseline power for each frequency band from the entire spectrogram and dividing the result by the same baseline power (thus yielding fractional change). Note that a 60 Hz notch filter was used during recordings to eliminate AC noise. Therefore, we have no data for this frequency band. Spectrograms were computed separately for stimulus locations within the RF that evoked response enhancement, response depression, or no significant interaction as defined by the local spiking response (see above in the Materials and Methods section: Measures for quantifying multisensory integration.). Contrast plots were then computed by subtracting the respective spectrogram pairs to determine the effects of multisensory stimulation on LFP responses. More specifically, contrast was defined as the LFP power difference between the multisensory condition and the unisensory visual condition (AV > V) or multisensory condition and the sum of the unisensory conditions [AV > (V+A)]. Results for both comparisons were converted to t scores for statistical comparison using the following formula:
 |
where SD is the SD of responses across both conditions, and n1 and n2 are the number of trials for condition 1 and condition 2, respectively. False discovery rate (FDR) at a level of 0.01 was used to correct for multiple comparisons. Similar results were achieved when Bonferroni's correction was applied.
A two-way ANOVA with factors of response category (e.g., enhancement vs no interaction) and SOA (0 vs 50 ms) was computed comparing significant changes in activation (using FDR as a correction to control false positives) for the regions of high gamma activity (70–90 Hz) within 350 ms of stimulus onset in the contrast (AV > V) spectrograms. Follow-up t tests were calculated to compare levels within individual factors (e.g., enhancement vs no interaction within a single SOA).
Results
RF size and response latency differ between the superficial and deeper layers of the SC
In an effort to restrict our analyses to neurons in the superficial layers of SC, we used several electrophysiological criteria that have been shown previously to differentiate between the superficial and deeper layers (Sterling and Wickelgren, 1969; Sterling, 1971; Wurtz and Albano, 1980; Meredith and Stein, 1990). The two most informative of these measures are visual RF size and response latency. Single unit activity and MUA, along with LFPs, were recorded from three different depths in each of 55 different electrode penetrations.
Consistent with prior work, a systematic increase in visual RF size was observed as the electrode advanced deeper into the SC (Fig. 1). Whereas depth 1 was always at the first appearance of the characteristic visual responses of the SC (i.e., top of SC), depth 2 was 200–600 μm below this location and depth 3 was 1000–1400 μm from the beginning of the evoked visual responses. The relationship between visual RF size and recording depth is quantified in Figure 2A, which reveals the systematic increase in visual RF size as the electrode transitions from superficial to deeper layers. A one-way repeated-measures ANOVA confirmed that visual RF size (i.e., mean diameter) was significantly different for the different recording depths (F(2,134) = 793.3, p = 2.7 × 10−74). Follow-up t tests indicated that the visual RFs of neurons at each depth differed significantly (mean [±SD] diameter at depth 1 = 11.7 ± 3.9°; depth 2 = 40.3 ± 7.9°; and depth 3 = 79.0 ± 10.7°; n = 55; Student's t tests: depth 1 vs depth 2: t = −21.6, p < 0.01 depth 1 vs depth 3: t = −39.5, p < 0.01; depth 2 vs depth 3: t = −19.4, p < 0.01).
Figure 1.

Changes in visual RF size with increasing recording depth within the SC. Visual RF size increases with increasing depth within the SC. Electrode position at different recording depths in SC is represented on a schematic cross-section (left). Depth 1 represents recordings at the top of SC. Mappings and recordings at depth 2 varied between 200 and 600 μm from top of SC (mean depth across 55 sessions = 353 μm). Mappings and recordings at depth 3 varied between 1000 and 1400 μm from the top of SC (mean depth across 55 sessions = 1247 μm). Blue shaded regions (right) illustrate representative RF sizes at each of these depths.
Figure 2.
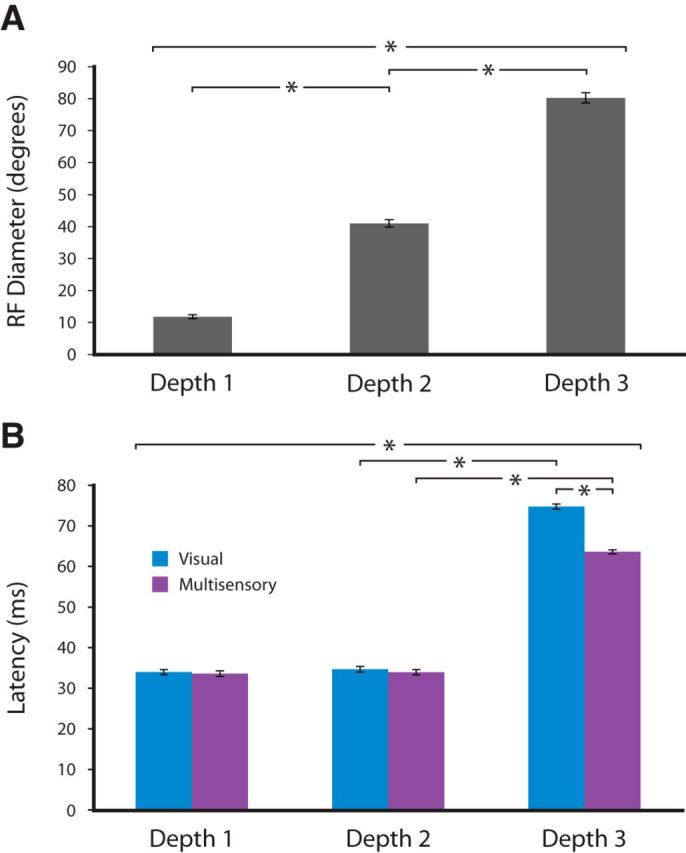
Quantification of RF size and response latency as a function of depth. A, Mean RF diameters at each of the recorded depths. Asterisks represent statistically significant differences between groups (n = 55). B, Latency of visual alone and visual-auditory responses at the three depths.
In addition to these differences in visual RF size, consistent changes in visual response latency were observed as a function of recording depth. The relationship between changes in response latency and changes in recording depth is illustrated in Figure 2B. A one-way ANOVA found that visual response latency significantly increased with depth (F(2,754) = 90.1, p < 0.01). Follow-up t tests revealed that the latency of visual responses was significantly greater at depth 3 (mean ± SD = 75 ± 28.5 ms) compared with depth 1 (34 ± 4.3 ms) and depth 2 (35 ± 4.3 ms) (Student's t tests: depth 1 vs depth 3: t = −9.70, p < 0.01; depth 2 vs depth 3: t = −9.26, p < 0.01; depth 1 vs depth 2: t = −0.78, p = 0.43).
Given our emphasis here on identifying multisensory responses in the superficial layers, along with this one-way analysis of visual response latencies, we also conducted a two-way analysis including modality of stimulation (visual alone vs visual-auditory) as a factor. This analysis revealed a significant interaction of recording depth and stimulus modality on response latency (F(2,1627) = 7.2, p = 0.0007). In the visual-auditory condition, mean response latencies were 33.0 ms (SD = 4.8), 34.0 ms (SD = 4.4), and 61.0 ms (SD = 30.7) for depths 1, 2, and 3, respectively. The interaction effect was driven by a difference in response latency between the visual and visual-auditory conditions at depth 3 (Student's t test: t = −9.4, p < 0.01). In contrast, visual and visual-auditory response latencies did not differ significantly for depth 1 (p = 0.69) and depth 2 (p = 0.42).
The combination of small visual RFs coupled with short visual response latencies provided great confidence that the uppermost (i.e., depth 1) recording sites were located within the superficial layers. To provide the most conservative estimate of the possibility of visual-auditory interactions in the superficial SC, the remaining analyses focus exclusively on responses recorded from this depth 1 site.
Auditory modulation of visually evoked spiking responses in the superficial layers of the SC
Once we established that a subset of our recording sites were restricted to the superficial layers, we tested for multisensory (i.e., visual-auditory) interactions in these layers. In these experiments, we first examined whether an auditory stimulus would either evoke overt responses or would modulate visual responses by examining the impact of the added auditory stimulus on visual spiking activity. Representative examples of visual, auditory, and visual-auditory spiking responses from two different superficial recording sites are shown in Figure 3. Although auditory stimuli never resulted in overt responses in superficial layer neurons, the presentation of an auditory stimulus often resulted in either an enhancement (Fig. 3A) or depression (Fig. 3B) of visual responses.
Figure 3.
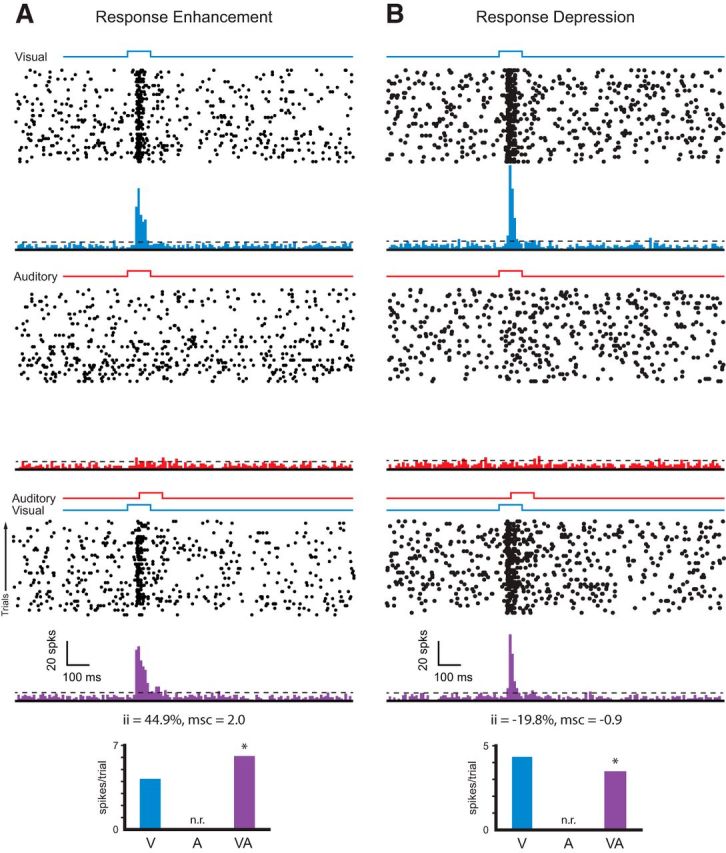
Spiking responses to visual, auditory, and combined stimulation in the superficial layers of SC. A, B, Representative example of MUA recorded from the superficial layers of SC showing response enhancement (A) and response depression (B). In each, rasters and PSTHs showing multiunit responses for visual (blue), auditory (red), and multisensory (purple) stimulation are shown. For the raster plots, each row represents a trial and each dot represents a spike. Onset and duration of visual and auditory stimuli are represented by blue and red square waves on top of the raster plots for each condition. Dashed horizontal line represents the threshold for neuronal response (i.e., 2 SDs above spontaneous activity). Bottom panels show the quantification of neuronal responses under the three stimulus conditions (V, A, and VA) as measured by ii and msc.
To quantify these multisensory interactions at the population level, we performed two separate analyses. In the first, we detailed the presence or absence of multisensory interactions in MUA in the 55 sites recorded in the most superficial layers of the SC (Fig. 4A). This analysis revealed that nearly all (53/55; 96.3%) of the recorded sites exhibited multisensory interactions at one or more of the tested locations within the RF. These interactions were further subdivided into sites showing only response enhancements (19/53; 35.8%), those showing only response depressions (7/53; 13.2%), and those showing both enhancements and depressions (27/53; 49.1%). The second population analysis quantified the total number of locations within the RFs that showed significant multisensory interactions (Fig. 4B). For all of the tested sites, significant interactions were restricted to a few locations within the RF. Most of these interactions were seen at locations at the borders of the RF and where visual sensitivity was weak (Fig. 4C–F; also see below in the Results section: Multisensory integration in the superficial layers of SC abides by principle of inverse effectiveness). Of the total of 1197 RF locations tested at the 55 superficial sites, 21.8% (261/1197) exhibited significant multisensory interactions. More than three-quarters of these interactions were response enhancements (212/261 = 81.2%).
Figure 4.

Quantification of multisensory interactions in the superficial SC layers. A, Pie charts showing the proportion of multiunits showing different types of multisensory interactions at some position inside their RF in the superficial layers of SC. B, Pie charts showing the type of interactions sorted by RF location. C–F, Representative examples of four visual RFs recorded from the superficial layers of SC that showed significant response modulations (bar graphs) under multisensory conditions when stimuli were placed at either the borders or the central locations of the RF. Note that significant interactions are generally seen at the RF borders. G, Plots of ii as a function of visual response magnitude in both conventional (left) and log-log-transformed (right) representations. Note that as visual responsiveness increases, the amount of multisensory modulation decreases.
Multisensory integration in the superficial SC abides by the principle of inverse effectiveness
One of the principles of multisensory integration as demonstrated in the deeper layers of the SC (as well as in other structures) is the principle of inverse effectiveness (Meredith and Stein, 1986b). This principle refers to the finding that as the effectiveness of the individual unisensory stimuli decline, the gain that is obtained from their combination increases. We found a similar relationship for the superficial layers of the SC, where the magnitude of the visual response appeared to be a significant determinant of the multisensory gain obtained with the addition of an auditory stimulus. Figure 4G illustrates this relationship by plotting the interactive index as a function of the magnitude of the visual response (in both standard and log-log coordinates) and reveals the largest gains at the lowest levels of visual response. As highlighted earlier, these weak visual responses were typically found near the RF borders (Fig. 4C–F).
Multisensory modulation of the local field potential in the superficial SC
Low-frequency (<100 Hz) voltage changes in the recorded signal, referred to as the LFP, are commonly regarded as a reflection of synaptic activity in the immediate vicinity of the electrode tip (Katzner et al., 2009; Kajikawa and Schroeder, 2011). Importantly, under some circumstances, the LFP can deviate substantially from local spiking activity (Maier et al., 2008). This dissociation is believed to reflect subthreshold activations that are the result of synaptic processes that fail to affect spiking (Buzsáki, 2002; Rasch et al., 2008). In an effort to expand our understanding of the observed multisensory effects on neuronal spiking in the superficial SC, we next focused on the LFP signal. Generally, two types of LFP activity can be distinguished: evoked activity that is strictly phase locked (time locked) to the onset of an event (in our case, the stimulus onset) and induced activity that is stimulus related but not phase locked to the onset of the stimulus. We computed both the evoked (i.e., phase-locked) and induced (i.e., non-phase-locked) LFP responses for all stimulus combinations and locations discussed above in the Results section (Auditory modulation of visually evoked spiking responses in the superficial layers of the SC). Figure 5 shows representative examples of spiking and LFP responses for two sites in the superficial layers, one of which showed an enhancement of spiking activity (left) and the other of which showed a response depression (right). Note the stimulus-evoked modulation of the LFP in the unisensory auditory condition in both instances (red traces in LFPs), a change that is not evident in the auditory spiking responses.
Figure 5.
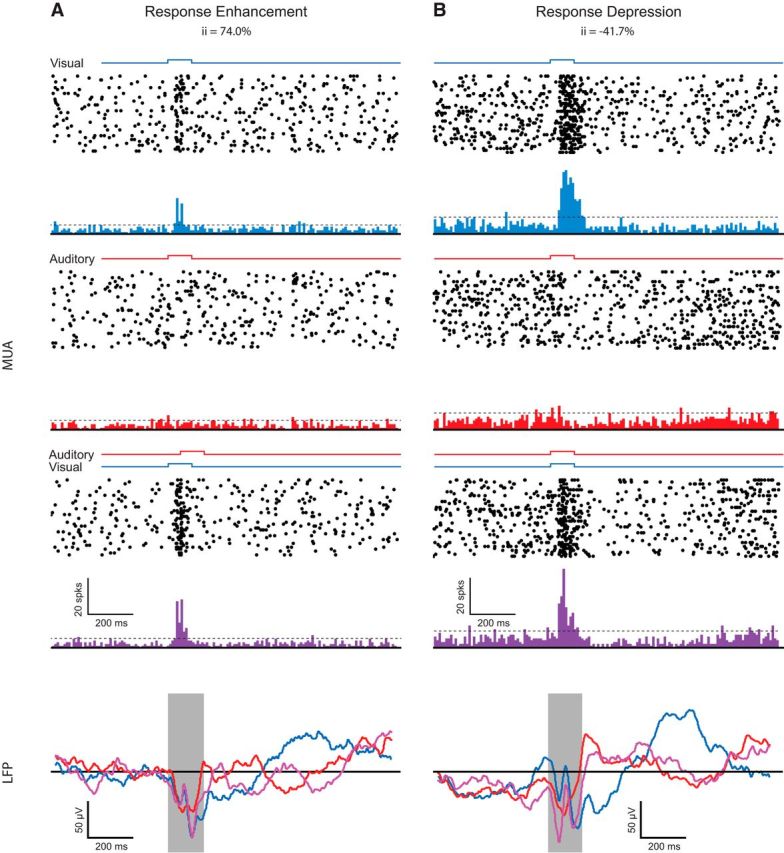
Spiking and LFP responses during multisensory stimulation. A, B, Top, Multiunit spiking response for an SC site showing response enhancement (A) and response depression (B). Bottom, Corresponding changes in the LFPs. Blue represents responses to the visual condition, red represents responses to the auditory condition, and purple represents responses to the multisensory condition for both the PSTHs and the evoked LFP traces. The onset and duration of stimuli are represented by square waves over the PSTHs for the different stimulus conditions. The shaded box over the LFP traces represent the duration of the multisensory stimulus combination (i.e., 150 ms).
To quantify the stimulus-related changes in the phase-locked LFP (the evoked potential or EVP) at the population level, we compared the peak EVP and AUC for visual, auditory, and multisensory conditions. To avoid potential confounds in the multisensory LFP response due to differences in SOAs, these LFP measures were performed separately for the two tested stimulus onset asynchronies (SOAs of V0A0 and V0A50). The results were largely similar across the two SOAs, so data from only a single SOA (V0A0) is shown here. We further divided the data according to stimulus locations showing enhancements, depressions, and no interactions in the spiking response (Fig. 6A). These analyses revealed significant EVPs for each of the unisensory and for the multisensory stimulus conditions. The statistical details of these analyses are reported in Table 1. The magnitude of the LFP signal as measured by both peak amplitude and AUC was significantly smaller for the auditory condition than for the visual and multisensory conditions, but was still demonstrable (i.e., significantly different from zero) in almost all circumstances. Comparing the visual and multisensory conditions, it is notable that peak EVP amplitude was higher for the multisensory condition for all of the tested interactive conditions.
Figure 6.
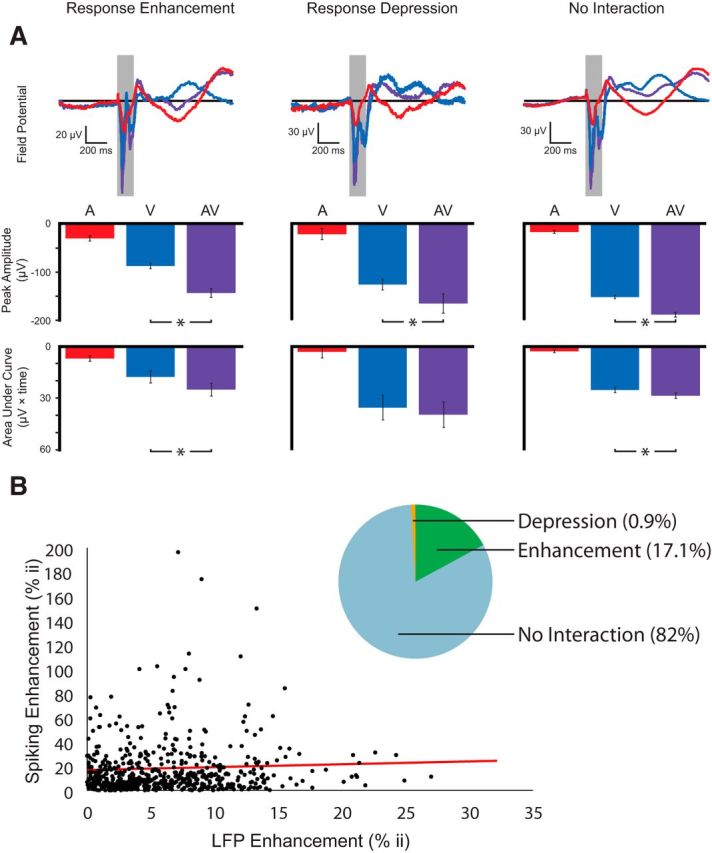
Quantification of evoked LFP amplitude in superficial layers of SC. A, Mean evoked LFP activity across all sites showing response enhancement, response depression, and no interaction for the V0A0 conditions. Top, Mean field potentials for these three conditions. Middle and bottom, Peak amplitude and AUC of the LFP, respectively. Asterisks represent statistically significant differences between groups. Statistical details are reported in Table 1. B, Pie chart showing the proportion of RF sites exhibiting response enhancement, response depression, and no interactions based on LFP responses. Correlation of multisensory modulations in spiking activity and LFP activity across RF sites (r = 0.0837, p = 0.03). The line of best fit is shown in red (y = 0.2319x + 16.789).
Table 1.
Details of statistical tests for quantification of mean peak amplitude and AUC for SOA = V0A0
| Enhancement | Depression | No interaction | |
|---|---|---|---|
| Comparisons, t (p) (df) | V vs AV | V vs AV | V vs AV |
| Mean peak amplitude | 7.30 (<<0.0189) | 2.56 (0.01) (28) | 10.3 (<<0.01) (468) |
| AUC | 3.7 (<<0.01) (df = 89) | 1.12 (0.26) (28) | 4.14 (3.9 × 10⁻⁹) (468) |
| Comparisons with baseline activity, t (p) | V vs baseline | A vs baseline | AV vs baseline |
| Enhancement | −7.21 (<<0.01) | −5.35 (<<0.01) | −15.03 (<<0.01) |
| Depression | −5.55 (<<0.01) | −1.65 (0.10) | −8.20 (<<0.01) |
| No interaction | −28.47 (<<0.01) | −4.81 (<<0.01) | −37.67 (<<0.01) |
Comparisons were done using Student's t test. The t scores, p-values, and degrees of freedom (df) are described for mean peak amplitude and AUC measures for each comparison. For more details on baseline comparisons, see the Materials and Methods.
In an effort to better characterize the stimulus-evoked LFP responses, we next quantified AUC 0–200 ms after the stimulus for all three stimulus conditions. Comparing the AUC of the EVP for this response epoch, which exhibited prominent negative deflections for all three stimulus conditions, revealed that for stimulus locations that yielded response enhancements and no interactions, the EVP area was significantly greater for the multisensory condition compared with the visual condition alone (response enhancement: V0A0: t = 3.7, p ≪ 0.01; no interactions: V0A0: t = 4.1, p ≪ 0.01; Fig. 6A, bottom bar graphs). In contrast, for stimulus combinations that resulted in depressions in spiking responses, areal measurements did not differ between the visual and multisensory conditions (V0A0: t = 1.1, p = 0.2; V0A50: t = 1.3, p = 0.1). This lack of a difference may be due to the size of the sample and the associated lack of statistical power because only 29 observations make up this dataset.
In addition, we also analyzed the LFP activity independent of the spiking activity. Similar to spiking responses, for the RF locations that were tested, the majority of locations (82%) failed to exhibit significant auditory modulations of visual activity (as measured by comparing peak LFP responses between visual and audiovisual conditions). In contrast, 18% of the RF sites exhibited significant response modulations. Again similar to the spiking results, the majority of these interactions were response enhancements (17%), whereas ∼1% were response depressions (Fig. 6B). Moreover, multisensory modulations in spiking activity and LFP activity was found to be significantly correlated across RF sites (r = 0.0837, p = 0.03).
Time frequency analysis for local field potentials in the superficial layers of SC
In addition to the time-locked analysis of EVPs, we also decomposed the LFP into its time-varying frequency components. The main reason for this analysis is that the temporal profile of LFP follows a 1/fx spectral distribution, where f denotes frequency and x is the exponent of a power law that varies slightly among cortical locations, behavioral states, and individual subjects(Ohl et al., 2000; Mizuseki et al., 2009). In other words, low-frequency voltage changes in the extracellular medium are disproportionally larger in amplitude than high-frequency fluctuations. Therefore, unbiased averages of LFP tend to be dominated by low-frequency components of the signal, potentially masking effects in the high-frequency range.
Another, more critical reason for decomposing LFP into the time-frequency domain is that it has been suggested that feedforward activation is more tightly linked to neural responses in the high (>30 Hz) frequency range, whereas feedback-related events show greater correlation with low-frequency (<20 Hz) activity (Donner and Siegel, 2011). These putative functional roles of activity in these frequency bands are consistent with the finding that high-frequency events are localized within a few millimeters of cortex (Liu and Newsome, 2006; Katzner et al., 2009; Kajikawa and Schroeder, 2011), whereas low-frequency signals tend to correlate over distances that span multiple cortical areas (Destexhe et al., 1999; Leopold et al., 2003; Canolty et al., 2007). Importantly, this spatial pattern is unlikely to result from frequency-specific attenuation of signals in cortical tissue because the biophysical properties of cortical tissue seem to place equal limitations on propagation of low-frequency and high-frequency signals (i.e., neural tissue is ohmic; Logothetis et al., 2007).
Therefore, next, spectral analysis was performed to investigate the stimulus-induced (i.e., phase-locked and non-phase-locked) LFP responses as a function of time and frequency. In addition to revealing non-phase-locked sensory responses, this analysis also allows for an investigation of the high-frequency components of the LFP that can easily be masked by the far more dominant slow components. Computing normalized spectrograms (see Materials and Methods), we quantified the stimulus-related LFP response across all frequency bands. Note that the qualitative structure of these time-frequency plots is similar for all three conditions (Fig. 7). Because the number of observations for stimulus locations resulting in response depressions was too low in the analyses outlined above (see Results section: Multisensory modulation of the local field potential in the superficial SC), they were excluded from further analysis. As evident from the spectrograms shown in Figure 7, the onset of unisensory visual stimulation was accompanied by an increase in power in the low-frequency range up to 20 Hz (i.e., the theta, alpha, and beta bands), as well as by an increase in the high gamma band (70–90 Hz). A smaller amplitude increase in power in the low gamma band (30–50 Hz) is also evident. Note the extended period of power change after stimulus onset (compared with the phase-locked EVP and spiking responses described above in the Results section: Multisensory modulation of the local field potential in the superficial SC and Auditory modulation of visually evoked spiking responses in the superficial layers of the SC) For the unisensory auditory condition, we found short latency increases in LFP power in the low-frequency range up to 10–12 Hz (theta and alpha bands) and also in the high gamma band (70–90 Hz), followed by a subsequent increase in power within the low (30–50 Hz) gamma bands. For the multisensory condition, we found that the onset of stimulation is accompanied by an increase in low-frequency power and high gamma power similar to that seen in the visual and auditory conditions and a subsequent increase in low gamma power similar to that evoked by the unisensory auditory stimulus.
Figure 7.

Time-frequency analysis of LFP responses. Averaged time-frequency representations (spectrograms) of LFP responses recorded from the superficial SC for the V0A0 condition showing power changes for the visual, auditory, and multisensory stimulus conditions and for all stimulus locations showing response enhancements and no interactions. Colored bar at the bottom right represents the percentage of LFP power change compared with prestimulus baseline. The dashed vertical lines represent the onset of the visual stimulus.
To better visualize the response differences between conditions, we generated contrast plots for each of the main stimulus comparisons (see Materials and Methods). Figure 8, top, shows the spectral contrast plot comparing the multisensory condition with the visual condition (AV-V) for both the response enhancement and no interaction conditions. Note the increased LFP power for the multisensory condition within the low-frequency bands (up to 20 Hz) and in the high gamma band after stimulus onset. This is followed by a subsequent increase in power in the low gamma bands (30–50 Hz) and decreased power in the lower frequency bands and both high and low gamma bands. To quantify these differences in LFP power across conditions, we performed a statistical analysis comparing the visual and multisensory plots (Fig. 8, bottom). Of particular note in this analysis (and as is evident in the contrast plots in the top panel [arrow]), the multisensory-mediated difference in high gamma power was more robust for stimuli that elicited response enhancement compared with the no interaction trials (F(1,7155) = 2552.3, p < 0.0001). We also generated contrast plots comparing the multisensory condition to the sum of the unisensory conditions (AV > V+A; Fig. 8, bottom). This analysis revealed that these interactions were almost exclusively subadditive. Collectively, these LFP analyses highlight significant differences between the visual-only and visual-auditory conditions, thus reinforcing the results of the spiking data and providing greater insight into the nature of the synaptic processes that may underlie the spiking changes.
Figure 8.
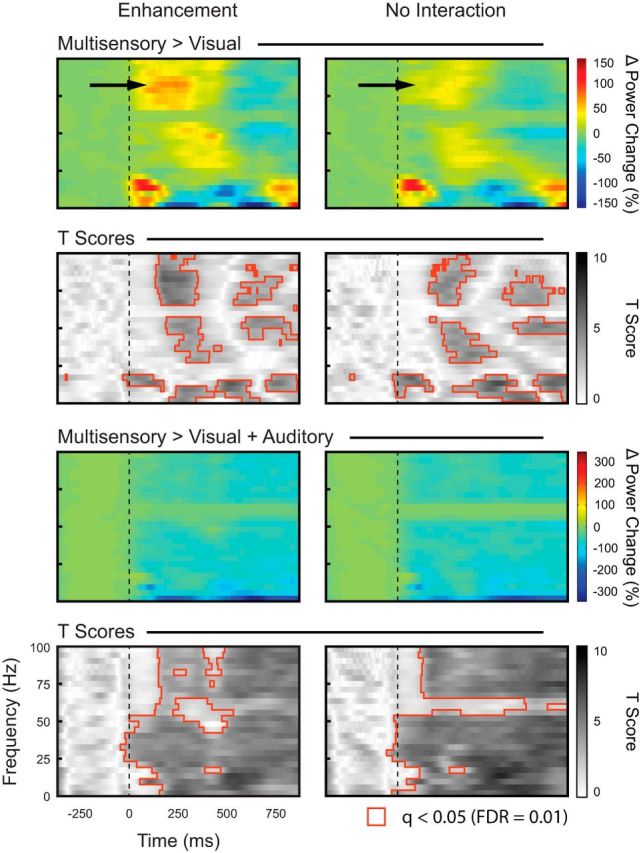
Statistical comparison of LFP responses to visual and multisensory stimulation. Top, Difference plots obtained by subtracting the average LFP response for the V condition from the AV stimulation condition (AV-V).The color bar on the right represents relative LFP power change (in %). The black arrow highlights modulation in the high gamma band (70–90 Hz). The dotted vertical line represents stimulus onset. Bottom, t scores for the contrast plots above. Darker shades represent higher t values. Regions outlined in red represent statistically significant t scores, corrected for multiple comparisons using FDR = 0.01. Shown are difference plots obtained by subtracting the average LFP response for the summed unisensory responses (V+A) from the multisensory (AV) stimulation condition [AV − (V+A)]. The color bar on the right represents relative LFP power change (in %). The dotted vertical line represents stimulus onset. t scores for the contrast plots above are shown on the bottom. Darker shades represent higher t values. Regions outlined in red represent statistically significant t scores, corrected for multiple comparisons using FDR = 0.01.
Discussion
The findings described here are the first, to our knowledge, that provide neurophysiological evidence for multisensory integration within the superficial layers of the SC. These results have important functional implications for our understanding of sensory processing within the SC.
Auditory stimulation modulates visual spiking responses in the superficial layers of SC
We found robust responses of superficial SC neurons to both moving and stationary visual stimuli that are consistent with previous reports (Sterling and Wickelgren, 1969; Wurtz and Albano, 1980). However, in striking contrast to the view of the superficial layers as exclusively visual, addition of an auditory stimulus produced significant modulation of the visual responses. Further analysis revealed an inverse relationship between the strength of the visual response and the magnitude of these multisensory interactions. Specifically, regions within the RF with weak visual responses (i.e., those near the borders) tended to show the greatest degree of gain to paired visual-auditory stimulation, whereas regions with strong visual responses often failed to show any response modulation. This finding is in accordance with the principle of “inverse effectiveness,” which was originally established for responses in the deep layers of the SC (Meredith and Stein, 1986b; Wallace and Stein, 1994; Meredith and Stein, 1996; Wallace et al., 1998; Perrault et al., 2003) and has since been extended to characterize multisensory responses in a number of neocortical areas in cats (Wallace et al., 1992; Carriere et al., 2008), monkeys (Barraclough et al., 2005; Ghazanfar et al., 2005; Kayser et al., 2005), and humans (Stevenson and James, 2009).
Multisensory interactions in the superficial SC are reflected in the LFP
In addition to the multisensory modulation of spiking activity in superficial SC, we also observed concurrent changes in the LFP. Although auditory stimulation alone did not produce spiking activity in these layers, it did result in changes in LFP power. This finding is mirrored by the fact that increased LFP amplitude was seen for most of the multisensory conditions compared with their visual correlates, whereas the multisensory modulation of the spiking responses was more restricted. One way to explain this dissociation between spiking activity and the LFP is that these two measures represent different aspects of neural mass action (Henze et al., 2000; Logothetis, 2008). Whereas MUA reflects the axonal output of a local neural population, LFPs are believed to be largely derived from synaptic processes (Mitzdorf, 1985, 1987; Kayser and Logothetis, 2007)
The anatomical substrates for the physiological finding of auditory influences in the superficial layers may be processes from the intermediate and deep SC that ascend into the superficial layers (Behan et al., 1987; Behan and Appell, 1992; Hall and Lee, 1993; Behan and Kime, 1996; Hall and Lee, 1997; Isa and Hall, 2009). Alternatively, auditory influences may arise via modulated cortical visual responses. The presence of auditory influences in primary (and extraprimary) visual cortical fields has now been demonstrated (Falchier et al., 2002; Rockland and Ojima, 2003) and may be a potential source for superficial SC auditory inputs.
Most important in the current context is that these auditory influences within the superficial layers can play an important modulatory role with regard to visual information processing. These “modulatory” multisensory influences are reminiscent of similar effects that have been described for higher-level visual areas (Allman et al., 2008a; Allman et al., 2008b; Clemo et al., 2008), for regions of association cortex (Dehner et al., 2004; Avillac et al., 2005; Barraclough et al., 2005; Meredith et al., 2006; Avillac et al., 2007; Chandrasekaran and Ghazanfar, 2009), and for classic unisensory cortical domains (visual cortex: McDonald et al., 2013; Iurilli et al., 2012 auditory cortex: Schroeder et al., 2001; Schroeder and Foxe, 2002; Ghazanfar et al., 2005; Kayser et al., 2005; Lakatos et al., 2007; Lakatos et al., 2008; Kayser et al., 2010). Similar to the superficial SC data shown here, many of these areas show spiking responses to the dominant modality only, but LFP responses that reveal subthreshold synaptic influences from other modalities.
Collectively, these results suggest that, in addition to the overt convergence and integration of sensory inputs in “traditional” multisensory brain areas (including the deeper SC), multisensory influences extend to a host of structures that have been classically defined as components of a sensory specific axis. Although evidence for this view has been growing rapidly in cortex (Falchier et al., 2002; Rockland and Ojima, 2003; Ghazanfar et al., 2005; Kayser et al., 2005; Lakatos et al., 2007; Lakatos et al., 2008; Kayser et al., 2010), ours is the first study to our knowledge that extends the prevalence of these modulatory effects into a subcortical structure previously believed to be sensory specific.
Gamma activity and its relations to spiking activity and multisensory integrative capacity
We found an increase in high gamma (50–90 Hz) power in the superficial SC layers after visual stimulation. Increased activity in this frequency band has been reported after visual stimulation for a wide variety of visual areas and species in both anesthetized and awake preparations (Eckhorn et al., 1988; Gray and Singer, 1989; Gray et al., 1989; Engel et al., 1991a; Engel et al., 1991b; Frien et al., 1994; Kreiter and Singer, 1996; Fries et al., 1997; Rols et al., 2001; Berens et al., 2008). One plausible explanation for the increase in high gamma LFP power is that it is generally found to be closely related to (and indeed predictive of) local spiking activity (Rasch et al., 2008; Berens et al., 2010). This interpretation can also explain why increases in high gamma power were significantly larger for conditions yielding multisensory response enhancements in the spiking data. Note that similar findings have been reported in monkey superior temporal sulcus, where enhanced gamma band activity was found during the multisensory integration of faces and voices (Chandrasekaran and Ghazanfar, 2009).
Low-frequency fluctuations in the multisensory LFP
Time-frequency analysis of the LFP signal further revealed that, in addition to the changes in the high gamma band, the onset of visual stimulation is followed by an increase in LFP power in the lower-frequency (<30 Hz) bands. Similarly, after auditory stimulation, there is an increase in low-frequency LFP power. Combined visual-auditory stimulation resulted in an LFP response that shared the spectral characteristics of both unisensory visual and auditory responses. Most notably, the increase in power within the low-frequency bands during multisensory stimulation is greater than that which occurs during visual stimulation alone. As highlighted above, our assumption is that high gamma activity seen under the visual, auditory, and multisensory conditions reflects synaptic drive in close proximity to the electrode because it is tightly coupled to changes in spiking activity. In contrast, the lower-frequency components of the LFP are likely to index a broader profile of synaptic processing, which may include auditory influences reaching superficial SC from deeper layers or even primary visual cortex. This suggestion is based on the observation that differences between conditions yielding response enhancement and no interaction are clearly seen in high gamma activity, whereas such differences are not evident at lower frequencies.
Caveats of the current study
One important caveat in the interpretation of the present work is the potential effects of anesthesia on the recorded LFP and spiking responses. Although we acknowledge this concern, we would argue that anesthetized recordings represent the first important step in establishing the presence of auditory inputs to the superficial SC. Anesthesia is used because of the time necessary to complete the numerous stimulus conditions that entail the experimental design, which often necessitate holding an individual neuron for periods in excess of 2 h (a virtual impossibility in an awake and behaving preparation). Because of the commonalities in the basic multisensory response characteristics in both anesthetized and awake animals (Wallace et al., 1998), these anesthetized experiments are an integral first step in detailing auditory influences in the superficial SC layers and there is no reason why anesthesia should invalidate these novel findings. However, we also strongly agree that this work next needs to be replicated in awake and behaving animals and that these paradigms will allow important insights to be gleaned into the functional role of these inputs.
Another possible concern is that we cannot rule out completely that the LFP modulation in the upper layers of the SC reflects nonlocal activity changes in the deeper layers of the SC or elsewhere. However, we deem this scenario unlikely for the following reasons. First, although the spatial extent of LFP signals is dependent on many factors such as electrode type, reference location, and the selected frequency band, current estimates range from about 500 to 800 μm (Liu and Newsome, 2006; Katzner et al., 2009; Xing et al., 2009; Berens et al., 2010).This spatial estimate lies well within the neuroanatomical confines of the superficial layers of the SC, which extend from 800 to 1000 μm in cats (Huerta, 1984; May, 2006). Second, while beyond the scope of this study, our preliminary observations suggest that evoked LFPs differ dramatically between the superficial and intermediate/deep layers of the SC. Specifically, we observed a clear distinction in the latency and the spectral content of visual responses in the superficial and deep layers (data not shown).
Putative functional implications
The superficial layers of the SC have been implicated to play an important role in visual form discrimination (Sprague et al., 1970; Anderson et al., 1971; Berlucchi et al., 1972; Sprague et al., 1977; Tunkl and Berkley, 1977). The present results, by showing the presence of auditory influences in these layers, suggest that visual form discrimination (and other visual functions of the superficial SC) may be aided (or impeded) by the presence of concurrent auditory stimuli. A selective enhancement of activity could be mediated through a gain control mechanism that serves to boost the salience of the visual signal when coupled with auditory cues. Such a mechanism may serve to amplify the visual signal under weak, ambiguous or noisy conditions, thus improving detection thresholds, discriminability, and localization. Our finding that visual activity is modulated by auditory stimulation in the superficial SC may thus pave the way for future studies examining the possible behavioral implications of these multisensory influences in the superficial layers.
Footnotes
This work was supported by National Institute of Mental Health (Grant MH-63861) and by Vanderbilt Kennedy Center and Vanderbilt Brain Institute Development Funds. We thank Zachary Barnett for contributing toward setting up the stimulus paradigm and providing some of the analytic tools and the Vanderbilt University Division of Animal Care.
The authors declare no competing financial interests.
References
- Allman BL, Keniston LP, Meredith MA. Subthreshold auditory inputs to extrastriate visual neurons are responsive to parametric changes in stimulus quality: sensory-specific versus non-specific coding. Brain Res. 2008a;1242:95–101. doi: 10.1016/j.brainres.2008.03.086. [DOI] [PMC free article] [PubMed] [Google Scholar]
- Allman BL, Bittencourt-Navarrete RE, Keniston LP, Medina AE, Wang MY, Meredith MA. Do cross-modal projections always result in multisensory integration? Cereb Cortex. 2008b;18:2066–2076. doi: 10.1093/cercor/bhm230. [DOI] [PMC free article] [PubMed] [Google Scholar]
- Anderson ME, Yoshida M, Wilson VJ. Influence of superior colliculus on cat neck motoneurons. J Neurophysiol. 1971;34:898–907. doi: 10.1152/jn.1971.34.5.898. [DOI] [PubMed] [Google Scholar]
- Avillac M, Denève S, Olivier E, Pouget A, Duhamel JR. Reference frames for representing visual and tactile locations in parietal cortex. Nat Neurosci. 2005;8:941–949. doi: 10.1038/nn1480. [DOI] [PubMed] [Google Scholar]
- Avillac M, Ben Hamed S, Duhamel JR. Multisensory integration in the ventral intraparietal area of the macaque monkey. J Neurosci. 2007;27:1922–1932. doi: 10.1523/JNEUROSCI.2646-06.2007. [DOI] [PMC free article] [PubMed] [Google Scholar]
- Barraclough NE, Xiao D, Baker CI, Oram MW, Perrett DI. Integration of visual and auditory information by superior temporal sulcus neurons responsive to the sight of actions. J Cogn Neurosci. 2005;17:377–391. doi: 10.1162/0898929053279586. [DOI] [PubMed] [Google Scholar]
- Behan M, Appell PP. Intrinsic circuitry in the cat superior colliculus: projections from the superficial layers. J Comp Neurol. 1992;315:230–243. doi: 10.1002/cne.903150209. [DOI] [PubMed] [Google Scholar]
- Behan M, Kime NM. Spatial distribution of tectotectal connections in the cat. Prog Brain Res. 1996;112:131–142. doi: 10.1016/S0079-6123(08)63325-7. [DOI] [PubMed] [Google Scholar]
- Behan M, Lin CS, Hall WC. The nigrotectal projection in the cat: an electron microscope autoradiographic study. Neuroscience. 1987;21:529–539. doi: 10.1016/0306-4522(87)90139-4. [DOI] [PubMed] [Google Scholar]
- Berens P, Keliris GA, Ecker AS, Logothetis NK, Tolias AS. Feature selectivity of the gamma-band of the local field potential in primate primary visual cortex. Front Neurosci. 2008;2:199–207. doi: 10.3389/neuro.01.037.2008. [DOI] [PMC free article] [PubMed] [Google Scholar]
- Berens P, Logothetis NK, Tolias AS. Local field potentials, BOLD and spiking activity–relationships and physiological mechanisms. 2010. http://hdl.handle.net/10101/npre.2010.5216.1 (2010)
- Berlucchi G, Sprague JM, Levy J, DiBerardino AC. Pretectum and superior colliculus in visually guided behavior and in flux and form discrimination in the cat. J Comp Physiol Psychol. 1972;78:123–172. doi: 10.1037/h0032172. [DOI] [PubMed] [Google Scholar]
- Buzsáki G. Theta oscillations in the hippocampus. Neuron. 2002;33:325–340. doi: 10.1016/S0896-6273(02)00586-X. [DOI] [PubMed] [Google Scholar]
- Canolty RT, Soltani M, Dalal SS, Edwards E, Dronkers NF, Nagarajan SS, Kirsch HE, Barbaro NM, Knight RT. Spatiotemporal dynamics of word processing in the human brain. Front Neurosci. 2007;1:185–196. doi: 10.3389/neuro.01.1.1.014.2007. [DOI] [PMC free article] [PubMed] [Google Scholar]
- Carriere BN, Royal DW, Wallace MT. Spatial heterogeneity of cortical receptive fields and its impact on multisensory interactions. J Neurophysiol. 2008;99:2357–2368. doi: 10.1152/jn.01386.2007. [DOI] [PMC free article] [PubMed] [Google Scholar]
- Casagrande VA, Harting JK, Hall WC, Diamond IT, Martin GF. Superior colliculus of the tree shrew: a structural and functional subdivision into superficial and deep layers. Science. 1972;177:444–447. doi: 10.1126/science.177.4047.444. [DOI] [PubMed] [Google Scholar]
- Chandrasekaran C, Ghazanfar AA. Different neural frequency bands integrate faces and voices differently in the superior temporal sulcus. J Neurophysiol. 2009;101:773–788. doi: 10.1152/jn.90843.2008. [DOI] [PMC free article] [PubMed] [Google Scholar]
- Clemo HR, Stein BE. Somatosensory cortex: a ‘new’ somatotopic representation. Brain Res. 1982;235:162–168. doi: 10.1016/0006-8993(82)90207-4. [DOI] [PubMed] [Google Scholar]
- Clemo HR, Sharma GK, Allman BL, Meredith MA. Auditory projections to extrastriate visual cortex: connectional basis for multisensory processing in ‘unimodal’ visual neurons. Exp Brain Res. 2008;191:37–47. doi: 10.1007/s00221-008-1493-7. [DOI] [PMC free article] [PubMed] [Google Scholar]
- Dehner LR, Keniston LP, Clemo HR, Meredith MA. Cross-modal circuitry between auditory and somatosensory areas of the cat anterior ectosylvian sulcal cortex: a ‘new’ inhibitory form of multisensory convergence. Cereb Cortex. 2004;14:387–403. doi: 10.1093/cercor/bhg135. [DOI] [PubMed] [Google Scholar]
- Destexhe A, Contreras D, Steriade M. Spatiotemporal analysis of local field potentials and unit discharges in cat cerebral cortex during natural wake and sleep states. J Neurosci. 1999;19:4595–4608. doi: 10.1523/JNEUROSCI.19-11-04595.1999. [DOI] [PMC free article] [PubMed] [Google Scholar]
- Donner TH, Siegel M. A framework for local cortical oscillation patterns. Trends Cogn Sci. 2011;15:191–199. doi: 10.1016/j.tics.2011.03.007. [DOI] [PubMed] [Google Scholar]
- Doubell TP, Skaliora I, Baron J, King AJ. Functional connectivity between the superficial and deeper layers of the superior colliculus: an anatomical substrate for sensorimotor integration. J Neurosci. 2003;23:6596–6607. doi: 10.1523/JNEUROSCI.23-16-06596.2003. [DOI] [PMC free article] [PubMed] [Google Scholar]
- Eckhorn R, Bauer R, Jordan W, Brosch M, Kruse W, Munk M, Reitboeck HJ. Coherent oscillations: a mechanism of feature linking in the visual cortex? Multiple electrode and correlation analyses in the cat. Biol Cybern. 1988;60:121–130. doi: 10.1007/BF00202899. [DOI] [PubMed] [Google Scholar]
- Edwards SB, Ginsburgh CL, Henkel CK, Stein BE. Sources of subcortical projections to the superior colliculus in the cat. J Comp Neurol. 1979;184:309–329. doi: 10.1002/cne.901840207. [DOI] [PubMed] [Google Scholar]
- Engel AK, Kreiter AK, König P, Singer W. Synchronization of oscillatory neuronal responses between striate and extrastriate visual cortical areas of the cat. Proc Natl Acad Sci U S A. 1991a;88:6048–6052. doi: 10.1073/pnas.88.14.6048. [DOI] [PMC free article] [PubMed] [Google Scholar]
- Engel AK, König P, Kreiter AK, Singer W. Interhemispheric synchronization of oscillatory neuronal responses in cat visual cortex. Science. 1991b;252:1177–1179. doi: 10.1126/science.252.5009.1177. [DOI] [PubMed] [Google Scholar]
- Falchier A, Clavagnier S, Barone P, Kennedy H. Anatomical evidence of multimodal integration in primate striate cortex. J Neurosci. 2002;22:5749–5759. doi: 10.1523/JNEUROSCI.22-13-05749.2002. [DOI] [PMC free article] [PubMed] [Google Scholar]
- Frien A, Eckhorn R, Bauer R, Woelbern T, Kehr H. Stimulus-specific fast oscillations at zero phase between visual areas V1 and V2 of awake monkey. Neuroreport. 1994;5:2273–2277. doi: 10.1097/00001756-199411000-00017. [DOI] [PubMed] [Google Scholar]
- Fries P, Roelfsema PR, Engel AK, König P, Singer W. Synchronization of oscillatory responses in visual cortex correlates with perception in interocular rivalry. Proc Natl Acad Sci U S A. 1997;94:12699–12704. doi: 10.1073/pnas.94.23.12699. [DOI] [PMC free article] [PubMed] [Google Scholar]
- Ghazanfar AA, Maier JX, Hoffman KL, Logothetis NK. Multisensory integration of dynamic faces and voices in rhesus monkey auditory cortex. J Neurosci. 2005;25:5004–5012. doi: 10.1523/JNEUROSCI.0799-05.2005. [DOI] [PMC free article] [PubMed] [Google Scholar]
- Ghose D, Barnett ZP, Wallace MT. Impact of response duration on multisensory integration. J Neurophysiol. 2012;108:2534–2544. doi: 10.1152/jn.00286.2012. [DOI] [PMC free article] [PubMed] [Google Scholar]
- Grantyn A, Berthoz A. Burst activity of identified tecto-reticulo-spinal neurons in the alert cat. Exp Brain Res. 1985;57:417–421. doi: 10.1007/BF00236550. [DOI] [PubMed] [Google Scholar]
- Grantyn R, Grantyn A, Schierwagen A. Passive membrane properties, afterpotentials and repetitive firing of superior colliculus neurons studied in the anesthetized cat. Exp Brain Res. 1983;50:377–391. doi: 10.1007/BF00239204. [DOI] [PubMed] [Google Scholar]
- Gray CM, Singer W. Stimulus-specific neuronal oscillations in orientation columns of cat visual cortex. Proc Natl Acad Sci U S A. 1989;86:1698–1702. doi: 10.1073/pnas.86.5.1698. [DOI] [PMC free article] [PubMed] [Google Scholar]
- Gray CM, König P, Engel AK, Singer W. Oscillatory responses in cat visual cortex exhibit inter-columnar synchronization which reflects global stimulus properties. Nature. 1989;338:334–337. doi: 10.1038/338334a0. [DOI] [PubMed] [Google Scholar]
- Hall WC, Lee P. Interlaminar connections of the superior colliculus in the tree shrew. I. The superficial gray layer. J Comp Neurol. 1993;332:213–223. doi: 10.1002/cne.903320206. [DOI] [PubMed] [Google Scholar]
- Hall WC, Lee P. Interlaminar connections of the superior colliculus in the tree shrew. III: The optic layer. Vis Neurosci. 1997;14:647–661. doi: 10.1017/S095252380001261X. [DOI] [PubMed] [Google Scholar]
- Henze DA, Borhegyi Z, Csicsvari J, Mamiya A, Harris KD, Buzsáki G. Intracellular features predicted by extracellular recordings in the hippocampus in vivo. J Neurophysiol. 2000;84:390–400. doi: 10.1152/jn.2000.84.1.390. [DOI] [PubMed] [Google Scholar]
- Huerta MF, Harting JK. The mammalian superior colliculus studies of its morphology and connections. In: Vanegas H, editor. Comparative neurology of the optic tectum. New York: Plenum; 1984. pp. 687–773. [Google Scholar]
- Isa T, Hall WC. Exploring the superior colliculus in vitro. J Neurophysiol. 2009;102:2581–2593. doi: 10.1152/jn.00498.2009. [DOI] [PMC free article] [PubMed] [Google Scholar]
- Iurilli G, Ghezzi D, Olcese U, Lassi G, Nazzaro C, Tonini R, Tucci V, Benfenati F, Medini P. Sound driven synaptic inhibition in primary visual cortex. Neuron. 2012;73:814–828. doi: 10.1016/j.neuron.2011.12.026. [DOI] [PMC free article] [PubMed] [Google Scholar]
- Kajikawa Y, Schroeder CE. How local is the local field potential? Neuron. 2011;72:847–858. doi: 10.1016/j.neuron.2011.09.029. [DOI] [PMC free article] [PubMed] [Google Scholar]
- Katzner S, Nauhaus I, Benucci A, Bonin V, Ringach DL, Carandini M. Local origin of field potentials in visual cortex. Neuron. 2009;61:35–41. doi: 10.1016/j.neuron.2008.11.016. [DOI] [PMC free article] [PubMed] [Google Scholar]
- Kayser C, Logothetis NK. Do early sensory cortices integrate cross-modal information? Brain Struct Funct. 2007;212:121–132. doi: 10.1007/s00429-007-0154-0. [DOI] [PubMed] [Google Scholar]
- Kayser C, Petkov CI, Augath M, Logothetis NK. Integration of touch and sound in auditory cortex. Neuron. 2005;48:373–384. doi: 10.1016/j.neuron.2005.09.018. [DOI] [PubMed] [Google Scholar]
- Kayser C, Logothetis NK, Panzeri S. Visual enhancement of the information representation in auditory cortex. Curr Biol. 2010;20:19–24. doi: 10.1016/j.cub.2009.10.068. [DOI] [PubMed] [Google Scholar]
- Kreiter AK, Singer W. Stimulus-dependent synchronization of neuronal responses in the visual cortex of the awake macaque monkey. J Neurosci. 1996;16:2381–2396. doi: 10.1523/JNEUROSCI.16-07-02381.1996. [DOI] [PMC free article] [PubMed] [Google Scholar]
- Kudo M. Projections of the nuclei of the lateral lemniscus in the cat: an autoradiographic study. Brain Res. 1981;221:57–69. doi: 10.1016/0006-8993(81)91063-5. [DOI] [PubMed] [Google Scholar]
- Kudo M, Niimi K. Ascending projections of the inferior colliculus in the cat: an autoradiographic study. J Comp Neurol. 1980;191:545–556. doi: 10.1002/cne.901910403. [DOI] [PubMed] [Google Scholar]
- Lakatos P, Chen CM, O'Connell MN, Mills A, Schroeder CE. Neuronal oscillations and multisensory interaction in primary auditory cortex. Neuron. 2007;53:279–292. doi: 10.1016/j.neuron.2006.12.011. [DOI] [PMC free article] [PubMed] [Google Scholar]
- Lakatos P, Karmos G, Mehta AD, Ulbert I, Schroeder CE. Entrainment of neuronal oscillations as a mechanism of attentional selection. Science. 2008;320:110–113. doi: 10.1126/science.1154735. [DOI] [PubMed] [Google Scholar]
- Leopold DA, Murayama Y, Logothetis NK. Very slow activity fluctuations in monkey visual cortex: implications for functional brain imaging. Cereb Cortex. 2003;13:422–433. doi: 10.1093/cercor/13.4.422. [DOI] [PubMed] [Google Scholar]
- Liu J, Newsome WT. Local field potential in cortical area MT: stimulus tuning and behavioral correlations. J Neurosci. 2006;26:7779–7790. doi: 10.1523/JNEUROSCI.5052-05.2006. [DOI] [PMC free article] [PubMed] [Google Scholar]
- Lo FS, Cork RJ, Mize RR. Physiological properties of neurons in the optic layer of the rat's superior colliculus. J Neurophysiol. 1998;80:331–343. doi: 10.1152/jn.1998.80.1.331. [DOI] [PubMed] [Google Scholar]
- Logothetis NK. What we can do and what we cannot do with fMRI. Nature. 2008;453:869–878. doi: 10.1038/nature06976. [DOI] [PubMed] [Google Scholar]
- Logothetis NK, Kayser C, Oeltermann A. In vivo measurement of cortical impedance spectrum in monkeys: implications for signal propagation. Neuron. 2007;55:809–823. doi: 10.1016/j.neuron.2007.07.027. [DOI] [PubMed] [Google Scholar]
- Maier A, Wilke M, Aura C, Zhu C, Ye FQ, Leopold DA. Divergence of fMRI and neural signals in V1 during perceptual suppression in the awake monkey. Nat Neurosci. 2008;11:1193–1200. doi: 10.1038/nn.2173. [DOI] [PMC free article] [PubMed] [Google Scholar]
- May PJ. The mammalian superior colliculus: laminar structure and connections. Prog Brain Res. 2006;151:321–378. doi: 10.1016/S0079-6123(05)51011-2. [DOI] [PubMed] [Google Scholar]
- McDonald JJ, Störmer VS, Martinez A, Feng W, Hillyard SA. Salient sounds activate human visual cortex automatically. J Neurosci. 2013;33:9194–9201. doi: 10.1523/JNEUROSCI.5902-12.2013. [DOI] [PMC free article] [PubMed] [Google Scholar]
- Meredith MA, Stein BE. Interactions among converging sensory inputs in the superior colliculus. Science. 1983;221:389–391. doi: 10.1126/science.6867718. [DOI] [PubMed] [Google Scholar]
- Meredith MA, Stein BE. Spatial factors determine the activity of multisensory neurons in cat superior colliculus. Brain Res. 1986a;365:350–354. doi: 10.1016/0006-8993(86)91648-3. [DOI] [PubMed] [Google Scholar]
- Meredith MA, Stein BE. Visual, auditory, and somatosensory convergence on cells in superior colliculus results in multisensory integration. J Neurophysiol. 1986b;56:640–662. doi: 10.1152/jn.1986.56.3.640. [DOI] [PubMed] [Google Scholar]
- Meredith MA, Stein BE. The visuotopic component of the multisensory map in the deep laminae of the cat superior colliculus. J Neurosci. 1990;10:3727–3742. doi: 10.1523/JNEUROSCI.10-11-03727.1990. [DOI] [PMC free article] [PubMed] [Google Scholar]
- Meredith MA, Stein BE. Spatial determinants of multisensory integration in cat superior colliculus neurons. J Neurophysiol. 1996;75:1843–1857. doi: 10.1152/jn.1996.75.5.1843. [DOI] [PubMed] [Google Scholar]
- Meredith MA, Nemitz JW, Stein BE. Determinants of multisensory integration in superior colliculus neurons. I. Temporal factors. J Neurosci. 1987;7:3215–3229. doi: 10.1523/JNEUROSCI.07-10-03215.1987. [DOI] [PMC free article] [PubMed] [Google Scholar]
- Meredith MA, Keniston LR, Dehner LR, Clemo HR. Crossmodal projections from somatosensory area SIV to the auditory field of the anterior ectosylvian sulcus (FAES) in cat: further evidence for subthreshold forms of multisensory processing. Exp Brain Res. 2006;172:472–484. doi: 10.1007/s00221-006-0356-3. [DOI] [PubMed] [Google Scholar]
- Mitzdorf U. Current source-density method and application in cat cerebral cortex: investigation of evoked potentials and EEG phenomena. Physiol Rev. 1985;65:37–100. doi: 10.1152/physrev.1985.65.1.37. [DOI] [PubMed] [Google Scholar]
- Mitzdorf U. Properties of the evoked potential generators: current source-density analysis of visually evoked potentials in the cat cortex. Int J Neurosci. 1987;33:33–59. doi: 10.3109/00207458708985928. [DOI] [PubMed] [Google Scholar]
- Mizuseki K, Sirota A, Pastalkova E, Buzsáki G. Theta oscillations provide temporal windows for local circuit computation in the entorhinal-hippocampal loop. Neuron. 2009;64:267–280. doi: 10.1016/j.neuron.2009.08.037. [DOI] [PMC free article] [PubMed] [Google Scholar]
- Mucke L, Norita M, Benedek G, Creutzfeldt O. Physiologic and anatomic investigation of a visual cortical area situated in the ventral bank of the anterior ectosylvian sulcus of the cat. Exp Brain Res. 1982;46:1–11. doi: 10.1007/BF00238092. [DOI] [PubMed] [Google Scholar]
- Munoz DP, Guitton D. Tectospinal neurons in the cat have discharges coding gaze position error. Brain Res. 1985;341:184–188. doi: 10.1016/0006-8993(85)91487-8. [DOI] [PubMed] [Google Scholar]
- Munoz DP, Guitton D. Fixation and orientation control by the tecto-reticulo-spinal system in the cat whose head is unrestrained. Rev Neurol (Paris) 1989;145:567–579. [PubMed] [Google Scholar]
- Ogasawara K, McHaffie JG, Stein BE. Two visual corticotectal systems in cat. J Neurophysiol. 1984;52:1226–1245. doi: 10.1152/jn.1984.52.6.1226. [DOI] [PubMed] [Google Scholar]
- Ohl FW, Schulze H, Scheich H, Freeman WJ. Spatial representation of frequency modulated tones in gerbil auditory cortex revealed by epidural electrocorticography. J Physiol (Paris) 2000;94:549–554. doi: 10.1016/S0928-4257(00)01091-3. [DOI] [PubMed] [Google Scholar]
- Perrault TJ, Jr, Vaughan JW, Stein BE, Wallace MT. Neuron-specific response characteristics predict the magnitude of multisensory integration. J Neurophysiol. 2003;90:4022–4026. doi: 10.1152/jn.00494.2003. [DOI] [PubMed] [Google Scholar]
- Perrault TJ, Jr, Vaughan JW, Stein BE, Wallace MT. Superior colliculus neurons use distinct operational modes in the integration of multisensory stimuli. J Neurophysiol. 2005;93:2575–2586. doi: 10.1152/jn.00926.2004. [DOI] [PubMed] [Google Scholar]
- Rasch MJ, Gretton A, Murayama Y, Maass W, Logothetis NK. Inferring spike trains from local field potentials. J Neurophysiol. 2008;99:1461–1476. doi: 10.1152/jn.00919.2007. [DOI] [PubMed] [Google Scholar]
- Rockland KS, Ojima H. Multisensory convergence in calcarine visual areas in macaque monkey. Int J Psychophysiol. 2003;50:19–26. doi: 10.1016/S0167-8760(03)00121-1. [DOI] [PubMed] [Google Scholar]
- Rols G, Tallon-Baudry C, Girard P, Bertrand O, Bullier J. Cortical mapping of gamma oscillations in areas V1 and V4 of the macaque monkey. Vis Neurosci. 2001;18:527–540. doi: 10.1017/S0952523801184038. [DOI] [PubMed] [Google Scholar]
- Schroeder CE, Foxe JJ. The timing and laminar profile of converging inputs to multisensory areas of the macaque neocortex. Brain Res Cogn Brain Res. 2002;14:187–198. doi: 10.1016/S0926-6410(02)00073-3. [DOI] [PubMed] [Google Scholar]
- Schroeder CE, Lindsley RW, Specht C, Marcovici A, Smiley JF, Javitt DC. Somatosensory input to auditory association cortex in the macaque monkey. J Neurophysiol. 2001;85:1322–1327. doi: 10.1152/jn.2001.85.3.1322. [DOI] [PubMed] [Google Scholar]
- Segal RL, Beckstead RM. The lateral suprasylvian corticotectal projection in cats. J Comp Neurol. 1984;225:259–275. doi: 10.1002/cne.902250210. [DOI] [PubMed] [Google Scholar]
- Sprague JM, Berlucchi G, Di Berardino A. The superior colliculus and pretectum in visually guided behavior and visual discrimination in the cat. Brain Behav Evol. 1970;3:285–294. doi: 10.1159/000125478. [DOI] [PubMed] [Google Scholar]
- Sprague JM, Levy J, DiBerardino A, Berlucchi G. Visual cortical areas mediating form discrimination in the cat. J Comp Neurol. 1977;172:441–488. doi: 10.1002/cne.901720305. [DOI] [PubMed] [Google Scholar]
- Stanford TR, Stein BE. Superadditivity in multisensory integration: putting the computation in context. Neuroreport. 2007;18:787–792. doi: 10.1097/WNR.0b013e3280c1e315. [DOI] [PubMed] [Google Scholar]
- Stanford TR, Quessy S, Stein BE. Evaluating the operations underlying multisensory integration in the cat superior colliculus. J Neurosci. 2005;25:6499–6508. doi: 10.1523/JNEUROSCI.5095-04.2005. [DOI] [PMC free article] [PubMed] [Google Scholar]
- Stein BE, Meredith MA. The merging of the senses. Cambridge, MA: MIT; 1993. [Google Scholar]
- Sterling P. Receptive fields and synaptic organization of the superficial gray layer of the cat superior colliculus. Vision Res. 1971:309–328. doi: 10.1016/0042-6989(71)90048-4. [DOI] [PubMed] [Google Scholar]
- Sterling P, Wickelgren BG. Visual receptive fields in the superior colliculus of the cat. J Neurophysiol. 1969;32:1–15. doi: 10.1152/jn.1969.32.1.1. [DOI] [PubMed] [Google Scholar]
- Stevenson RA, James TW. Audiovisual integration in human superior temporal sulcus: Inverse effectiveness and the neural processing of speech and object recognition. Neuroimage. 2009;44:1210–1223. doi: 10.1016/j.neuroimage.2008.09.034. [DOI] [PubMed] [Google Scholar]
- Tortelly A, Reinoso-Suarez F, Llamas A. Projections from non-visual cortical areas to the superior colliculus demonstrated by retrograde transport of HRP in the cat. Brain Res. 1980;188:543–549. doi: 10.1016/0006-8993(80)90052-9. [DOI] [PubMed] [Google Scholar]
- Tunkl JE, Berkley MA. The role of superior colliculus in vision: visual form discrimination in cats with superior colliculus ablations. J Comp Neurol. 1977;176:575–587. doi: 10.1002/cne.901760408. [DOI] [PubMed] [Google Scholar]
- Vanegas H, editor. Comparative neurology of the optic tectum. New York: Plenum; 1984. [Google Scholar]
- Wallace MT, Stein BE. Cross-modal synthesis in the midbrain depends on input from cortex. J Neurophysiol. 1994;71:429–432. doi: 10.1152/jn.1994.71.1.429. [DOI] [PubMed] [Google Scholar]
- Wallace MT, Meredith MA, Stein BE. Integration of multiple sensory modalities in cat cortex. Exp Brain Res. 1992;91:484–488. doi: 10.1007/BF00227844. [DOI] [PubMed] [Google Scholar]
- Wallace MT, Meredith MA, Stein BE. Multisensory integration in the superior colliculus of the alert cat. J Neurophysiol. 1998;80:1006–1010. doi: 10.1152/jn.1998.80.2.1006. [DOI] [PubMed] [Google Scholar]
- Wurtz RH, Albano JE. Visual-motor function of the primate superior colliculus. Annu Rev Neurosci. 1980;3:189–226. doi: 10.1146/annurev.ne.03.030180.001201. [DOI] [PubMed] [Google Scholar]
- Xing D, Yeh CI, Shapley RM. Spatial spread of the local field potential and its laminar variation in visual cortex. J Neurosci. 2009;29:11540–11549. doi: 10.1523/JNEUROSCI.2573-09.2009. [DOI] [PMC free article] [PubMed] [Google Scholar]