

Abstract
Changes in spatial distribution of mosquitoes over time in a Sahelian village were studied to understand the sources of the mosquitoes during the dry season when no larval sites are found. At that time, the sources of Anopheles gambiae Giles may be local shelters used by aestivating mosquitoes or migrants from distant populations. The mosquito distribution was more aggregated during the dry season, when few houses had densities 7- to 24-fold higher than expected. The high-density houses during the dry season differed from those of the wet season. Most high-density houses during the dry season changed between years, yet their vicinity was rather stable. Scan statistics confirmed the presence of one or two adjacent hotspots in the dry season, usually found on one edge of the village. These hotspots shifted between the early and late dry season. During the wet season, the hotspots were relatively stable near the main larval site. The locations of the hotspots in the wet season and early and late dry season were similar between years. Season-specific, stable, and focal hotspots are inconsistent with the predictions based on the arrival of migrants from distant localities during the dry season, but are consistent with the predictions based on local shelters used by aestivating mosquitoes. Targeting hotspots in Sahelian villages for vector control may not be effective because the degree of aggregation is moderate, the hotspots are not easily predicted, and they are not the sources of the population. However, targeting the dry-season shelters may be highly cost-effective, once they can be identified and predicted.
Keywords: spatial aggregation, dry-season diapause, hotspot, malaria, long-distance migration
In recent years, malaria-control efforts (mostly by insecticide-treated nets, indoor spray, and improved patient care) have expanded, and malaria-related mortality in sub-Saharan Africa has fallen by 33% (WHO 2012). Yet >550,000 deaths per year are estimated to occur in sub-Saharan Africa alone, reflecting the immensity of the problem and the need for new control strategies. In Africa, the mosquito Anopheles gambiae Giles is the principal vector of the disease. A. gambiae s.l. is a complex of seven species, with A. gambiae s.s. and Anopheles arabiensis Patton being the most widespread and common malaria vectors across the continent (Davidson 1964a,b; Coluzzi et al. 1979; Coluzzi et al. 1985). A. gambiae s.s. is divided into two incipient species, known as the M and S molecular forms, which are sympatric in West and Central Africa (della Torre et al. 2002, 2005; Lehmann and Diabate 2008; Reidenbach et al. 2012; Weetman et al. 2012). In the Sahel, malaria is markedly seasonal, with intense transmission occurring during the late wet season and almost none during the dry season. This seasonality reflects the availability of suitable larval sites for mosquitoes, which usually is rain-dependent (Amek et al. 2012, Dia et al. 2003, Fontenille et al. 1997a, Gillies and De Meillon 1968, Oesterholt et al. 2006). The extremely low density of mosquitoes during the dry season greatly challenges studies on their dry-season biology.
Under typical (wet-season) conditions, adult life span is shorter than 2 months, and eggs, larvae, and pupae survive desiccation for <2 wk (Beier et al. 1990, Gillies and De Meillon 1968, Koenraadt et al. 2003, Lehmann and Diabate 2008, Yaro et al. 2006). Therefore, no mosquitoes should survive the long dry season in the Sahel (and similar regions), where larval sites are not available for >5 months. The rapid appearance of mosquitoes after the first rains suggests a form of dormancy or long-distance migration (Lehmann et al. 2010), consistent with population genetic inferences (Donnelly et al. 2002, Lehmann et al. 1998, Simard et al. 2000). Recent evidence suggests that the M form of A. gambiae persists in the West African Sahel as aestivating adults, that is, summer diapause (Adamou et al. 2011; Huestis et al. 2011, 2012; Lehmann et al. 2010; Yaro et al. 2012), supporting previous studies with similar assertions (Holstein 1954; Omer and Cloudsley–Thompson 1968, 1970). The S forms of A. gambiae and A. arabiensis, however, probably persist through the dry season via long-distance migration (Adamou et al. 2011). Finding the sources of mosquitoes in the dry season (and immediately after the first rains) remains the key obstacle to studying many facets of their dry-season biology. Targeting mosquitoes in these sources during the dry season has immense potential to reduce malaria transmission in the subsequent wet season (Adamou et al. 2011, Sogoba et al. 2007).
At the village scale, studies have shown that mosquitoes were clustered rather than uniformly or randomly distributed, and that proximity of houses to the main larval sites is the primary factor that explained high-density areas (Carter et al. 2000, Githeko et al. 2006, Kamdem et al. 2012, Oesterholt et al. 2006, Ribeiro et al. 1996, Smith et al. 1995, Staedke et al. 2003). For example, after the end of the rainy season (October), density of mosquitoes in the Malian village Bancoumana quickly falls to near zero (December) with the disappearance of larval sites. However, during the same period, <2 km away in the hamlets of fishermen along the Niger river, density increases as new and productive larval sites are formed by the receding river (Sogoba et al. 2007). This and other studies (cited earlier) have established that high-density areas at the village scale reflect proximity to the local sources of mosquitoes.
Despite the total absence of larval sites around Sahelian villages throughout the dry season, few A. gambiae can be found indoors, at a density near 0.04 per house (Adamou et al. 2011, Lehmann et al. 2010). The sources of those A. gambiae mosquitoes are thought to be local shelters found near the villages, which are used by aestivating mosquitoes (Adamou et al. 2011, Lehmann et al. 2010, Yaro et al. 2012). Alternatively, these sources may be distant populations, possibly hundreds of kilometers away, where breeding occurs year-round and from which winds help transport mosquitoes into the Sahel, as is the case for many other insects during favorable conditions typically associated with the monsoon rains (Chapman et al. 2004a, Reynolds et al. 2010). Here, the seasonal changes in the spatial distribution of A. gambiae in a Sahelian village were analyzed in an attempt to assess if the sources of mosquitoes during the dry season are local or distant. Thus, if the sources of the mosquitoes are few local shelters, it is predicted that dry-season-specific clusters or hotspots would be located closest to these shelters (Table 1). However, if mosquitoes are arriving to the village carried by the jet stream (over 100 m above ground), they would descend into different houses and are unlikely to form hotspots. Even if they would form hotspots during a particular migration event (weather-dependent), these hotspots would vary between immigration events, reflecting changes in local and regional winds (number 4, Table 1). Although these are the most fundamental hypotheses, certain findings may be helpful to further assess if local sources are stable over the dry season or ephemeral, and if they are numerous and spread out or rather few (Table 1). Resolution among these scenarios depends on the assumption that proximity to the population sources (the larval sites in previous studies) is the primary factor determining hotspot locations rather than unique house factors such as a particular structural design, as previously reported (Carter et al. 2000, Githeko et al. 2006, Kamdem et al. 2012, Oesterholt et al. 2006, Ribeiro et al. 1996, Smith et al. 1995, Staedke et al. 2003). Because no surface waters exist in the dry season around the focal village, the sources of the population should change between the wet and dry seasons. Thus, a prerequisite for this approach is to confirm the hypothesis that the hotspots are season-specific (assuming it is improbable that the dry-season shelters are identical to wet-season larval sites). Accordingly, if the sources of the mosquitoes during the dry season are few stable and local shelters, then it is predicted that dry-season-specific hotspots would be located close to these shelters (number 1, Table 1). If only few shelters are used but they change over the dry season, then the hotspots should shift accordingly (number 2, Table 1). However, if numerous local shelters are scattered over the area, no hot-spots will be detected because the sources are near most houses (number 3, Table 1).
Table 1. Possible sources of mosquitoes during the dry season (DS) and their predicted spatial distribution.
| Mosquito sourcesa | Predicted temporal spatial distribution pattern |
|---|---|
| 1. Local shelters–few, stable | Few uniquely DS hotspots, constant throughout the DS |
| 2. Local shelters–few, changing | Few uniquely DS hotspots, changing during the DS |
| 3. Local shelters–many (changing or stable) | No DS hotspots, or very low-intensity hotspots and changing |
| 4. Distant populations (>50 km), mosquitoes use low jet stream above the atmospheric boundary layer (<100 m above ground) or through passive transportation | No DS hotspots, or hotspots that change between migration events |
The key distinction is between local shelters (Hypotheses 1–3) and distant populations (Hypothesis 4). According to 4, mosquitoes engage in long-range dispersal, flying in the nocturnal lower jet stream at altitudes over 100 m above ground (Chapman et al. 2004b, 2011).
Using indoor density across all houses of the Sahelian village Thierola, collected over 5 yr, the spatial distribution of A. gambiae was evaluated to determine if it was uniform, random, or clumped and if the degree of spatial aggregation varied between seasons. Whether houses harboring a disproportionately high fraction of the population in the dry season were the same houses throughout the wet season was also evaluated. Finally, scan statistics were used to define, geographically and statistically, hotspots (and cold spots) in weekly intervals throughout the study period. The temporal variation in the hotspots distributions was evaluated in light of the predictions of the scenarios presented earlier.
Materials and Methods
The study was performed between September 2008 and March 2013 in Thierola (13.6583° N and ‒7.2155° W), a small rural village in the Malian Sahel (≈300 inhabitants living in 130 houses). Thierola is separated by 3 km from the nearest village (Zanga), and 6 km from the next-closest village (Bako). The Bambara ethnic group (≈80% of the population) lives in the main neighborhood of the village in rectangular mud-brick mud-roof houses in adjacent compounds. The Fulani ethnic group (≈20% of the population) is organized in five family compounds (hamlets) separated by ≈200 m from each other, along an arc ≈500 m southeast of the main village. The houses in the Fulani compounds include circular mud-brick and thatchedroof houses and some rectangular houses as mentioned earlier. Virtually all houses where people sleep have one and sometimes two insecticide-impregnated bednets that are deployed during the wet season. Bednets are rarely deployed during the dry season. No other insecticides or repellents are used in this community. Residential houses belong to 18 family compounds. A few public buildings include a mosque, a school, and a laboratory. Global positioning system (GPS) coordinates of each building in the study area were measured 2 m in front of its door by using a Garmin GPSMAP 62s unit (Garmin International Inc., Olathe, KS) and were assigned by averaging 10 consecutive readings. Accuracy of the positions is presumably within 5 m (analysis was done on decimal degrees values rounded to the fifth decimal place). In total, 150 houses were included, but some were destroyed and new ones were built during the 5-yr study period. The community grows millet, sorghum, maize (corn), and peanuts during the rainy season (June– September). Cattle, sheep, goats, guineafowl, and chickens are raised by most families. The rains fill two large ponds and many small puddles. The small puddles dry within 10 d after the last rain (October), and usually all surface waters dry by December. From November until May, rainfall is altogether absent or negligible (monthly precipitation <25 mm). After the harvest (October–November), the fields surrounding the village lay bare. Water is only available in four deep wells (≈30 m deep). Annual precipitation is ≈500 mm (513 mm in Segou, which lies 30 km south and 100 km east of Thierola). Weather data including wind direction and speed were measured by using PortLog Weather Station (Rainwise, Inc., Bar Harbor, ME) and recorded every 30 min in Thierola between March and March 2013. The natural vegetation consists of grasses, shrubs, and scattered trees (e.g., baobab, Shea tree, Acacia spp., etc.). For this study, the dry season refers to January–May and the wet season refers to July–October. The transition periods (June and November–December) are marked by climatic irregularity (surface water may or may not be available) and by unknown population composition with respect to aestivation and migration status. Unless otherwise stated, the transition periods were excluded from analyses. Here, a year is defined as the period spanning from the first rain (June) to the end of the following dry season (May).
Mosquito Collection
Live collection by using mouth aspirators inside all houses (n ≈ 130, including abandoned houses, and those used as kitchens, storage areas, or animal shelter) was conducted every day (dry season) or every other day (wet season) for 2 wk per month. Each house was visited by two trained collectors, both searching for mosquitoes for 10–15 min (and until no mosquitoes were collected for 3–5 min). The same collectors were used throughout the study, but individual collectors rotated between houses. Several houses (5–10) were randomly selected to be double-checked by independent collectors to assess the quality of the collection. During certain periods (e.g., wet season of 2008 and 2009 and dry season of 2010), collected mosquitoes were released ≈1 h after sunset the day of collection, ≈5 m away from the house they were collected in. During other periods, mosquitoes were not released after capture but used for various experiments (reported separately). Because the recapture rate was rather low (<3%), the effect of releasing mosquitoes is assumed to be negligible. Removal of mosquitoes might have reduced the density the next day when sampling was conducted on sequential days. However, all houses were subjected to this treatment, thus eliminating bias.
Statistical Analysis
Following Ribeiro et al. (1996), the degree of spatial aggregation was evaluated by using Taylor's law (Taylor 1961, Taylor et al. 1978) and Iwao's mean crowding over density regression (Iwao 1968), by using the daily mean of the number of mosquitoes per house and its variance. These tests are based on whether the regression coefficient (slope) is greater than one (reflecting equal variance and mean as expected under random distribution). Because aggregation also depends on density, seasonal comparison of aggregation may be confounded by high density during the wet season and low density during the dry season. To minimize this effect, aggregation of the dry and wet seasons was compared after restricting the range of mean density to between 0.035 and 0.7 mosquitoes per house. Theoretically, aggregation can be measured with at least two mosquitoes in the village, but in reality, a larger number is required so two or more mosquitoes would be found in the same house if population is aggregated. Accordingly, aggregation was compared only if the total daily sample was at least four mosquitoes in 120 houses (=0.035 mosquitoes per house). The upper range (0.7 mosquitoes per house) was set based on the highest values observed during the dry season (except during the 3–5 d of the early April peak, see later in the text). To assess whether house density persisted over time, the fraction of mosquitoes harbored by every house was used to accommodate the differences in density. Further, to avoid small sample size effect, daily totals of <20 mosquitoes (collected over all ≈130 houses of the village) were pooled with consecutive dates to achieve a minimum of 20 mosquitoes per period.
Geospatial analysis aimed at defining the presence and locations of high- and low-density clusters (hot-spots and cold spots) was carried out by using SatScan 9.0 (Kulldorff and Nagarwalla 1995). Tests of significance of the clusters detected by this software accommodate the layout of the village and do not require homogenous sampling (equal interval between sampling positions). The approach used by SatScan is based on scanning the study area by using circular windows of different diameters that are randomly placed (centered) over the study area, including over all positions of the sampling units (buildings). The diameters range from a single sampling unit (diameter = 0) to half the length of the area's size. It then calculates the likelihood of observing that density given expectations based on homogenous density across the whole area. By maximizing (and minimizing) the ratios of the observed and expected density for each circle, the algorithm identifies possible clusters by their position in space and tests their significance based on log likelihood ratio tests and Monte Carlo simulations (Kulldorff and Nagarwalla 1995, Kulldorff et al. 1997). SatScan accounts for multiple tests based on the sequential Bonferroni approach. The input data included the weekly total of A. gambiae collected per house, considering mosquitoes in a house as “cases” in the Bernoulli model (Kulldorff and Nagarwalla 1995, Kulldorff et al. 1997, Porcasi et al. 2006). Buildings that served only as kitchens and those few that were not available for regular collection were excluded. During the wet season, up to 3 sampling days per week were pooled, whereas up to 7 sampling days per week were pooled during the dry season. Periods with low density during the dry season (weekly total <0.1 mosquitoes per house) were rather common and often yielded insignificant clusters.
Results
Between September 2008 and March 2013, 37,447 A. gambiae s.l. were collected indoors during 428 collection days in Thierola. Density of A. gambiae in Thierola, defined as the number of mosquitoes per house, varied over 100-fold between the wet (July–October) and dry (January–May) seasons (Fig. 1), consistent with previous studies (Fontenille et al. 1997a,b; Toure et al. 1994, 1996). Thus, house density of A. gambiae s.l. peaked in September (2.6 and 1.1 for females and males, respectively) and reached its minima in February (0.023 and 0.008 for females and males, respectively). Whole-village collections on a (nearly) daily basis throughout the dry season revealed that density surged for 3–7 d in early April, reaching levels 10- to 100-fold higher than normal, and then returned to typical low density, as previously described (Adamou et al. 2011). The peak represents an anomaly in the long dry season, which being so brief is difficult to sample and represent as a distinct phase. Notably, the April peak was observed in 4 yr (2010–2013) with no “mango rains” (occasional light rains that fall in March in some years but seldom provide enough surface water to allow complete development of mosquito larvae) over the whole region. Because the April peak reflects an extreme outlier in the dry season and the origin of these mosquitoes is unknown (i.e., they could be long-distance migrants and/or aestivators that emerged to replenish reserves or end their aestivation; see Adamou et al. 2011 and Huestis et al. 2012 for a discussion), these days in early April were excluded from seasonal analysis, unless otherwise indicated.
Fig. 1.
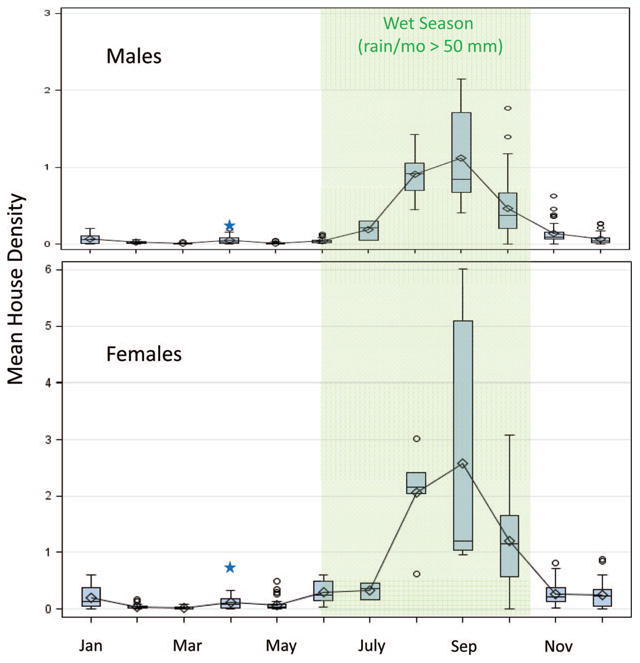
Monthly mean house density of indoor-resting Anopheles gambiae s.l. males (top) and females (bottom) based on data from September 2008 to December 2012. Shading signifies the wet season and stars denote mean density if April-peak days been included (see text for details). (Online figure in color.)
Seasonal Variation in Clustering
Taylor's power law and Iwao's regression test revealed that mosquito distribution in Thierola was clustered rather than uniform or random because the variance was larger than the mean (steeper regression lines compared with that expected based on random distribution, i.e., variance equal to the mean). This was the case for both male and female A. gambiae (Supp. Fig. 1 [online only]; April peak included). Notably, aggregation increased during the dry season and was driven by females (Table 2; Fig. 2), as the steeper regression lines indicated. The higher crowding during the dry season was probably not because of the different density range between seasons because this comparison was performed after restricting the mean density to between 0.035 and 0.7 mosquitoes per house to maximize the overlap of density range across season. The median fraction of houses that harbored 50% of mosquitoes in the dry season was 4%, as opposed to 9% in the wet season (P < 0.0001, Nwet = 84, Ndry = 131, Stat = 74, median test). Nonetheless, higher clustering over the dry season may reflect both increased aggregation and the lower density in the dry season.
Table 2. Seasonal variation in clustering of A. gambiae (September 2008–December 2012).
| Dependent | Source | Femalesa | Malesa | ||||||
|---|---|---|---|---|---|---|---|---|---|
|
|
|
||||||||
| df | F (MS)b | P | Wet/dryc | df | F (MS)b | P | Wet/dryc | ||
| Taylord Log(Var) | Model | 3 | 575 (85) | 0.0001 | (R2= 90%) | 3 | 1,014 (92) | 0.0001 | (R2= 94%) |
| Error | 186 | (0.15) | 181 | (0.09) | |||||
| Season | 1 | 11.7 (1.7) | 0.0008 | 1.09/1.55 | 1 | 3.5 (0.32) | 0.063 | 1.37/1.15 | |
| Ln(Den) | 1 | 1,378 (204) | 0.0001 | — | 1 | 2,525 (229) | 0.0001 | ||
| Season × Ln(Den) | 1 | 4.03 (0.6) | 0.0462 | 1.33/1.48 | 1 | 2.2 (0.2) | 0.136 | 1.41/1.33 | |
| Iwao'sd Crowding | Model | 3 | 41.9 (91.1) | 0.0001 | (R2= 40%) | 3 | 99.8 (61.1) | 0.0001 | (R2 = 62%) |
| Error | 186 | 2.2 | 184 | 0.61 | |||||
| Season | 1 | 2.3 (4.9) | 0.13 | 0.24/–0.43 | 1 | 0.9 (0.2) | 0.5 | 0.1/–0.0 | |
| Density | 1 | 94.7 (205.9) | 0.0001 | — | 1 | 209.3 (128.6) | 0.0001 | — | |
| Season × density | 1 | 19.8 (43.1) | 0.0001 | 3.54/9.40 | 1 | 0.1 (0.007) | 0.9 | 5.4/5.28 | |
Mean density range was restricted between 0.035 and 0.7 per d to compare seasons while minimizing the confounding effect of scale (see Materials and Methods for details).
Denotes mean square (MS).
Regression coefficients for the wet season (July–October) and dry season (January–May) reflect the magnitude of the change in aggregation because of season.
The dependent variables in these analysis of covariance models (estimated by least squares) were Ln(Var) for Taylor power law and crowding for Iwao's regression.
Fig. 2.
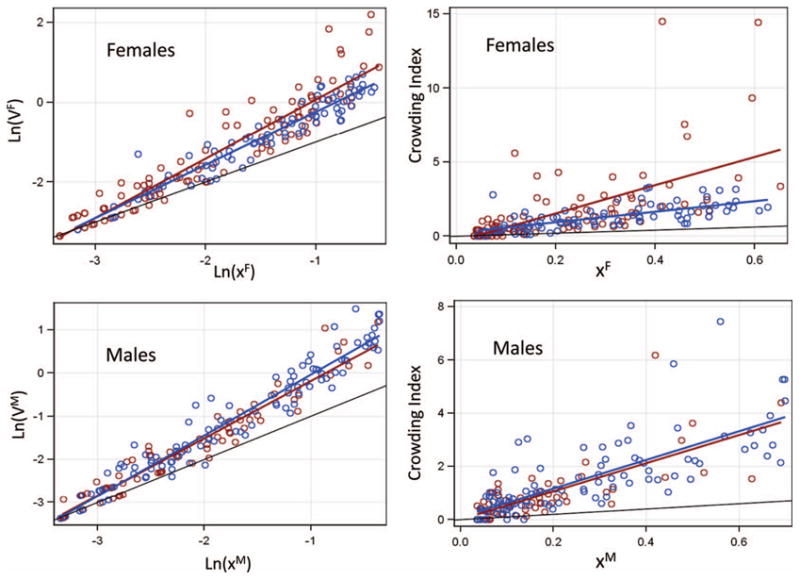
Seasonal difference in the degree of clumping of Anopheles gambiae s.l. females (top) and males (bottom) by using Taylor's power law (left) and Iwao's test (right) to assess overall aggregation in each season. The unity line reflecting equal variance and mean is shown in black. The steeper slope of females in the dry season (red) compared with that of males indicates higher aggregation. See Table 2 for the covariance analyses and the significance of slopes (note difference between scales).
To assess the stability of mosquito house density within and between seasons, the mean and 95% CI of the percentage of mosquitoes collected from each house (that day or the sum of few consecutive collection days if density was low) during the dry and wet season of the same year were plotted for the 25 highest-density houses during the dry season (Fig. 3). Considering an expected value of 0.75% under uniform density (mean number of houses was 133), the relative contribution of high-density houses declined rapidly from peak values (of 6–18%) to 2%, with only 18 (2010) to 28 (2011) houses exceeding 2%, indicating that only handful of houses had an exceptionally high density (7–24 times the expected based on a uniform distribution) and an additional 10–20 houses contributed 3- to 6-fold higher than expected. Importantly, the relative contribution of these high-density houses during the dry season was greater than their corresponding contribution during the wet season of the same year, having only 6 of 26 (2008, P < 0.004, binomial 1-sided test), 3 of 22 (2009, P < 0.0004, binomial 1-sided test), 5 of 18 (2010, P < 0.03, binomial 1-sided test), and 1 of 28 (2011, P < 0.0001, binomial 1-sided test) reversals of this trend (Fig. 3). This suggests that high-density houses in the dry season persisted throughout that season (i.e., most of their dry season's 95% CI is above zero, Fig. 3). However, most of these houses were not high-density houses year-round because the 95% CI of the dry season did not overlap with the same house's CI during the wet season (Fig. 3). Notably, many of the highest-density houses in the dry season were members of the same family compound or of the next-closest compound (Fig. 3). In addition, only one or two of the five highest-density houses during the dry season were the same in 2 or more years (Fig. 3), indicating that exceptionally high-density houses were so because of location rather than design or structure.
Fig. 3.
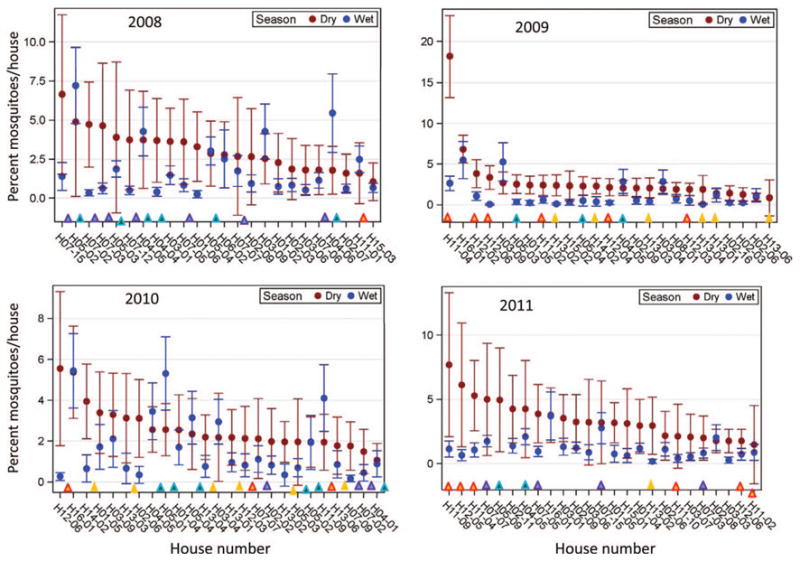
The percentage of mosquitoes collected per house for the highest-density houses during the dry season and corresponding values during the wet season. The mean percentage of the mosquito collection contributed by each house and its 95% CI are shown for the 25 highest-density houses (ranked from highest to lowest) during the dry season. Data for each year are shown separately (note different scales). Four family compound groups with high-density houses are marked in colored triangles above house name (house name consists of the family compound group, followed by the house identification number).
Geographical Variation in Clustering and Its Temporal Variation
High-density houses were identified and statistically tested as hotspots (and cold spots) by using SatScan 9.0, considering the weekly total of mosquitoes in a house as “cases” in the Bernoulli, as described in the Materials and Methods section. The results allowed for determination if clusters persisted within and between seasons as well as between years. Clusters identified by SatScan were tabulated by their family compound and plotted (Figs. 4 and 5), reflecting their statistical significance (accommodating multiple tests within each period) and their intensity, that is, the ratio of observed over expected density in that cluster.
Fig. 4.
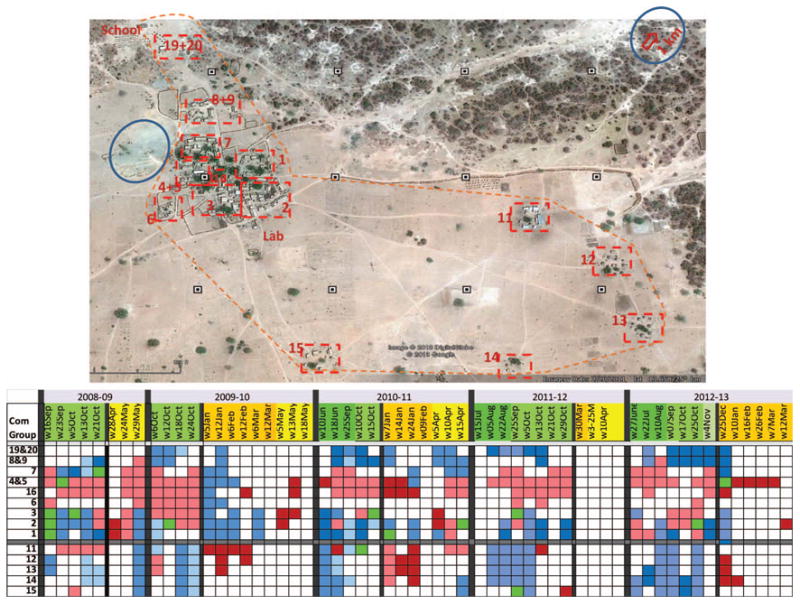
Distribution of hotspots and cold spots and the layout of houses in Thierola. During the study period, ≈130 houses were part of 18 family compounds and few public buildings. House groups, mostly based on family compound, are marked by dotted red rectangles and the numbers correspond to those in the table. Blue circles denote primary larval sites, the dotted orange line denotes periphery of the village, and small black boxes are 200 m apart from each other (scale, note that the N–S axis was compressed to fit the figure dimensions). The table summarizes statistically significant weekly hotspots with an observed density greater than that expected (pink) or greater than twice the expected (dark red). Significant cold spots are shown in light blue and those below 0.5 times the expected value in dark blue. Weekly periods during the early and late wet and dry seasons are shown in dark and light shade of green and yellow, respectively.
Fig. 5.
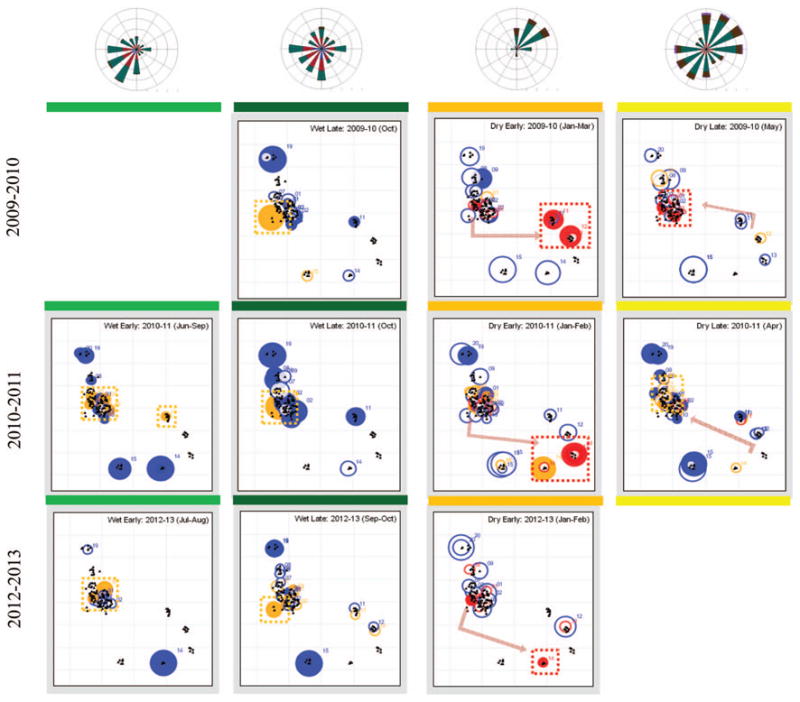
Distribution of hotspots (red and orange circles denote clusters with observed density over 3 times or over 1.5 times the expected density, respectively) and cold spots (in blue denotes clusters with observed density less than half the expected density) in Thierola as determined by SatScan 9.0. Data are not shown for 2008–2009 because of insufficient sampling during the dry season and for 2011–2012 because of low mosquito density that precluded identification of clusters during the dry season (see also Fig. 4 and the text). SigniÞcant clusters (P < 0.05) are shown in filled circles, and clusters that were identified but were not statistically significant (P > 0.05) are shown in empty circles. Numbers denote family compound groups (corresponding to Figs. 3 and 4). Dotted squares indicate where current hotspots were found and arrows indicate the seasonal shift in hotspot from the previous to the current location. Average wind direction (distribution and speed) during the night (1900–0700 hours) are shown by the wind roses in corresponding periods (only data from March 2012 to March 2013 are included).
One or more significant clusters were found in 31 of 38 weekly periods subjected to analysis (Fig. 4). Six of the seven periods without a significant cluster were associated with a very low density (<0.04 per house) in the dry season, indicating diminished statistical power because of low density (Fig. 4). Significant, high-density hotspots (marked by dark red in Fig. 4) whose actual density was over twice that expected were 13 times more common in the dry season. Thus, 28 such hotspots were detected in 23 dry-season weekly periods (1.2 high hotspots per period), whereas only four were detected in 22 wet-season weekly periods (0.09 high hotspots per period). However, low-density clusters (with observed density lower than twice that expected, that is, cold spots) were more frequently detected during the wet season (Fig. 4).
Typically, hotspots (and cold spots) persisted over consecutive periods throughout the wet season, even when intervals between consecutive periods were several weeks long (Fig. 4). Moreover, cold spots and hotspots typically occurred in adjacent family compounds (Figs. 4 and 5), forming hot and cold “zones.” The cold spots in the northern edge of the village persisted year-round (compound groups 19&20 and 8&9, Figs. 4 and 5). Marked changes in the distribution of hotspots (and cold spots) were discerned in the transitions from the wet season to the dry season (Figs. 4 and 5). During the wet season, hot spots were concentrated in the west side of the main “neighborhood,” which was closest to the main larval site—a large pond (up to 100 m in diameter) that retained water until November (Figs. 4 and 5). Cold spots were concentrated in the northern and eastern side of the village including the Fulani hamlets (Figs. 4 and 5). During the early dry season, however, the hotspots were concentrated in the two northeastern hamlets (2009–2010) and in the two adjacent (150 m southward) southeastern hamlets (2010–2011). Moreover, sharp changes in hotspot distribution were also detected between the early and late dry season (Figs. 4 and 5). During the late dry season (April–May), the hot-spots shifted to the western (WSW) edge of the main neighborhood of the village over 600 m westwards from the early dry-season hotspots. The overall changes in hotspot distribution in the early and late dry and wet seasons were rather similar across years (Figs. 4 and 5).
Discussion
Previous studies that evaluated the spatial distribution of mosquitoes at the village level failed to find strong determinants (number of sleepers, roof material, etc.) of high-density area except for proximity to the local sources of the mosquito population, that is, larval sites (Amek et al. 2012; Carter et al. 2000; Githeko et al. 2006; Minakawa et al. 2002; Oesterholt et al. 2006; Ribeiro et al. 1996; Smith et al. 1995; Zhou et al. 2004, 2007). Here, the mosquito spatial distribution during the Sahelian dry season was examined to better understand the sources of the mosquitoes when no larval sites can be found near the village for over 20-km radius (Adamou et al. 2011, Lehmann et al. 2010). At that time, the possible sources of A. gambiae may be local shelters used by aestivating mosquitoes or migrants arriving from distant localities. These sources may be few or numerous and either stable or changing (Table 1). The results of this study, based on nearly 5 yr of indoor surveys in all houses of the Sahelian village Thierola, are helpful to assess the likelihood of the different hypotheses based on the agreement of their predictions with the spatio-temporal patterns of mosquito density. As explained later, these findings provide additional support for the hypothesis that the sources of mosquitoes during the dry season are few local shelters (Adamou et al. 2011; Holstein 1954; Huestis et al. 2012; Lehmann et al. 2010; Omer and Cloudsley–Thompson 1968, 1970; Yaro et al. 2012).
The main findings of this study can be summarized as follows: the spatial distribution of A. gambiae was aggregated throughout the year, but the degree of aggregation increased during the dry season. Only a few houses had an exceptional density (7- to 20-fold higher than expected based on uniform distribution) and an additional 10–20 houses had an elevated density (3- to 6-fold than expected). The high-density houses persisted throughout the season, but were sea-son-specific, that is, the high-density houses during the dry season differed from those of the wet season. Only a few highest-density houses during the dry season persisted across years, yet the hotspots were consistent across years. During every week in the dry season, aggregation manifested itself by one or two adjacent hotspots, each of which typically included 1–10 nearby houses within a 50-m radius, located on one edge of the village. The hotspots (and cold spots) remained relatively stable throughout the wet season, but shifted between the early and late dry season around mid-March from the eastern to the western side of the village. Finally, the locations of the hotspots within each period (wet season, early and late dry season) were similar between years.
The possibility that hotspots reflect more hospitable houses for mosquitoes would predict that the same houses would be preferred throughout the year, which was not the case. The changes in high-density houses between wet and dry season (as well as during the dry season) agree with the concomitant change in the sources of the population. During the wet season, until the last larval site dried up (November–December), the hotspots (compound groups 4–7 and 16) were located near the main pond, whereas the hamlets represented cold spots (the occasional exception was compound 11, which was the closest to a distant larval site 1.1 km away, Fig. 4). However, during January and February, when no surface waters could be found around the village (despite repeated and extensive surveys aided by dozens of local herders and hunters for over 20-km radius), the hotspots shifted to the hamlets. In addition, house structure (rectangular vs. circular), roof type (thatch, mostly mud, or metal), house age, size, the typical number of people who sleep there, duration doors and windows were kept open, the length of the cracks in the walls, the number of rodent burrows, and the extent of termite infestation (as well as distance from the toilet and the nearest tree, number of wood piles nearby, etc.) failed to explain mosquito density during the early dry season (evaluated during January–February 2009; not shown). The lack of association between house-specific factors and dry-season density provided additional indirect support for the hypothesis that proximity to the sources (shelters during the dry seasons, respectively) is the main factor underlying house density. Nonetheless, extensive searches around the hotspots and beyond have failed to uncover such shelters (T. L. et al., unpublished data).
Finding stable, focal, and season-specific hotspots during the dry season is inconsistent with the arrival of migrants from distant populations (Hypothesis 4 in Table 1), because such migrants, carried by winds at altitudes over 100 m above ground over many kilometers (>100), would enter different houses, generating a random distribution and/or hypervariable hot-spots reflecting independent episodes of long-distance migration. Mosquitoes, as well as many other insect species ranging from tiny Culicoides spp. to large noctuid moths, use the nocturnal lower jet stream over the atmospheric boundary layer to migrate hundreds to thousands of kilometers (Chapman et al. 2004b, 2011; Reynolds et al. 1996). Although unstable, the wind direction during the dry season is primarily from the northeast and during the wet season it shifts to the southwest (not shown). If mosquitoes fly downwind (or even upwind), the corresponding corners of the village are predicted to be the sites of the hotspots. However, the actual hotspots during the dry season were on the eastern (early dry season) or the western (late dry season) edges. The possibility of passive migration by vehicles is unlikely because transportation between villages is based on motorcycles, bicycles, and donkey carts, which are not suitable transport vehicles. Less than two cars per day travel to this and nearby villages during daytime, when mosquitoes avoid flying, and the hotspots are not close to the dirt roads used by these vehicles. Therefore, the hypothesis that distant migrants are the source of the mosquitoes during the dry season (Hypothesis 4 in Table 1) is inconsistent with these findings.
Importantly, if hotspots were detected during the dry season, only one or two adjacent hotspots were found each week. These hotspots persisted week after week for at least 2 mo during the early or late dry season, providing evidence against the existence of many local shelters either changing or stable (Hypothesis 3, Table 1). That the dry season hotspots were located at the edge rather than the center of village suggests that the sources of the population are external to the village perimeter. During the dry season, the hotspot(s) were located on the edge of the village, yet they were focal rather than an extended “border.” They encompassed only 5–12% of the perimeter (2.2 km connecting all “vertices” formed by the external houses of the village, Fig. 4). Further, some of the adjacent edge houses were a part of cold spots. Finding focal edge hotspots implies that mosquitoes arriving from their sources do not fan over an extensive area, and therefore suggests that the distance of the dry-season sources is rather small, probably within a 5-km range. Finding one or two focal, dry-season-specific, relatively stable hotspots is consistent with few local sources that persist for approximately half the dry season and then, surprisingly, change (Hypotheses 1 and 2, Table 1). The relative stability of the dry-season hotspots between years suggests that the sources are associated with a relatively permanent environmental feature. Whether this represents underground spaces, certain trees, or another biotic or abiotic feature may be uncovered in future studies.
The composition of A. gambiae in the region was previously described in detail (Coluzzi et al. 1985; Toure et al. 1994,1996) including samples used in this analysis (Huestis et al. 2011, 2012; Lehmann et al. 2010; Yaro et al. 2012). These studies showed that between December and July, the M form of A. gambiae predominates (>95%), whereas the S form and A. arabiensis reach nearly equal fractions with the M form by early October and then predominate from late October to November (Adamou et al. 2011; Huestis et al. 2011, 2012; Lehmann et al. 2010; Yaro et al. 2012). Therefore, all the dry-season data as well as the early wet-season data pertain exclusively to the M form of A. gambiae, whereas the late wet-season data represent the three taxa in variable composition as that period unfolds. There is no indication for change in spatial aggregation between early and late wet season, suggesting that the change in species and form composition is unlikely to affect the seasonal change observed between wet and dry season. However, we cannot rule out that during the time of co-existence (late wet season), the dispersion of these taxa among the houses does not differ.
Mosquito control targeting the hotspots in a village such as Thierola during the wet season may not be very effective, because the degree of aggregation is mild and the hotspots are not predicted easily, beyond being close to the main larval sites. Although the degree of aggregation increases over the dry season, predicting the hotspots without longitudinal studies is challenging. Moreover, targeting only hotspots not only misses the true sources of the population, but may shift the hotspots, if mosquitoes are deterred by the treatment. Taken together with previous studies (Adamou et al. 2011; Holstein 1954; Huestis et al. 2012; Lehmann et al. 2010; Omer and Cloudsley–Thompson 1968, 1970; Yaro et al. 2012), these results provide compelling evidence for aestivation of the M form A. gambiae in local shelters in the Sahel. Therefore, targeting the mosquitoes in their sources, especially during the dry season, may be highly cost-effective because the M form is presumably the key in the early amplification of malaria transmission that culminates in the peak transmission at the end of the wet season (Adamou et al. 2011). However, this will require identifying the hidden shelters of the malaria mosquitoes during the Sahelian dry season.
Supplementary Material
Acknowledgments
We thank the villagers in Thierola for their hospitality and assistance with mosquito collections; Dia Elnaiem, José Ribeiro, Nafo Sogoba, Zhijian (Jake) Tu, and Mike Levy for their helpful comments on previous versions of this manuscript; and Cheick Traore, Richard Sakai, Robert Gwadz, and Thomas Wellems for logistical support. This study was supported by the Division of Intramural Research, National Institute of Allergy and Infectious Diseases, National Institutes of Health.
References Cited
- Adamou A, Dao A, Timbine S, Kassogue Y, Yaro AS, Diallo M, Traore SF, Huestis DL, Lehmann T. The contribution of aestivating mosquitoes to the persistence of Anopheles gambiae in the Sahel. Malar J. 2011;10:151. doi: 10.1186/1475-2875-10-151. [DOI] [PMC free article] [PubMed] [Google Scholar]
- Amek N, Bayoh N, Hamel M, Lindblade KA, Gimnig JE, Odhiambo F, Laserson KF, Slutsker L, Smith T, Vounatsou P. Spatial and temporal dynamics of malaria transmission in rural Western Kenya. Parasit Vectors. 2012;5:86. doi: 10.1186/1756-3305-5-86. [DOI] [PMC free article] [PubMed] [Google Scholar]
- Beier JC, Copeland RS, Oyaro C, Masinya A, Odago WO, Odour S, Koech DK, Roberts CR. Anopheles gambiae complex egg stage survival in dry soil from larval development sites in western Kenya. J Am Mosq Control Assoc. 1990;6:105–109. [PubMed] [Google Scholar]
- Carter R, Mendis KN, Roberts D. Spatial targeting of interventions against malaria. Bull WHO. 2000;78:1401–1411. [PMC free article] [PubMed] [Google Scholar]
- Chapman JW, Reynolds DR, Smith AD. Migratory and foraging movements in beneficial insects: a review of radar monitoring and tracking methods. Int J Pest Manag. 2004a;50:225–232. [Google Scholar]
- Chapman JW, Reynolds DR, Smith AD, Smith ET, Woiwod IP. An aerial netting study of insects migrating at high altitude over England. Bull Entomol Res. 2004b;94:123–136. doi: 10.1079/ber2004287. [DOI] [PubMed] [Google Scholar]
- Chapman JW, Drake VA, Reynolds DR. Recent insights from radar studies of insect flight. Ann Rev Entomol. 2011;56:337–356. doi: 10.1146/annurev-ento-120709-144820. [DOI] [PubMed] [Google Scholar]
- Coluzzi M, Sabatini A, Petrarca V, Di Deco MA. Chromosomal differentiation and adaptation to human environments in the Anopheles gambiae complex. Trans R Soc Trop Med Hyg. 1979;73:483–497. doi: 10.1016/0035-9203(79)90036-1. [DOI] [PubMed] [Google Scholar]
- Coluzzi M, Petrarca V, Di Deco MA. Chromosomal inversion intergradation and incipient speciation in Anopheles gambiae. Bollettino di Zoologia. 1985;52:45–63. [Google Scholar]
- Davidson G. Anopheles gambiae, a complex of species. Bull WHO. 1964a;31:625–634. [PMC free article] [PubMed] [Google Scholar]
- Davidson G. The five mating-types in the Anopheles gambiae complex. Riv Malariol. 1964b;43:167–183. [PubMed] [Google Scholar]
- della Torre A, Costantini C, Besansky NJ, Caccone A, Petrarca V, Powell JR, Coluzzi M. Speciation within Anopheles gambiae: the glass is half full. Science. 2002;298:115–117. doi: 10.1126/science.1078170. [DOI] [PubMed] [Google Scholar]
- della Torre A, Tu Z, Petrarca V. On the distribution and genetic differentiation of Anopheles gambiae s.s. molecular forms. Insect Biochem Mol Biol. 2005;35:755–769. doi: 10.1016/j.ibmb.2005.02.006. [DOI] [PubMed] [Google Scholar]
- Dia I, Diop T, Rakotoarivony I, Kengne P, Fontenille D. Bionomics of Anopheles gambiae Giles, An. arabiensis Patton, An. funestus Giles and An. nili (Theobald) (Diptera: Culicidae) and transmission of Plasmodium falciparum in a Sudano–Guinean zone (Ngari, Senegal) J Med Entomol. 2003;40:279–283. doi: 10.1603/0022-2585-40.3.279. [DOI] [PubMed] [Google Scholar]
- Donnelly MJ, Simard F, Lehmann T. Evolutionary studies of malaria vectors. Trends Parasitol. 2002;18:75–80. doi: 10.1016/s1471-4922(01)02198-5. [DOI] [PubMed] [Google Scholar]
- Fontenille D, Lochouarn L, Diagne N, Sokhna C, Lemasson JJ, Diatta M, Konate L, Faye F, Rogier C, Trape JF. High annual and seasonal variations in malaria transmission by anophelines and vector species composition in Dielmo, a holoendemic area in Senegal. Am J Trop Med Hyg. 1997a;56:247–253. doi: 10.4269/ajtmh.1997.56.247. [DOI] [PubMed] [Google Scholar]
- Fontenille D, Lochouarn L, Diatta M, Sokhna C, Dia I, Diagne N, Lemasson JJ, Ba K, Tall A, Rogier C, et al. Four years' entomological study of the transmission of seasonal malaria in Senegal and the bionomics of Anopheles gambiae and A. arabiensis. Trans R Soc Trop Med Hyg. 1997b;91:647–652. doi: 10.1016/s0035-9203(97)90506-x. [DOI] [PubMed] [Google Scholar]
- Gillies MT, De Meillon B. The Anophelinae of Africa south of the Sahara. 2nd. South African Institute for Medical Research; Johannesburg, South Africa: 1968. [Google Scholar]
- Githeko AK, Ayisi JM, Odada PK, Atieli FK, Ndenga BA, Githure JI, Yan G. Topography and malaria transmission heterogeneity in western Kenya highlands: prospects for focal vector control. Malar J. 2006;5:107. doi: 10.1186/1475-2875-5-107. [DOI] [PMC free article] [PubMed] [Google Scholar]
- Holstein MH. Research in French West Africa. World Health Organization; Geneva, Switzerland: 1954. Biology of Anopheles gambiae. [Google Scholar]
- Huestis DL, Yaro AS, Traore AI, Adamou A, Kassogue Y, Diallo M, Timbine S, Dao A, Lehmann T. Variation in metabolic rate of Anopheles gambiae and A. arabiensis in a Sahelian village. J Exp Biol. 2011;214:2345–2353. doi: 10.1242/jeb.054668. [DOI] [PMC free article] [PubMed] [Google Scholar]
- Huestis DL, Yaro AS, Traore AI, Dieter KL, Nwagbara JI, Bowie AC, Adamou A, Kassogue Y, Diallo M, Timbine S, et al. Seasonal variation in metabolic rate, flight activity and body size of Anopheles gambiae in the Sahel. J Exp Biol. 2012;215:2013–2021. doi: 10.1242/jeb.069468. [DOI] [PMC free article] [PubMed] [Google Scholar]
- Iwao S. A new regression method for analyzing the aggregation pattern of animal populations. Res Popul Ecol. 1968;10:1–20. [Google Scholar]
- Kamdem C, Fouet C, Etouna J, Etoa FX, Simard F, Besansky NJ, Costantini C. Spatially explicit analyses of anopheline mosquitoes indoor resting density: implications for malaria control. PLoS ONE. 2012;7:e31843. doi: 10.1371/journal.pone.0031843. [DOI] [PMC free article] [PubMed] [Google Scholar]
- Koenraadt CJ, Paaijmans KP, Githeko AK, Knols BG, Takken W. Egg hatching, larval movement and larval survival of the malaria vector Anopheles gambiae in desiccating habitats. Malar J. 2003;2:20. doi: 10.1186/1475-2875-2-20. [DOI] [PMC free article] [PubMed] [Google Scholar]
- Kulldorff M, Nagarwalla N. Spatial disease clusters: detection and inference. Stat Med. 1995;14:799–810. doi: 10.1002/sim.4780140809. [DOI] [PubMed] [Google Scholar]
- Kulldorff M, Feuer EJ, Miller BA, Freedman LS. Breast cancer clusters in the northeast United States: a geographic analysis. Am J Epidemiol. 1997;146:161–170. doi: 10.1093/oxfordjournals.aje.a009247. [DOI] [PubMed] [Google Scholar]
- Lehmann T, Diabate A. The molecular forms of Anopheles gambiae: a phenotypic perspective. Infect Genet Evol. 2008;8:737–746. doi: 10.1016/j.meegid.2008.06.003. [DOI] [PMC free article] [PubMed] [Google Scholar]
- Lehmann T, Hawley WA, Grebert H, Collins FH. The effective population size of Anopheles gambiae in Kenya: implications for population structure. Mol Biol Evol. 1998;15:264–276. doi: 10.1093/oxfordjournals.molbev.a025923. [DOI] [PubMed] [Google Scholar]
- Lehmann T, Dao A, Yaro AS, Adamou A, Kassogue Y, Diallo M, Sekou T, Coscaron–Arias C. Aestivation of the African Malaria Mosquito, Anopheles gambiae in the Sahel. Am J Trop Med Hyg. 2010;83:601–606. doi: 10.4269/ajtmh.2010.09-0779. [DOI] [PMC free article] [PubMed] [Google Scholar]
- Minakawa N, Seda P, Yan G. Influence of host and larval habitat distribution on the abundance of African malaria vectors in western Kenya. Am J Trop Med Hyg. 2002;67:32–38. doi: 10.4269/ajtmh.2002.67.32. [DOI] [PubMed] [Google Scholar]
- Oesterholt MJ, Bousema JT, Mwerinde OK, Harris C, Lushino P, Masokoto A, Mwerinde H, Mosha FW, Drakeley CJ. Spatial and temporal variation in malaria transmission in a low endemicity area in northern Tanzania. Malar J. 2006;5:98. doi: 10.1186/1475-2875-5-98. [DOI] [PMC free article] [PubMed] [Google Scholar]
- Omer SM, Cloudsley–Thompson JL. Dry season biology of Anopheles gambiae Giles in the Sudan. Nature. 1968;217:879–880. [Google Scholar]
- Omer SM, Cloudsley–Thompson JL. Survival of female Anopheles gambiae Giles through a 9-month dry season in Sudan. Bull WHO. 1970;42:319–330. [PMC free article] [PubMed] [Google Scholar]
- Porcasi X, Catala SS, Hrellac H, Scavuzzo MC, Gorla DE. Infestation of rural houses by Triatoma infestans (Hemiptera: Reduviidae) in southern area of Gran Chaco in Argentina. J Med Entomol. 2006;43:1060–1067. doi: 10.1603/0022-2585(2006)43[1060:iorhbt]2.0.co;2. [DOI] [PubMed] [Google Scholar]
- Reidenbach KR, Neafsey DE, Costantini C, Sagnon N, Simard F, Ragland GJ, Egan SP, Feder JL, Muskavitch MA, Besansky NJ. Patterns of genomic differentiation between ecologically differentiated M and S forms of Anopheles gambiae in West and Central Africa. Genome Biol Evol. 2012;4:1202–1212. doi: 10.1093/gbe/evs095. [DOI] [PMC free article] [PubMed] [Google Scholar]
- Reynolds AM, Reynolds DR, Smith AD, Chapman JW. A single wind-mediated mechanism explains high-altitude ‘non-goal oriented’ headings and layering of nocturnally migrating insects. Proc R Soc B Biol Sci. 2010;277:765–772. doi: 10.1098/rspb.2009.1221. [DOI] [PMC free article] [PubMed] [Google Scholar]
- Reynolds DR, Smith AD, Mukhopadhyay S, Chowdhury AK, De BK, Nath PS, Mondal SK, Das BK, Mukhopadhyay S. Atmospheric transport of mosquitoes in northeast India. Med Vet Entomol. 1996;10:185–186. doi: 10.1111/j.1365-2915.1996.tb00727.x. [DOI] [PubMed] [Google Scholar]
- Ribeiro JMC, Seulu F, Abose T, Kidane G, Teklehaimanot A. Temporal and spatial distribution of anopheline mosquitoes in an Ethiopian village: implications for malaria control strategies. Bull WHO. 1996;74:299–305. [PMC free article] [PubMed] [Google Scholar]
- Simard F, Lehmann T, Lemasson JJ, Diatta M, Fontenille D. Persistence of Anopheles arabiensis during the severe dry season conditions in Senegal: an indirect approach using microsatellite loci. Insect Mol Biol. 2000;9:467–479. doi: 10.1046/j.1365-2583.2000.00210.x. [DOI] [PubMed] [Google Scholar]
- Smith T, Charlwood JD, Takken W, Tanner M, Spiegelhalter DJ. Mapping the densities of malaria vectors within a single village. Acta Trop. 1995;59:1–18. doi: 10.1016/0001-706x(94)00082-c. [DOI] [PubMed] [Google Scholar]
- Sogoba N, Doumbia S, Vounatsou P, Baber I, Keita M, Maiga M, Traore SF, Toure A, Dolo G, Smith T, et al. Monitoring of larval habitats and mosquito densities in the Sudan savanna of Mali: implications for malaria vector control. Am J Trop Med Hyg. 2007;77:82–88. [PubMed] [Google Scholar]
- Staedke SG, Nottingham EW, Cox J, Kamya MR, Rosenthal PJ, Dorsey G. Short report: proximity to mosquito breeding sites as a risk factor for clinical malaria episodes in an urban cohort of Ugandan children. Am J Trop Med Hyg. 2003;69:244–246. [PubMed] [Google Scholar]
- Taylor LR. Aggregation, variance and the mean. Nature. 1961;189:732–735. [Google Scholar]
- Taylor LR, Woiwod IP, Perry JN. The density dependence of spatial behaviour and the rarity of randomness. J Anim Ecol. 1978;47:383–406. [Google Scholar]
- Toure YT, Petrarca V, Traore SF, Coulibaly A, Maiga HM, Sankare O, Sow M, Di Deco MA, Coluzzi M. Ecological genetic studies in the chromosomal form Mopti of Anopheles gambiae s. s. in Mali. Vol. 94. West Africa Genetica: 1994. pp. 213–223. [DOI] [PubMed] [Google Scholar]
- Toure YT, Traore SF, Sankare O, Sow MY, Coulibaly A, Esposito F, Petrarca V. Perennial transmission of malaria by the Anopheles gambiae complex in a north Sudan Savanna area of Mali. Med Vet Entomol. 1996;10:197–199. doi: 10.1111/j.1365-2915.1996.tb00731.x. [DOI] [PubMed] [Google Scholar]
- Weetman D, Wilding CS, Steen K, Pinto J, Donnelly MJ. Gene flow-dependent genomic divergence between Anopheles gambiae M and S forms. Mol Biol Evol. 2012;29:279–291. doi: 10.1093/molbev/msr199. [DOI] [PMC free article] [PubMed] [Google Scholar]
- WHO (World Health Organization) World malaria report. WHO; Geneva, Switzerland: 2012. p. 195. [Google Scholar]
- Yaro AS, Dao A, Adamou A, Crawford JE, Ribeiro JM, Gwadz R, Traore SF, Lehmann T. The distribution of hatching time in Anopheles gambiae. Malar J. 2006;5:19. doi: 10.1186/1475-2875-5-19. [DOI] [PMC free article] [PubMed] [Google Scholar]
- Yaro AS, Traore AI, Huestis DL, Adamou A, Timbine S, Kassogue Y, Diallo M, Dao A, Traore SF, Lehmann T. Dry season reproductive depression of Anopheles gambiae in the Sahel. J Insect Physiol. 2012;58:1050–1059. doi: 10.1016/j.jinsphys.2012.04.002. [DOI] [PMC free article] [PubMed] [Google Scholar]
- Zhou G, Minakawa N, Githeko A, Yan G. Spatial distribution patterns of malaria vectors and sample size determination in spatially heterogeneous environments: a case study in the west Kenyan highland. J Med Entomol. 2004;41:1001–1009. doi: 10.1603/0022-2585-41.6.1001. [DOI] [PubMed] [Google Scholar]
- Zhou G, Munga S, Minakawa N, Githeko AK, Yan G. Spatial relationship between adult malaria vector abundance and environmental factors in western Kenya highlands. Am J Trop Med Hyg. 2007;77:29–35. [PubMed] [Google Scholar]
Associated Data
This section collects any data citations, data availability statements, or supplementary materials included in this article.