Abstract
We describe a closed-form approach for performing a Kramers–Kronig (KK) transform that can be used to rapidly and reliably retrieve the phase, and thus the resonant imaginary component, from a broadband coherent anti-Stokes Raman scattering (CARS) spectrum with a nonflat background. In this approach we transform the frequency-domain data to the time domain, perform an operation that ensures a causality criterion is met, then transform back to the frequency domain. The fact that this method handles causality in the time domain allows us to conveniently account for spectrally varying nonresonant background from CARS as a response function with a finite rise time. A phase error accompanies KK transform of data with finite frequency range. In examples shown here, that phase error leads to small (<1%) errors in the retrieved resonant spectra.
As is the case for many spectroscopic methods, knowledge of the signal modulus |χ(ω)| and phase φ(ω) is required to extract full information from a coherent anti-Stokes Raman scattering (CARS) spectrum. The CARS signal intensity is proportional to the squared modulus of the complex third-order susceptibility, |χ(ω)|2, where χ(ω) contains a resonant (χR) and nonresonant (χNR) part,
| (1) |
The overall CARS intensity as such is not a good candidate for extracting quantitative composition information, because peak intensities are neither strictly linear nor quadratic in analyte concentration, and vibrational resonances in CARS spectra exhibit apparent background-dependent frequency and amplitude shifts owing to the coherent addition of resonant and nonresonant signal contributions. On the other hand, the imaginary part of the CARS susceptibility, Im{χR}, represents the underlying Raman lineshapes and is appropriate for quantitative chemical analysis [1]. Im{χR} can be retrieved from the CARS signal once the spectral phase is known.
The Kramers–Kronig (KK) relation [2] is often used to obtain phase information from the modulus of a susceptibility,
| (2) |
where χ(ω)=|χ(ω)|exp[iφ(ω)], and P is the Cauchy principal value. KK analysis can be appropriate if the response is causal and holomorphic (analytic), as CARS is [3]; however, this type of analysis is strictly valid only if experimental data cover an infinite frequency range. Extrapolation approaches have been devised to deal with a finite data range by approximating the missing data, but these are often difficult to apply [4,5], because ln|χ(ω)|→–∞, as |χ(ω)|→0, which generally occurs as ω→∞. The necessity of extrapolation is obviated using so-called subtractive approaches [6,7], but these depend on prior phase information at chosen anchor points. The requirement for direct integration over an infinite frequency range is avoided in the time domain and Fourier series approaches. Peterson and Knight [8] first derived an efficient alternative form of KK relations based on causality calculations in the time domain, using a Fourier series approach. Johnson [9] and Vartiainen et al.[10] used Fourier series representation to extract real and imaginary parts of the optical response function.
Alternative phase-retrieval approaches have recently been applied to broadband and multiplex CARS microscopy [11–13]. Some of these methods [12,13], based on Fourier transform spectral interferometry [14], are equivalent to performing a KK transform [15]. In these methods the resonant signal is estimated by multiplying the Fourier transform of an approximation to Re[χR(ω)] by the Heaviside function, then transforming back to the frequency domain. This sequence of steps is equivalent, within an additive factor, to the method described by Peterson and Knight [8].
In all the approaches to KK transforms discussed above, the response of interest is assumed explicitly [12,13] or implicitly [8–10] to rise like a step function at t= 0. However, such a step-function response could be realistic only when 1) the impulse triggering the signal is a delta function and 2) either the real and the imaginary component of the signal is entirely conjugate; or, if a nonconjugate part (e.g., a real-only component) does exist, it is spectrally flat. For CARS, none of these conditions are realized in practice; the probe pulse (the impulse triggering the response) typically has a temporal width similar to the Raman response time, and the complex resonant response is accompanied by a real nonresonant response, carrying a frequency-dependent amplitude that reflects the convolution of the pump and Stokes pulses. With the approach described herein, we relax the constraint of step-function signal rise, allowing us to account for the real nonresonant response.
Below we demonstrate how the time-domain representation of the signal can be manipulated to account for nonideality in the CARS response, including a frequency-dependent nonresonant background (NRB). For convenience in developing this idea, we define an operator,
| (3) |
where and denote Fourier transform and inverse Fourier transform, respectively. Based on the convolution theorem, Eq. (3) can be rewritten as
| (4) |
where * denotes convolution. The Fourier transform of the Heaviside function [16] can be expressed as . Substituting into Eq. (4) and writing out the convolution integral explicitly, we obtain
| (5) |
Combining Eqs. (2) and (5), we obtain an expression for the phase as a function of the signal modulus,
| (6) |
Although arrived at in a different way, Eq. (6) is essentially equivalent to the approach of Peterson and Knight [8]. Both approaches deal with causality in the time domain, avoiding many of the difficulties associated with conventional application of KK analysis [17]. The benefit of representation in Eq. (6) is that it can be conveniently used to deal with nonideality directly, in the time domain, as we demonstrate below.
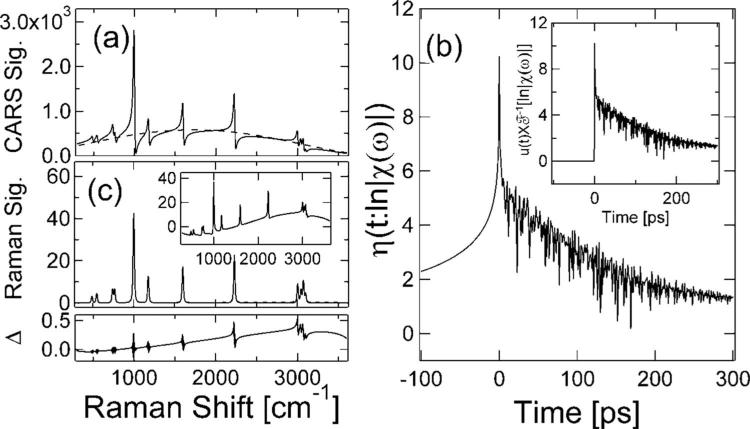
Figure 1(a) shows a simulated CARS spectrum with a frequency-dependent NRB amplitude. The simulated signal is computed according to Eq. (1), with the resonant susceptibility calculated as a sum of Lorentzian functions, and a nonresonant amplitude that is not spectrally flat. The spectral phase, φ(ω), is extracted using the right-hand side of Eq. (6), but we replace the product in Eq. (3) with
| (7) |
where fNR(ω) is the nonresonant component of the response. This modification is motivated by the fact that when the NRB is not flat, its Fourier transform, , is a symmetric function, centered about time zero with a finite width. Thus we use η(t:f(ω)) rather than , assuming that the signal has a negative-time component arising solely from the nonresonant response, and that the positive-time response contains both resonant and nonresonant components.
Fig. 1.
(a) Numerical simulation of a CARS spectrum via a coherent addition of multiple Lorentzian lineshape functions and a variable nonresonant background (dashed). (b) Temporal function η(t:ln|χ(ω)|), obtained by modified time-domain constraint shown in Eq. (7). Inset, temporal function , obtained without NRB information. (c) (top) Extracted Raman spectrum (solid) and the reference Raman spectrum (dashed); (bottom) difference between the reference and retrieved Raman spectra. Inset, Raman spectrum extracted using from the inset of panel (b).
Figure 1(b) shows η(t:ln|χ(ω)|), as calculated from the simulated data of Fig. 1(a). By way of comparison, the function is plotted in the inset. The time-domain representations in the main figure and in the inset are used to calculate two different estimations of φ(ω)and subsequently to calculate complex third-order susceptibility χ(ω)=|χ(ω)|exp[iφ(ω)] and extract the corresponding imaginary part, Im{χ(ω)}=|χ(ω)|sin[φ(ω)]. The resulting Raman spectra are shown in Fig. 1(c) and its inset, respectively.
The input Raman spectrum was designed to test the applicability of this phase-retrieval method for congested spectral regions and for a range of resonant signal amplitudes, including very large signals (χR/χNR=6 at 1000 cm–1). The method succeeds in each case. The retrieved Raman spectrum conforms remarkably well to the original Raman spectrum, whereas the Raman spectrum plotted in the inset shows significant deviations in baseline and peak amplitudes. The error (Δ) in the Raman spectrum retrieved by the method described herein is plotted just below Fig. 1(c). The small nonzero amplitude of Δ arises from the fact that, although the theory represented in Eqs (3)–(6) is exact for continuous data over an infinite frequency range, the data are not continuous and do not cover an infinite frequency range. The error due to discreteness manifests primarily in the peak heights; as we increase the density of the data, these errors diminish. A padding procedure [18] also helps to reduce these errors. The CARS spectrum shown in Fig. 1 consisted of 8096 points and was transformed after padding to 24,288 points. The error due to finite frequency range manifests primarily in a small cumulative phase error, resulting in the gentle drift of the function Δ. Corrections to this phase-error range are likely to be achieved by following the procedure outlined in [11]; the “background phase” in that work is of the same origin as the phase error seen here.
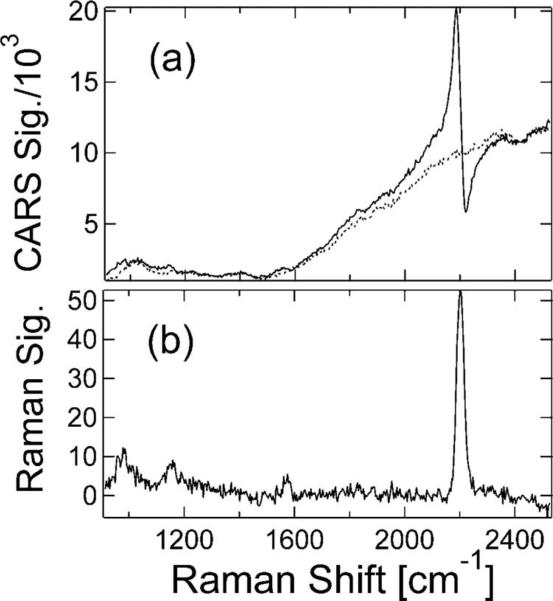
Experimental verification of our approach is demonstrated in Fig. 2. Figure 2(a) shows an experimental CARS spectrum of benzonitrile in ethanol at a concentration of 1 M, with a separately measured NRB. The spectra are acquired using the apparatus described in [19]. The retrieved Raman spectrum is shown in Fig. 2(b). Note that all the peaks in the vicinity of (1000,1180, and 1600) cm–1 are faithfully retrieved, even though their presence is not obvious in the original data.
Fig. 2.
(a) Experimental CARS spectrum of benzonitrile in ethanol at a concentration of 1 M (solid) and a separately measured nonresonant background (dotted). (b) Raman spectrum extracted using Eqs. (6) and (7) and the separately measured background. Uncertainty in the frequency calibration is ±3 cm–1.
In conclusion, we describe a simple and reliable approach, equivalent to a KK transform, for retrieving spectral phase from an optical modulus measurement. This method conveniently accommodates the nonideality in signal generation that leads to nonflat nonresonant background in broadband and multiplex CARS by dealing with causality considerations in the time domain. Because data over a finite frequency range are considered, there is potential for a small phase error, which can be dealt with by established methods [11] if necessary. The approach is very fast, relying only on two FFT operations, so that application to large data sets generated in broadband CARS microscopy will be straightforward.
Acknowledgments
The authors thank Erik Vartiainen, Lee Richter, and the reviewers for stimulating discussion and constructive criticism that considerably strengthened the work.
References
- 1.Rinia HA, Bonn M, Muller M. J. Phys. Chem. B. 2006;110:4472. doi: 10.1021/jp0564849. [DOI] [PubMed] [Google Scholar]
- 2.Smith DY. J. Opt. Soc. Am. 1977;67:570. [Google Scholar]
- 3.Peiponen K-E, Lucarini V, Saarinen JJ, Vartiainen E. Appl. Spectrosc. 2004;58(5):499. doi: 10.1366/000370204774103309. [DOI] [PubMed] [Google Scholar]
- 4.Aspnes DE. The Accurate Determination of Optical Properties by Ellipsometry. In: Palik ED, editor. Handbook of Optical Constants of Solids. Academic; 1985. pp. 89–112. [Google Scholar]
- 5.Lucarini V, Saarinen JJ, Peiponen KE, Vartiainen EM. Kramers–Kronig Relations in Optical Materials Research. Springer-Verlag; 2005. [Google Scholar]
- 6.Ahrenkiel RK. J. Opt. Soc. Am. 1971;61:1651. [Google Scholar]
- 7.Palmer KF, Williams MZ, Budde BA. Appl. Opt. 1998;37:2660. doi: 10.1364/ao.37.002660. [DOI] [PubMed] [Google Scholar]
- 8.Peterson CW, Knight BW. J. Opt. Soc. Am. 1973;63:1238. [Google Scholar]
- 9.Johnson DW. J. Phys. A. 1975;8:490. [Google Scholar]
- 10.Vartiainen EM, Peiponen KE, Tsuboi T. J. Opt. Soc. Am. B. 1990;7:722. [Google Scholar]
- 11.Vartiainen EM, Rinia HA, Muller M, Bonn M. Opt. Express. 2006;14:3622. doi: 10.1364/oe.14.003622. [DOI] [PubMed] [Google Scholar]
- 12.Liu YX, Lee YJ, Cicerone MT. J. Raman Spectrosc. (to be published) [Google Scholar]
- 13.Lim SH, Caster AG, Leone SR. Opt. Lett. 2007;32:1332. doi: 10.1364/ol.32.001332. [DOI] [PubMed] [Google Scholar]
- 14.Lepetit L, Cheriaux G, Joffre M. J. Opt. Soc. Am. B. 1995;12:2467. [Google Scholar]
- 15.Chen BC, Lim SH. J. Phys. Chem. B. 2008;112:3653. doi: 10.1021/jp710743k. [DOI] [PubMed] [Google Scholar]
- 16.Arfken GB. Mathematical Methods for Physics. 5th ed. Academic; 2001. [Google Scholar]
- 17.Ohta K, Ishida H. Appl. Spectrosc. 1988;42:952. [Google Scholar]
- 18.Vartiainen EM. J. Opt. Soc. Am. B. 1992;9:1209. [Google Scholar]
- 19.Kee TW, Zhao HX, Cicerone MT. Opt. Express. 2006;14:3631. doi: 10.1364/oe.14.003631. [DOI] [PMC free article] [PubMed] [Google Scholar]


