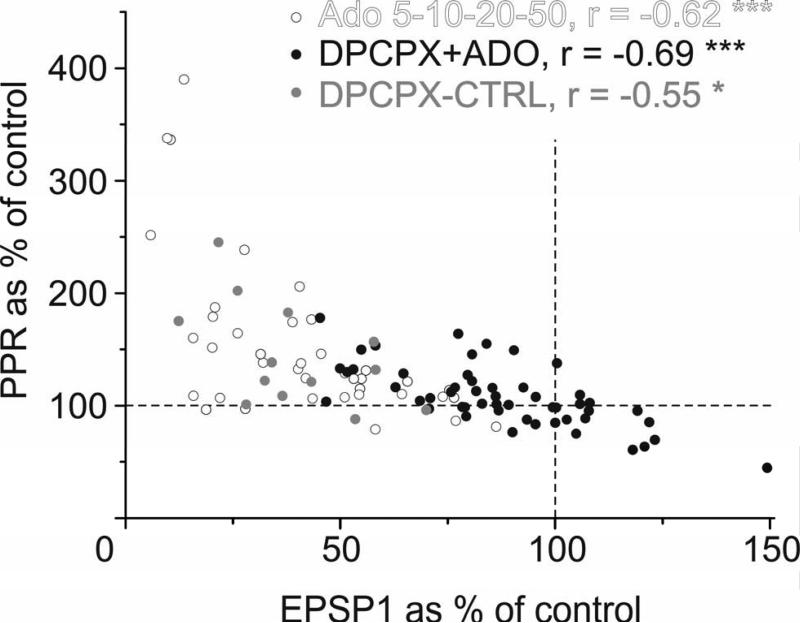
Fig 5. Adenosine induced changes in EPSP amplitude are inversely related to changes in PPR.
Changes in PPR plotted against changes in the EPSP1 amplitude. The changes in PPR and EPSP1 amplitude were correlated in all three groups of experiments: Experiments with the application of adenosine at different concentrations (5-50 μM, open circles, r = -0.62, n = 39, p < 0.001); experiments utilizing application of 20 μM adenosine on the background of different concentrations of DPCPX (1.5 - 150 nM, closed circles; r = -0.69, n = 52, p < 0.001); and the control group for these experiments, which utilized 20 μM adenosine but no DPCPX (grey circles, r = −0.55, n = 13, p < 0.05). The changes in EPSP amplitude and PPR are inversely related during all manipulations of A1R activation.

