Abstract
NMR-Profiles are quantitative one-dimensional presentations of two-dimensional [15N,1H]-correlation spectra used to monitor the quality of protein solutions prior to and during NMR structure determinations and functional studies. In our current use in structural genomics projects, a NMR-Profile is recorded at the outset of a structure determination, using a uniformly 15N-labeled micro-scale sample of the protein. We thus assess the extent to which polypeptide backbone resonance assignments can be achieved with given NMR techniques, for example, conventional triple resonance experiments or APSY-NMR. With the availability of sequence-specific polypeptide backbone resonance assignments in the course of the structure determination, an “Assigned NMR-Profile” is generated, which visualizes the variation of the 15N–1H correlation cross peak intensities along the sequence and thus maps the sequence locations of polypeptide segments for which the NMR line shapes are affected by conformational exchange or other processes. The Assigned NMR-Profile provides a guiding reference during later stages of the structure determination, and is of special interest for monitoring the protein during functional studies, where dynamic features may be modulated during physiological functions.
Keywords: Protein backbone assignment, APSY, protein structure, NMR structure determination, protein dynamics
INTRODUCTION
The quality of protein solutions for NMR structure determination if often difficult to evaluate, especially when compared with the situation encountered in crystal structure determinations, once diffracting crystals have been obtained. In a recent description of the J-UNIO protocol for automated protein structure determination by NMR in solution,1 we mentioned the “NMR-Profile” as a tool for visualization of the quality of protein solutions. Here, we describe the basic ideas underlying the introduction of NMR-Profiles and their use in support of NMR structure determinations and functional studies of proteins.
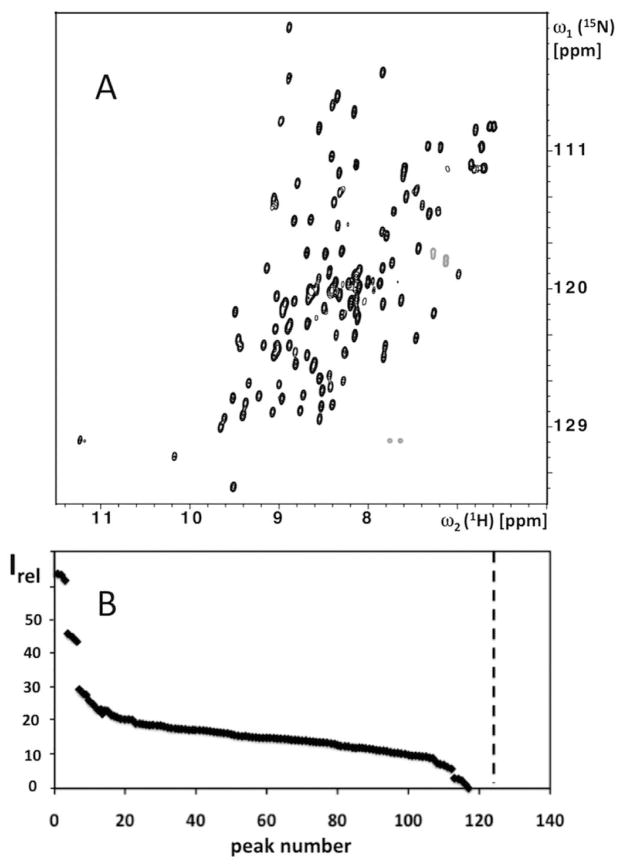
Protein solutions for NMR structure determination have long been assessed from contour plots of two-dimensional (2D) [15N,1H]-correlation (COSY) experiments (Figure 1A).2,3 Although contour plots enable one to monitor the number of signals in the “protein fingerprint” of polypeptide backbone 15N–1H cross peaks, it is in our experience more difficult to routinely derive a reliable survey of the peak intensities from such presentations of COSY spectra. In the NMR-Profile, [15N,1H]-COSY signals of the polypeptide backbone and the Trp indole moieties are presented as a one-dimensional array in the inverse order of the relative peak intensities. The NMR-Profile then enables to compare at one glance the number of observed peaks with the peak number predicted from the amino acid sequence, and in addition provides an overview of the relative signal intensities (Figure 1B). When recorded with μl amounts of protein solution, using a microcoil NMR probehead,4,5 the NMR-Profile is a also tool for the initial evaluation of protein solutions to be used in structural genomics projects. As is described in more detail below, appropriate calibration of the NMR-Profile further enables to predict the extent of polypeptide backbone NMR assignments that can be obtained with a given set of NMR experiments (corresponding information can of course also be obtained from measurements with larger amounts of protein and standard size NMR equipment). At a more advanced stage of a structure determination, the information of the NMR-Profile can be combined with the sequence-specific polypeptide backbone assignments to generate the corresponding “Assigned NMR-Profile”. Its use for monitoring the protein during the completion of the structure determination and during functional studies will be discussed.
FIGURE 1.
(A) Contour plot of a 2D [15N,1H]-HSQC spectrum of a 1.2 mM solution of the 15N-labeled protein YP_001302112.1 from Parabacteroides distasonis measured on a Bruker AVANCE 700 MHz spectrometer equipped with a room temperature 1.7 mm TCI probehead (HSQC stands for “heteronuclear single-quantum coherence” and designates a specific type of COSY experiment).18 (B) NMR-Profile resulting from the analysis of the spectrum in (A). The backbone amide group and Trp indole group signals are plotted along the horizontal axis in the order of decreasing intensities, Irel, which are indicated by black diamonds. The dotted vertical line indicates the number of peaks expected from the amino acid sequence (see text).
MATERIAL AND METHODS
Protein production and NMR sample preparation
Proteins were produced using a standard protocol for cloning, expression and purification, as applied with the protein YP_001302112.1 (Figure 1).6 In the micro-scale (50 μl) samples of [u-15N]-protein and in the samples of [u-13C,u-15N]-protein for structure determination (500 μl), the protein concentration was in the 1.1 to 1.4 mM range, and a standard NMR buffer containing 20 mM sodium phosphate at pH = 6.0, 50 mM sodium chloride and 5% D2O was used throughout.
NMR spectroscopy
COSY data were recorded as 2D [15N,1H]-HSQC spectra at 600 MHz and 700 MHz, using an experimental scheme that combined application of the 3–9–19 watergate routine and gradient-induced water dephasing/rephasing during the 15N-evolution period to minimize both the residual water signal intensity and the water saturation.7 The [15N,1H]-INEPT and [15N,1H]-refocusing periods were both set to 5.4 ms. 15N-decoupling during 1H acquisition was achieved with WALTZ-16 irradiation.8 The interscan delay was set to 1 s. The 1H-carrier was at the water frequency, and the 15N carrier was between 116 and 120 ppm, depending on the protein. 128 and 1024 complex points were acquired in the t1(15N) and t2(1H) dimensions, respectively, covering sweep widths of 34 ppm and 14 ppm. Prior to Fourier transformation the data were multiplied with a (sin75, sin75) window function,9 and zero-filled to 256 and 2048 complex points along t1(15N) and t2(1H), respectively.
Generation of the NMR-Profile and the assigned NMR-Profile
The experimental data needed to generate an NMR-Profile are obtained by identification of the [15N,1H]-COSY cross peaks and evaluation of their intensities. Although automated peak pickers are available, we so far find it more efficient (see also the next section) to analyze the spectra interactively, and for this we use the software XEASY.10 Using the “measure noise” routine of XEASY we first check that the noise level is uniform over the entire two-dimensional spectral plane and then determine the average noise level. Using the “maximum” mode of XEASY with standard parameters, we next evaluate the peak heights in units of the average noise level. After eliminating the signals arising from the side chains of Asn, Gln and Arg (see the next section), the peaks are ordered according to decreasing peak heights, and displayed in this order along a horizontal axis (Figure 1B) with the use of a marker scatter plot routine (Openoffice). The number of 15N–1H cross peaks predicted from the amino acid sequence (vertical broken line in Figure 1B) is calculated as (m−1 + nW), where m is the number of non-proline amino acid residues and n the number of Trp residues in the protein.11
To prepare the Assigned NMR-Profile, a new 2D [15N,1H]-HSQC spectrum is recorded with the same sample of the 13C,15N-labeled protein as is used for the APSY-NMR experiments, using the same settings of a 600 MHz spectrometer equipped with a 5 mm cryogenic probehead. This spectrum is analyzed as described above for the experiment recorded with the micro-scale sample. The higher signal-to-noise ratio in this spectrum and the use of the now available polypeptide backbone assignments to support deconvolution of overlapping signals and identification of possible spectral artifacts results in an overall higher-quality data set of peak intensities. These are then assigned to the individual amino acid residues in a histogram-type bar plot of Irel versus the amino acid sequence (Figure 3, C and C′), using a spreadsheet (Openoffice).
FIGURE 3.
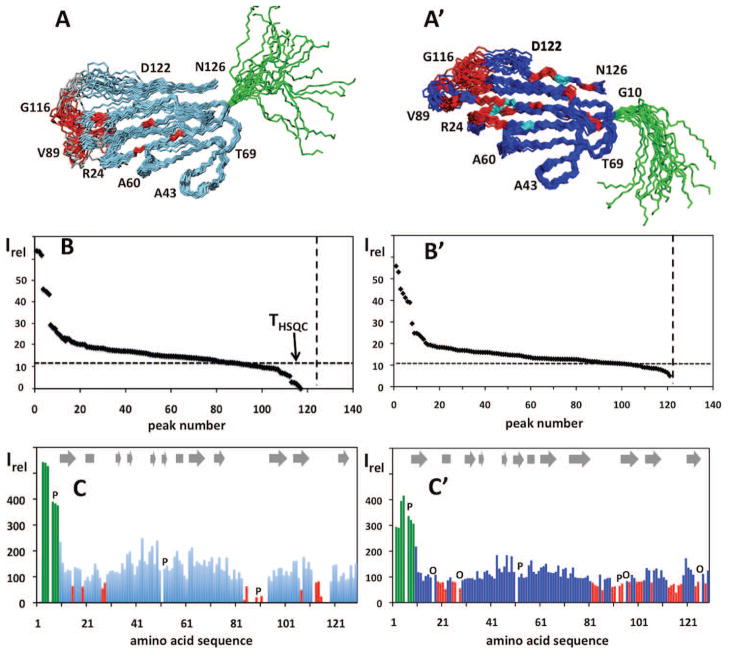
(A) Bundle of 20 conformers representing the NMR structure of the protein YP_001302112.1 in the absence of CaCl2 (PDB ID: 2LGE).6 Amino acid positions have been color-coded as in (C) below. Selected residues are identified to guide the eye. (B) NMR-Profile of the protein YP_001302112.1 in the absence of CaCl2, as evaluated from the NMR spectrum in Figure 1A (same data as in Figure 1B). The numbers along the vertical axis indicate the peak intensities in units of the average noise level in the two-dimensional spectrum. The dotted vertical line indicates the number of peaks expected from the amino acid sequence, and the dotted horizontal line represents the threshold for obtaining polypeptide backbone assignments with a standard set of APSY-NMR experiments1,15,16 (see text). (C) Assigned NMR-Profile generated from a 600 MHz 2D [15N,1H]-HSQC spectrum recorded with a 5 mm cryogenic probehead, using the sample of 13C,15N-labeled protein that was prepared for the structure determination (Figure 2).6 Note the higher signal-to-noise ratio when compared to panel B. Missing data due to the presence of proline residues or to signal overlap are indicated by the letters P and O, respectively. The bars for residues with high (Irel > 250), medium (250 ≥ Irel ≥ 80) and low (Irel < 80) intensity are color-coded in green, blue and red, respectively. In the NMR-Profile of panel B the red residues all have signal heights below the dotted horizontal line, and they were in part assigned by supplementing the APSY-NMR data sets with additional NMR experiments.6 (A′), (B′) and (C′): same as (A), (B) and (C) for the protein YP_001302112.1 in the presence of CaCl2 (PDB ID: 2LG7).
RESULTS AND DISCUSSION
2D [15N,1H]-COSY spectra and NMR-Profiles
The [15N,1H]-COSY spectrum of a protein (Figure 1A) contains 15N–1H cross peaks of the backbone amide groups, the Asn and Gln side chain amide groups, the Arg side chain guanidinium groups and the Trp side chain indole groups. Ideally, the NMR-Profile would include only the backbone signals, but in our practice it also contains the Trp indole signals, since these can, based on the 1H chemical shifts, only tentatively be distinguished from the backbone signals before resonance assignments are available.12 The Asn and Gln side chain amide signals can in general readily be identified, since they appear in pairs sharing the same 15N chemical shift. The Arg side chain guanidinium signals can be eliminated because they are in most cases folded at the set-ups that are typically used for [15N,1H]–COSY experiments, and hence they appear with negative intensity.
An NMR-Profile can be generated using a peak list obtained from the experimental [15N,1H]-COSY spectrum either interactively or with an automatic peak picker. Based on our experience, an interactive step is recommended to validate the result of automated peak picking, mainly for eliminating the Asn, Gln and Arg side chain peaks and possible artifacts, as well as to add real peaks that were not identified by the automated routine, for example, because of signal overlap. After checking that the noise level is homogeneous over the entire spectrum (Figure 1A), the relative peak intensities, Irel, shown in the NMR-Profile (Figure 1B), are measured as the height at the peak maxima in units of the average noise level. A vertical line in the NMR-Profile represents the number of expected cross peaks calculated from the amino acid sequence as the sum of the number of NMR-observable backbone amide groups and Trp indole groups (for details see Materials and Methods).
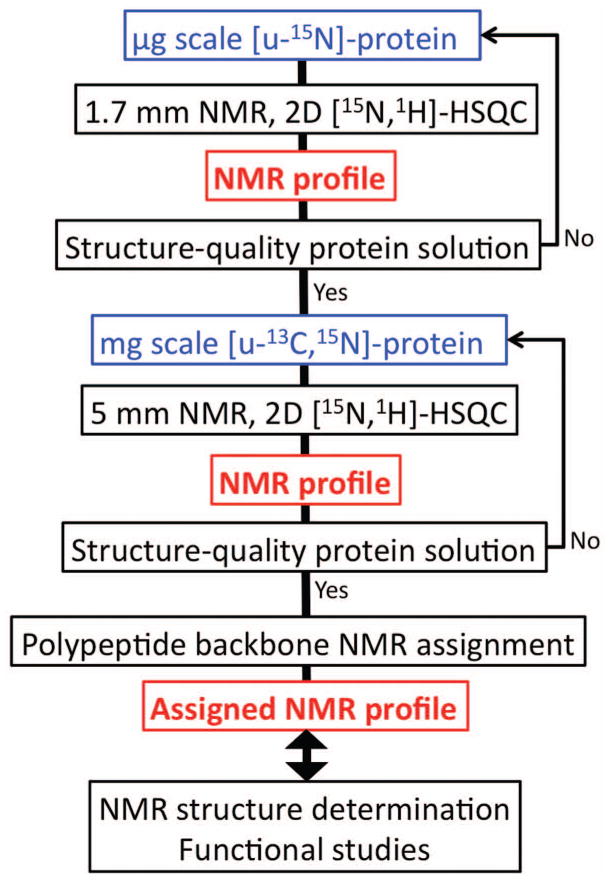
To prepare the input for the Assigned NMR-Profile (see Material and Methods), the aforementioned analysis of the micro-scale [15N,1H]-COSY experiment is repeated with a new spectrum recorded with the solution of the 13C,15N-labeled protein prepared for the structure determination, using standard-size NMR samples (Figure 2), and the presentation of the data (Figure 3, C and C′) is generated as described in Materials and Methods.
FIGURE 2.
Flow diagram showing the use of NMR-Profiles in the course of a protein structure determination and during functional studies. Indicated are protein solutions and NMR equipment used at different steps of the structure determination protocol for structural genomics projects pursued in our laboratory.1
NMR-Profile of a structure-quality protein solution
We describe here our approach to characterize solutions of unknown proteins for their suitability for NMR structure determination. In structural genomics projects, early quality assessment with minimal amounts of protein is of key importance for acceptable efficiency. Therefore we use micro-scale protein production and micro-coil NMR equipment4,5 for the initial screening of new proteins (Figure 2). A corresponding strategy can of course be based on the use of standard-size protein samples and NMR equipment.
In a first step, the NMR-Profile recorded with a micro-scale sample of the [u–15N]-protein (Figure 1B) is inspected for completeness of the spectrum of 15N–1H cross peaks, based on comparison with the number of peaks predicted from the amino acid sequence. If the number of peaks exceeds the predicted number, there is an indication either of a local conformational polymorphism with slow exchange between the different structures, or of the presence of protein impurities. Incomplete sets of NMR signals are in most instances indicative of line broadening due to local mobility on the millisecond to microsecond timescale.13,14 Additional information is obtained on outstandingly intense signals (left side of Figure 1B), which usually indicate the presence of “unstructured” polypeptide segments with mobility on the sub-nanosecond timescale. Protein solutions showing a cross peak number within 10% of the prediction from the sequence and with otherwise favorable NMR features, as manifested by a near-homogeneous peak intensity distribution and the presence of at most a small number of outstandingly intense peaks, are accepted for further NMR characterization, and the other proteins are returned to the biochemistry laboratory for possible salvaging.1
In a second step the NMR-Profile is used to predict the extent of polypeptide backbone assignments that can be obtained with a given set of experiments, for example, APSY-NMR15,16 or 3D triple-resonance experiments17 recorded with specified NMR equipment. To this end the peak intensities in the NMR-Profile are calibrated against related peak intensities in the NMR spectra needed to obtain sequence-specific polypeptide backbone assignments. This calibration procedure is described in the Appendix, and its result for the two protein solutions represented in Figure 3 is given by the broken horizontal line in the panels B and B′, i.e., with the use of a standard set of APSY-NMR experiments, sequence-specific polypeptide backbone assignments are likely to be obtained for all residues with values of Irel above this line.
Overall, for a protein that is selected based on the information visualized in the NMR-Profile (Figure 3,B and B′), one knows in advance of the structure determination the number of NMR-observable amino acid residues and the percentage thereof for which polypeptide backbone assignments can be expected from a defined set of NMR experiments. One is further informed about the likely occurrence of local conformational polymorphisms and the presence of highly flexible polypeptide segments.
Assigned NMR-Profiles, protein structure determination and functional studies
The Assigned NMR-Profiles (Figure 3, C and C′) of the two protein solutions in Figure 3 show that the outstandingly intense signals in the panels B and B′ originate from 9 adjoining residues in an N-terminal flexible “tail”, and it reveals the sequence locations of the peaks that were predicted from the NMR-Profiles (Figure 3, B and B′) to have weak intensity or be missing in the spectrum. Using the Assigned NMR-Profile, such characteristics of the protein can readily be monitored during subsequent steps of structure refinement, or during functional studies. Comparison of the panels C and C′ in Figure 3 provides an illustrative example: Upon binding of the protein YP_001302112.1 to Ca2+, the internal dynamics of the globular part of the protein is changed so that all amino acid residues become NMR-observable, whereas the flexibility of the N-terminal nonapeptide segment is maintained.6 The assigned NMR-Profile thus provides initial indications of the location of the metal binding site prior to the start of more labor-intensive investigations. Assigned NMR-Profiles can in analogous ways be used for efficient visualization of changes in a protein that are associated with its physiological role, for example, when comparing an enzyme at different steps during its reaction cycle.
Acknowledgments
Grant sponsor: NIH Protein Structure Initiative, National Institute of General Medical Sciences (www.nigm.nih.gove); Grant numbers U54 GM074898 and U54 GM94586. Financial support for BP was obtained from the Schweizerischer Nationalfonds (fellowship PA00A–104097/1). We thank Christina Stocker, Erich Michel and Kristaps Jaudzems for providing the proteins TM1290 and CL5766A for this project.
APPENDIX: Correlating 2D [15N,1H]-COSY signal intensities with those of related signals in higher-dimensional correlation experiments
Here, we describe the background work needed for use of the NMR-Profile of Figure 1B to predict the likely success of a given polypeptide backbone assignment strategy, e.g., based on APSY-NMR15,16 or on 3D triple-resonance experiments17 with a specified instrument setup. The procedure consists of stepwise experimental determination of quantitative relations between the different spectra. In a first step, a calibration constant was determined which correlates the signal intensities in the [15N,1H]-COSY spectrum with the intensity of related peaks in the higher-dimensional spectra recorded with identical instrument settings. Additional NMR experiments measured the impact of the different instrument setups and the different isotope labeling used at the screening and structure determination stages. An intensity threshold in the NMR-Profile was thus established, above which a residue observed with [15N,1H]-COSY is most likely assignable with the higher-dimensional data sets (Figure 3, B and B′). In the following we describe how data recorded for a 15N-labeled protein with a 700 MHz 1.7 mm room temperature probehead were correlated with APSY-NMR data recorded for the 13C,15N-labeled form of the protein with a 600 MHz 5 mm cryogenic probehead. Similar procedures apply for establishing correlations with other high-dimensional experiments used for polypeptide backbone resonance assignments, for example, the widely used 3D triple resonance experiments.17,18 Although the initial calibration for a given combination of experiments is quite labor-intensive, the same calibration parameters can be used in serial investigations of multiple proteins with the same NMR equipment.
We started from the experimental observation that a signal-to-noise ratio of 6 is needed for reliable automated identification of APSY-NMR signals with the software GAPRO.15,16 Furthermore, a trial and error search for a relation between related peak intensities in 2D [15N1H]-COSY, IHSQC, and in 4D or 5D APSY-NMR experiments, IAPSY, indicated that the Equation (1) is a promising approach:
| (1) |
The parameter A was determined experimentally, using four proteins in the 116 to 208 amino acid size range.
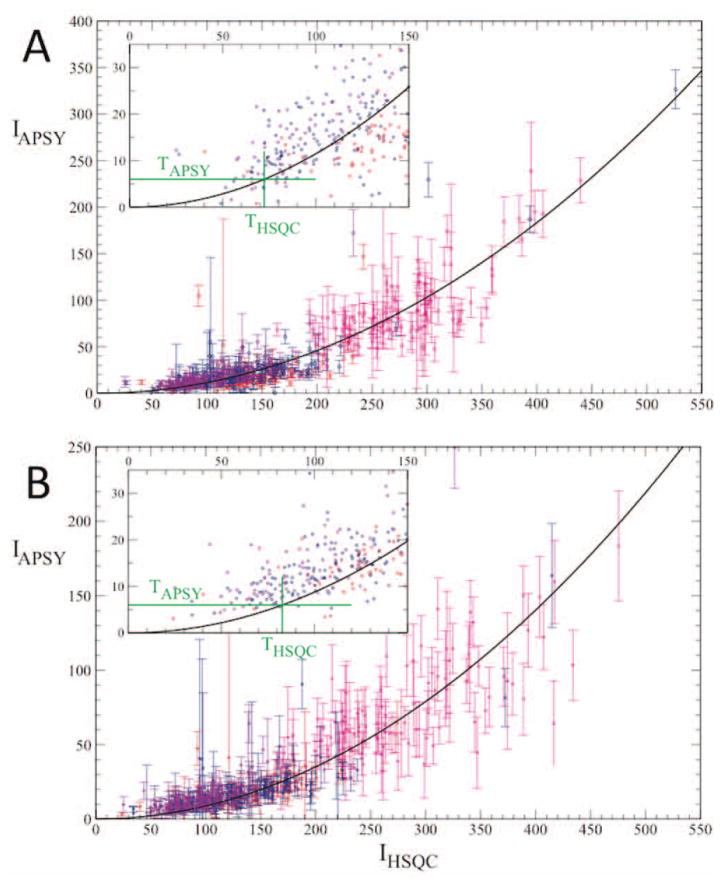
In a first step, related peak intensities in 2D [15N,1H]-HSQC spectra and APSY-NMR experiments measured with identical instrumentation and identical protein solutions were correlated. In Figure 4 the average of the peak intensities in the APSY projections, IAPSY, is plotted versus the intensity of the corresponding signals in the [15N,1H]-HSQC spectra, IHSQC, for 5D APSY-HACACONH (A) and 4D APSY-HACANH (B).15 The experimental points represent data for assigned 15N–1H groups, and the error bars in the y-direction represent the variation of the signal intensities in the different 2D projections of the APSY data sets.15,16 The green lines in the insets visualize how the threshold signal intensity of the 2D [15N,1H]-COSY experiment is determined via the equation (1), based on the aforementioned requirement that the intensity of the related APSY-NMR signals must be larger than a threshold value of TAPSY = 6. Values for THSQC of approximately 70 and 80, respectively, were thus obtained for the 5D APSY-HACACONH and 4D APSY-HACANH experiments (Figure 4).
FIGURE 4.
Correlations between signal intensities in [15N,1H]-HSQC spectra and related signals in APSY-NMR spectra recorded with identical NMR instrumentation. Data were recorded at 25°C with 1 mM 13C,15N-labeled samples of the proteins TM1290, NB7890A, CL5766A and NB7804A, which cover the size range from 116 to 208 amino acids, using the same spectrometer as described for Figure 3, C and C′. Along the horizontal axis is the signal intensity in the [15N,1H]-HSQC spectra, IHSQC, and on the vertical axis the signal intensity of the related peaks in the APSY-NMR spectra, IAPSY. The signal intensities are in units of the average noise level in the respective spectra. The vertical error bars represent the standard deviations over all 2D projections recorded in the APSY experiments.1,16 The black line displays the best fit to the data of the quadratic function of Equation (1). The insert is an expanded plot of the area of low signal intensities, where the intensity threshold for unambiguous identification of APSY signals, TAPSY = 6 (see text), and the corresponding threshold for the 2D COSY spectrum, THSQC, are indicated by green horizontal and vertical lines, respectively. (A) 5D APSY-HACACONH. (B) 4D APSY-HACANH experiment.
In a second step, comparison of NMR spectra recorded with identical protein solutions on our 700 MHz instrument, which is equipped with a room temperature 1.7 mm micro-coil probehead, and on our 600 MHz instrument, which is equipped with a 5 mm cryogenic probehead, showed that the 600 MHz set-up provided 9.3-fold higher sensitivity.
In a third step, we accounted for the different relaxation times in the differently isotope-labeled protein preparations18 by comparing data recorded for the 15N-labeled protein and the 13C,15N-labeled protein with identical instrumentation and instrument settings, which showed that the signal heights in the doubly-labeled proteins were at 80% of those for the 15N-labeled proteins.
Multiplication of the correlation constants obtained from the steps 1 to 3 provides the desired relation between the related peak intensities in the 700 MHz micro-coil 2D [15N,1H]-HSQC spectrum and the 600 MHz cryoprobe APSY-NMR spectra. For 5D APSY-HACACONH, IHSQC ≥ 9.3 corresponds to the required intensity for APSY-NMR signals of 6 (see above), and for the less sensitive 4D APSY-HACANH experiment we obtained IHSQC ≥ 11.2 In our daily work we currently use a correlation coefficient of 11 for all APSY-NMR experiments needed for obtaining the polypeptide backbone assignments.1,16 This coefficient can be further adapted to account for using numbers of scans in one or both experiments which differ from the standard numbers used in the calibration procedure.
References
- 1.Serrano P, Pedrini B, Mohanty B, Geralt M, Herrmann T, Wüthrich K. J Biomol NMR. 2012;53:341–354. doi: 10.1007/s10858-012-9645-2. [DOI] [PMC free article] [PubMed] [Google Scholar]
- 2.Liu G, Shen Y, Atreya HS, Parish D, Shao Y, Sukumaran DK, Xiao R, Yee A, Lemak A, Bhattacharya A, Acton TA, Arrowsmith CH, Montelione GT, Szyperski T. Proc Natl Acad Sci USA. 2005;102:10487–10492. doi: 10.1073/pnas.0504338102. [DOI] [PMC free article] [PubMed] [Google Scholar]
- 3.Yee A, Gutmanas A, Arrowsmith C. Curr Opin Struct Biol. 2007;16:611–617. doi: 10.1016/j.sbi.2006.08.002. [DOI] [PubMed] [Google Scholar]
- 4.Page R, Peti W, Wilson IA, Stevens RC, Wüthrich K. Proc Natl Acad Sci USA. 2005;102:1901–1905. doi: 10.1073/pnas.0408490102. [DOI] [PMC free article] [PubMed] [Google Scholar]
- 5.Peti W, Page R, Moy K, O’Neil-Johnson M, Wilson IA, Stevens RC, Wüthrich K. J Struct Funct Genomics. 2005;6:259–267. doi: 10.1007/s10969-005-9000-x. [DOI] [PubMed] [Google Scholar]
- 6.Serrano P, Geralt M, Mohanty B, Wüthrich K. Protein Sci. 2013 doi: 10.1002/pro.2284. [DOI] [PMC free article] [PubMed] [Google Scholar]
- 7.Mori S, Abeygunawardana C, Johnson MO, Berg J, van Zijl PCM. J Magn Reson. 1995;B108:94–98. doi: 10.1006/jmrb.1995.1109. [DOI] [PubMed] [Google Scholar]
- 8.Shaka A, Keeler J, Freeman R. J Magn Reson. 1983;53:313–340. [Google Scholar]
- 9.DeMarco A, Wüthrich K. J Magn Reson. 1976;24:201–204. [Google Scholar]
- 10.Bartels C, Xia T, Billeter M, Güntert P, Wüthrich K. J Biomol NMR. 1995;6:1–10. doi: 10.1007/BF00417486. [DOI] [PubMed] [Google Scholar]
- 11.Wüthrich K. NMR of Proteins and Nucleic Acids. Wiley-Interscience; 1986. [Google Scholar]
- 12.Leopold M, Urbauer J, Wand A. Mol Biotechnol. 1994;2:61–93. doi: 10.1007/BF02789290. [DOI] [PubMed] [Google Scholar]
- 13.Jaudzems K, Geralt M, Serrano P, Mohanty B, Horst R, Pedrini B, Elsliger MA, Wilson IA, Wüthrich K. Acta Cryst F. 2010;66:1367–1380. doi: 10.1107/S1744309110005890. [DOI] [PMC free article] [PubMed] [Google Scholar]
- 14.Serrano P, Pedrini B, Geralt M, Jaudzems K, Mohanty B, Horst R, Herrmann T, Elsliger M, Wilson IA, Wüthrich K. Acta Cryst F. 2010;66:1392–1405. doi: 10.1107/S1744309110020956. [DOI] [PMC free article] [PubMed] [Google Scholar]
- 15.Hiller S, Fiorito F, Wüthrich K, Wider G. Proc Natl Acad Sci USA. 2005;102:10876–10881. doi: 10.1073/pnas.0504818102. [DOI] [PMC free article] [PubMed] [Google Scholar]
- 16.Hiller S, Wider G, Wüthrich K. J Biomol NMR. 2008;42:179–195. doi: 10.1007/s10858-008-9266-y. [DOI] [PubMed] [Google Scholar]
- 17.Sattler M, Schleucher J, Griesinger C. Progr NMR Spec. 1999;34:93–158. [Google Scholar]
- 18.Cavanagh J, Fairbrother WJ, Palmer AGI, Rance M, Skelton NJ. Protein NMR spectroscopy. Elsevier academic press; San Diego: 2007. [Google Scholar]


