Abstract
Rationale and Objectives
The treatment of nonmelanoma skin cancer (NMSC) is usually by surgical excision or Mohs micrographic surgery and alternatively may include photodynamic therapy (PDT). To guide surgery and to optimize PDT, information about the tumor structure, optical parameters, and vasculature is desired.
Materials and Methods
Spatial frequency domain imaging (SFDI) can map optical absorption, scattering, and fluorescence parameters that can enhance tumor contrast and quantify light and photosensitizer dose. High frequency ultrasound (HFUS) imaging can provide high-resolution tumor structure and depth, which is useful for both surgery and PDT planning.
Results
Here, we present preliminary results from our recently developed clinical instrument for patients with NMSC. We quantified optical absorption and scattering, blood oxygen saturation (StO2), and total hemoglobin concentration (THC) with SFDI and lesion thickness with ultrasound. These results were compared to histological thickness of excised tumor sections.
Conclusions
SFDI quantified optical parameters with high precision, and multiwavelength analysis enabled 2D mappings of tissue StO2 and THC. HFUS quantified tumor thickness that correlated well with histology. The results demonstrate the feasibility of the instrument for noninvasive mapping of optical, physiological, and ultrasound contrasts in human skin tumors for surgery guidance and therapy planning.
Keywords: Skin cancer, optical imaging, ultrasound, optical and blood parameters, surgery, PDT
Nonmelanoma skin cancers (NMSCs), which include basal cell carcinoma (BCC) and squamous cell carcinoma (SCC), are the most common human cancer with more than one million cases every year, and the incidence rate has increased dramatically. Although they rarely metastasize, they can present significant morbidity especially for cases in cosmetically sensitive areas, such as the face. The standard of care for NMSCs is usually surgical excision or Mohs micrographic surgery. Tumors may show multifocal, widespread disease, and suspicious lesions at deeper locations may be present. Typically, biopsies are performed to guide surgeons but can be time-consuming and costly, and the analyzed sections may not be representative of the whole tumor. After surgical removal of the tumor, there may still be residual tumor at the margins, which can result in high-recurrence rates. Thus, the surgeon needs to decide on how much to excise and how deep to go during surgery. Surgery can benefit from prior knowledge of size and depth for more accurate lesion removal. An imaging tool that can provide guidance and thereby reduce recurrence rates, operation times, cost, and the need for multiple biopsies would be highly desired.
Depth and size information can also provide useful information for selecting the appropriate therapy. Topical 5-aminolaevulinic acid (ALA)–based photodynamic therapy (ALA-PDT) has become an attractive treatment option especially for cases with multiple sites and large areas (1,2). ALA-PDT uses topical application of the prodrug ALA that is converted into the photosensitizer (PS) protoporphyrin IX (PpIX), which is activated by light in the presence of oxygen for local tissue destruction. For superficial NMSCs, ALA-PDT has efficacy close to surgery with sometimes better cosmetic and functional outcomes. However, the efficacy is limited for thicker and deeper tumors (3–6). Thus, tumor size information can allow for a better PDT planning.
The PDT dose is related to the light, PS distributions and the available oxygen. Accurate dosimetry, which takes into account individual differences in light, PS dose distributions, and oxygenation levels, is needed for optimized PDT. In most clinical practice, light dose is the prescribed incident fluence rate and is usually fixed. Because light propagation in tissue is strongly affected by the tissue optical properties, local light dose can be significantly different than prescribed dose. Tumors can show significant intra- and interlesion heterogeneity with respect to optical absorption and scattering parameters, which may result in considerable intra- and interlesion variations in the deposited light dose (7). Similarly, intra-and intertumor PS distribution can show significant heterogeneity (8). Thus, knowledge about the spatial distributions of PS content is desired for PDT dose optimization (8). Because oxygen is critical for PDT and because PDT itself can induce significant oxygen depletion that can result in treatment failures, one needs to know about the available oxygen in the target tissue before PDT and how the oxygen is being consumed during PDT (9,10). Tissue oxygenation is substantially dependent on vascular parameters, such as blood oxygen saturation (StO2) and blood volume (7,11). Thus, assessing these parameters can provide quantitative metrics for PDT dosimetry and response.
Spatial frequency domain imaging (SFDI) can quantify both optical absorption and scattering during reflectance imaging mode (12). Knowledge of the optical parameters can allow modeling the light dose distribution within the treatment field, whereas multiwavelength absorption enables the quantification of oxy-, deoxy-, and total hemoglobin concentrations related to blood volume and tissue StO2 as shown in the recent proof-of-principle study of imaging skin lesions, which were located on easily accessible places on the body, such as the arms, legs and torso (13). In addition to PDT dosimetry, these parameters can provide intrinsic contrast enhancement and complement the existing imaging contrast before surgery for improved tumor demarcation.
Several noninvasive imaging modalities have been applied for quantifying the structure of skin tumors. Conventional ultrasound is a well-established imaging modality and is widely used today in preclinical and clinical settings (14,15). It is noninvasive and does not use radiation harmful to the human body. Its use to examine and assess the skin is relatively new (15,16). Compared to conventional ultrasound machines, high frequency ultrasound (HFUS) uses higher frequency (≥20 MHz) sound waves to obtain high-resolution (~50 μm) images and relatively deep penetration depth for skin imaging (>2 mm) (15) without creating any additional safety issues. HFUS can provide information regarding skin structure (thickness of epidermis, dermis, etc.) and lesion thickness, which can guide optical imaging for improved accuracy, as demonstrated recently for guiding fluorescence imaging (17). Because of its high resolution, HFUS has recently shown promise for guiding Mohs surgery of NMSCs (15). Moreover, it was shown that prePDT tumor thickness strongly predicts the probability of local control of NMSCs (18). Thus, there exists a need for routine evaluation of tumor thickness at prePDT.
In this work, we present two interesting clinical cases from our ongoing clinical trial where we used SFDI and HFUS imaging for quantifying optical, vascular, and tissue structure parameters in patients with NMSCs located in imaging-wise challenging areas around the head and neck. Optical absorption (μa), scattering (μs′), and vascular parameters of StO2 and THC quantified by SFDI showed clear tumor contrast when compared to the surrounding normal tissue, whereas HFUS imaging accurately quantified the tumor thicknesses. These noninvasive imaging results were qualitatively supported by the ex vivo analysis of hematoxylin and eosin (H&E) staining. Thus, we conclude that the noninvasive SFDI and the ultrasound imaging can provide quantitative contrasts and therapeutic metrics in NMSCs for surgical guidance and PDT planning at the clinical settings.
MATERIALS AND METHODS
Clinical Spatial Frequency Domain and Ultrasound Imaging Systems
We have initiated a clinical trial under the institutional review board–approved protocol #I226912, and informed consent was obtained from all patients before the measurements. The aim of this pilot study was to demonstrate noninvasive quantification of optical parameters, StO2, blood volume, and thickness of NMSCs before surgery and to establish these techniques for future clinical trials involving PDT. In this study, patients with biopsy-proven nonmelanoma cancer lesions designated to be removed through Mohs micrographic surgery were enrolled.
A clinic-friendly SFDI system was constructed as shown in Figure 1. Figure 1a shows the complete unit at the clinical setting, whereas Figures 1b and 1c shows the picture and schematic diagram of the imaging head. The instrument consisted of four high-power, compact light-emitting diodes (LEDs), LCS series, each centered at 590 nm, 630 nm, 660 nm, and 740 nm, (Mightex, Toronto, Ontario, Canada). A four-channel LED controller (Mightex) sequentially selected the desired excitation wavelength, and light was directed through a liquid light guide to a projector (Light Commander; Logic PD, Inc., Minneapolis, MN, USA) with a digital micromirror device (DMD) module having 1024 × 768 pixel resolution. The DMD module generated the appropriate sine wave patterns with three different phases (0, 2π/3, 4π/3) and 11 spatial frequencies from 0 to 5 cm−1. The patterns were projected onto the skin surface and reflected light was collected with the charge-coupled device (CCD) cameras. The cameras were focused on the same field of view the projector was illuminating (22 × 22 mm2). A rigid light shield with an imaging window blocked room light and maintained a fixed distance to the target tissue. The system contained two CCD cameras separated by a 685 nm dichroic mirror (67-085; Edmund Optics, Barrington, NJ, USA) for imaging fluorescence and reflectance concurrently. The first camera (Pixelfly; PCO, Kelheim, Germany) acquired reflectance images at 590, 630, and 660 nm, whereas a high sensitive EMCCD camera (Luca; Andor, Belfast, Ireland) collected reflectance images at 740 nm (and fluorescence, if any exogenous fluorophores were administered). In this study, a photosensitizer was not applied but multiwavelength reflectance measurements were performed to quantify tissue hemoglobin concentration and StO2. The CCD acquisition time was set to 100 ms; then the total acquisition time was ~13 seconds (100 ms × 3 phase × 11 frequencies × 4 wavelength). The entire system was automated by a custom LabView (National Instruments, Austin, TX, USA) software program, which consisted of subprograms for controlling the individual system parts. LED light source intensities and CCD exposure times could be set automatically for each patient. Cross-polarizers in front of the projector and camera rejected specular reflection during reflectance imaging. The power was <1 mW/cm2 for all the LEDs. The slender imaging head design also allowed for greater access to tissues located in more complex geometries, such as head and neck.
Figure 1.
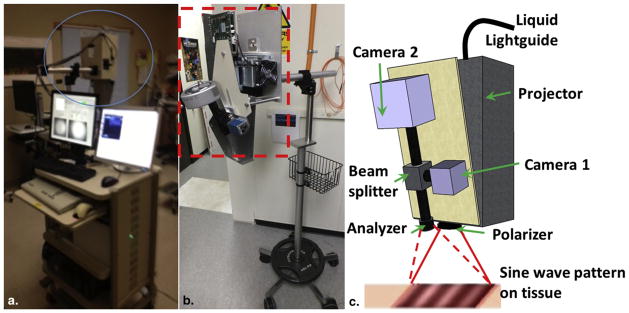
(a) Picture of the complete instrument at the clinic; (b) detailed picture of spatial frequency domain imaging head (red box); and (c) schematic diagram of the imaging head showing the projector module, two charge-coupled device (CCD) cameras, beam splitter, polarizer, and analyzer. Light-emitting diode (LED) light is delivered with a light guide. Four LEDs are switched sequentially. Digital micromirror device generates sinusoidal patterns, pattern projected onto skin surface by projector and reflected signal is detected by CCD cameras.
The imaging protocol involved a custom system that combined HFUS imaging (35 MHz, Episcan; Longport, Inc., Chadds Ford, PA, USA) for complementing the SFDI measurements. The transducer scanned in a straight line across the surface of the tumor while continuously acquiring one-dimensional A scans to build a depth profile of the tumor (B scan). The scan length was 15 mm with 1 second of full B scan acquisition in both the forward and backward direction. The axial (depth) resolution of the system was ~50 μm with a penetration depth of ~5 mm. Skin tumors present as hypoechoic areas in ultrasound images (15). The maximum dimension of the tumor thickness was documented and compared to the histology analysis.
During the measurements at the clinic, SFDI measurements were performed first and the patients were positioned so that the imaging window was kept in contact with the skin. This kept the tumor at the focal plane and reduced motion artifacts during image acquisition. After performing patient measurements, a scan was run on a reference phantom of known optical properties to calibrate the clinical instrument for each patient. Additional digital clinical photographs were taken for each tumor to qualitatively compare to the SFDI images and for clinical documentation. After completion of the serial CCD image captures, HFUS imaging was performed for thickness and depth profiling measurements. First, ultrasound gel was applied to the tumor and the surrounding skin for coupling. The handheld HFUS probe was placed in contact with the surface where the gel was applied. The B scans were viewed in real time and the probe was adjusted as needed to visualize the tumor. The depth and thickness of the tumor were obtained from the time traces that showed the delay of the signal compared to the trigger signal with the delay distance along depth (z-dimension) by multiplying the speed of sound and the delay time. The light shield and the ultrasound probe were disinfected with Cavicide (Metrex, Orange, CA, USA) between patient measurements.
Quantification of Optical and Vascular Parameters
To quantify the optical absorption and scattering, analytical frequency-dependent diffuse reflectance model is fitted to the measured reflectance at multiple frequencies and by using a reference phantom with known optical properties, as detailed previously (12). All 11 spatial frequencies from 0 to 5 cm−1 were used for the analysis. For each frequency and wavelength, the three phases were demodulated to extract the spatially modulated component of the diffuse reflectance. The spatially demodulated reflectance is a function of spatial modulation frequencies. Because it has different sensitivity to absorption and scattering parameters with respect to modulation frequency, SFDI can quantify both absorption and scattering uniquely. Thus, one can perform pixel-by-pixel fitting and obtain a spatial map of absorption and scattering. With known extinction coefficients of oxy- and deoxyhemoglobin and quantified absorption parameters at multiple wave-lengths, one can obtain StO2 and THC maps for each lesion.
Histopathologic Examination
Histopathologic assessments were performed by the Mohs surgeon (N.Z.). The primary NMSC, with a minimum diameter of 0.5–10 mm, was excised as per the standard of care for Mohs surgery. The tumors were frozen in the Mohs lab and frozen sections histologic slides were obtained. The frozen sections were stained with H&E and histologic thickness measurements were done using a micrometer.
RESULTS AND DISCUSSION
Phantom Imaging
The SFDI instrument was tested on skin simulating phantoms with optical absorption (μa) and scattering (μs′) properties within the range of tissue at ~630 nm, which is the common wavelength for skin PDT. Bulk optical parameters were quantified by fitting frequency-dependent reflectance data with modified frequency-domain diffusion model by using a reference phantom with known optical properties (12). Figure 2 shows results from phantoms with increasing absorption and scattering. Our results show that our custom SFDI system was able to reconstruct absorption and scattering parameters with high precision: the correlation coefficients for extracted and actual values were 0.991 and 0.992 for optical absorption and scattering parameters, respectively.
Figure 2.
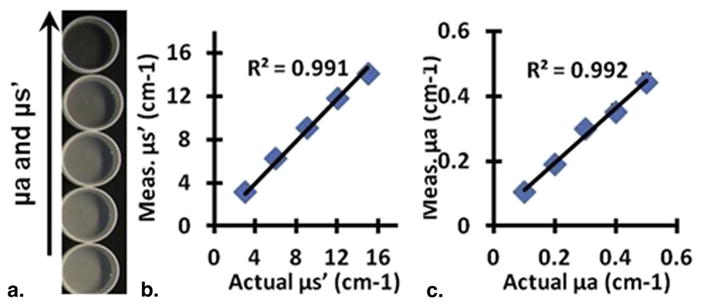
Quantification of optical properties. (a) Skin-simulating phantoms with increasing absorption and scattering. Results from spatial frequency domain imaging show quantification of (b) scattering and (c) absorption. Values are the mean of each image and error bars are the standard deviation of the pixel values (error bars are not visible because of small variations).
Patient Imaging
We then imaged and quantified the optical and physiological parameters in two patients. Figure 3 shows the results from patient 1. The tumor was characterized as a BCC and located on the cheek. As Figures 3a and 3b indicate, the lesion was visible in both white light and 590-nm reflectance images. The image at 590 nm was chosen because the tissue has higher hemoglobin absorption at 590 nm compared to other available wavelengths (630 nm, 660 nm, and 740 nm). Absorption contrast at 590 nm (Fig 3c) was higher in the lesion compared to the surrounding normal tissue, whereas scattering contrast at 590 nm (Fig 3d) was lower in the lesion. The spatial distribution of these parameters within the tumor showed significant heterogeneity with absorption varying by 43% and scattering varying by 40%. Multiwavelength analysis showed that StO2 (Fig 3e) and THC (Fig 3f) were higher in the lesion area than the surrounding tissue and both maps showed significant spatial heterogeneity with StO2 varying by 19% and THC varying by 50%.
Figure 3.
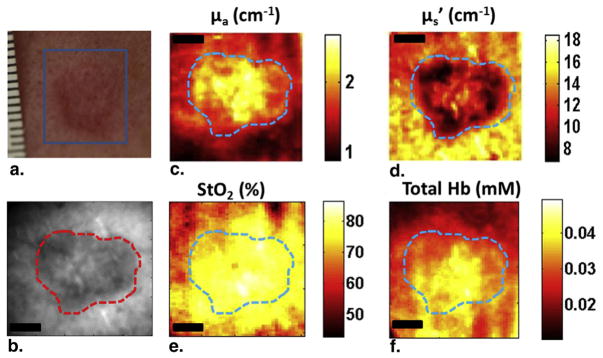
Spatial frequency domain imaging results for patient 1 having basal cell carcinoma. (a) White light picture of the lesion; (b) reflectance image at 590 nm; (c) absorption map; (d) scattering map; (e) and (f) show the StO2 and total hemoglobin concentration maps, respectively. The dashed line marks tumor boundary. Scale bar corresponds to 2 mm.
Figure 4a shows the HFUS image in line-scanning (x) and depth dimensions. The tumor areas could be localized at the extreme edges of the lesion with none in the central biopsied area. This is also confirmed in the H&E image, with tumor areas labeled as “T”. The lesion thickness measured by HFUS was 1.79 ± 0.05 mm. Histopathologic assessment (Fig 4b) indicated the tumor thickness to be ~1.76 mm, close to the measured value by HFUS. The only areas of suspected tumor were on the outside of the lesion. This matches with the corresponding ultrasound image (Fig 4a) that shows contrast only on the outside of the lesion. Interestingly, similar structure of the tumor can be seen in the scattering contrast (Fig 3d) where the lowest scattering is around the outside of the lesion. These results indicate that both imaging modalities showed significant contrasts in multiple parameters, and HFUS had high accuracy in quantification of tumor structure.
Figure 4.
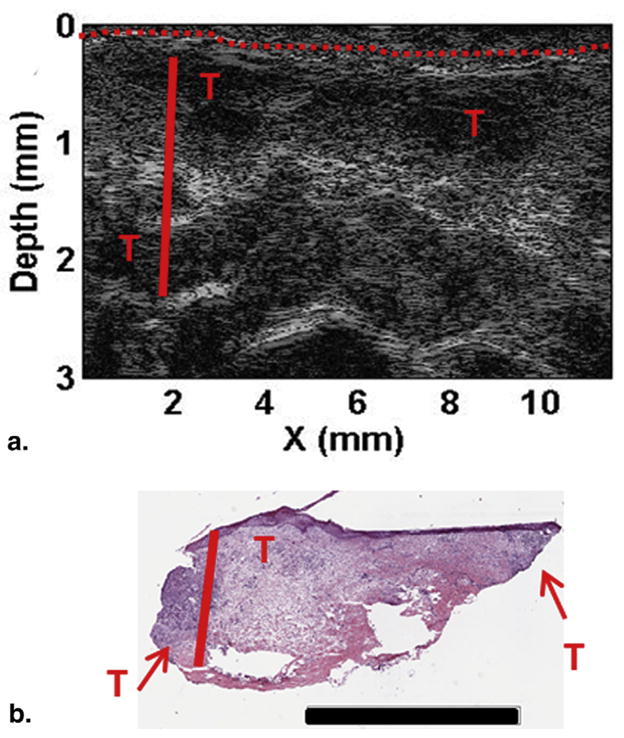
Depth profiling for patient 1. (a) High frequency ultrasound image and (b) H&E staining. Skin surface marked with the red dashed line, depth to the deepest tumor marked with the solid red line, and suspicious areas are marked with red “T”s. Scale bar in (b) corresponds to 3 mm. For interpretation of the references to color in this figure legend, the reader is referred to the web version of this article.
Figure 5 shows results from another patient who had an SCC on the nose. The lesion was visible in both white light (Fig 5a) and 590-nm reflectance (Fig 5b) images. The reconstructed absorption map (Fig 5c) at 590 nm did not show a clear contrast; tumor and surrounding tissue values were similar, although scattering parameter of the tumor at 590 nm (Fig 5d) was lower compared to the surrounding tissue. The calculated StO2 (Fig 5e) and THC (Fig 5f) were lower in the lesion than the surrounding tissue, and both maps showed significant spatial heterogeneity with StO2 varying by 25% and THC varying by 40%.
Figure 5.
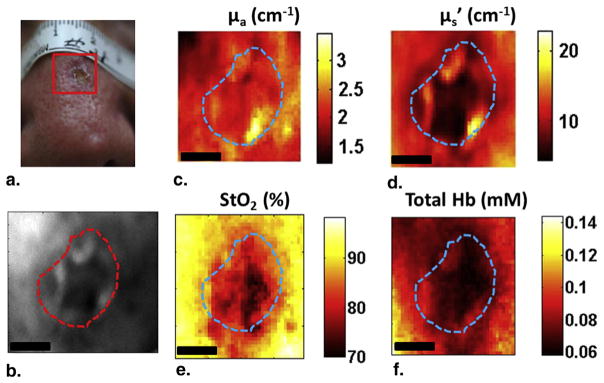
Spatial frequency domain imaging results for patient 2 having squamous cell carcinoma. (a) White light picture of the lesion; (b) reflectance image at 590 nm; (c) absorption map; (d) scattering map; (e) and (f) show the StO2 and total hemoglobin concentration maps, respectively. The dashed line marks tumor boundary. Scale bar corresponds to 2 mm.
Figure 6a shows the HFUS image indicating patient 2 had a tumor 1.86 ± 0.02 mm thick and compared to patient 1 a more defined tumor which can also be seen clearly in the H&E-staining image showing large tumor extent, both laterally and in depth (1.87 mm) (Fig 6b). Because these images show a relatively large tumor at deeper part of the skin, SFDI images at 590 nm may not be able to significantly pick up the tumor contrast bacause light at 590 nm penetrates shallower depths. Thus, we plotted absorption (μa) and scattering (μs′) images at all wavelengths for the BCC tumor (patient 1, Fig 7) and SCC tumor (patient 2, Fig 8). As can be seen clearly, the contrast does not improve but gets worse for patient 1 as wavelength increases (and light penetration increases), because the tumor was more superficial. Tumor contrast increased as the wavelength increased for patient 2, supporting the histology and ultrasound images that show a large well-defined tumor. Skin thickness will affect the optical measurements by SFDI because of partial volume effect. Patient 1 had a thinner layer of skin above the tumor compared to patient 2 (0.34 ± 0.02 mm and 0.60 ± 0.03 mm, respectively); thus, patient 2 measurements will be affected more by the partial volume effect.
Figure 6.
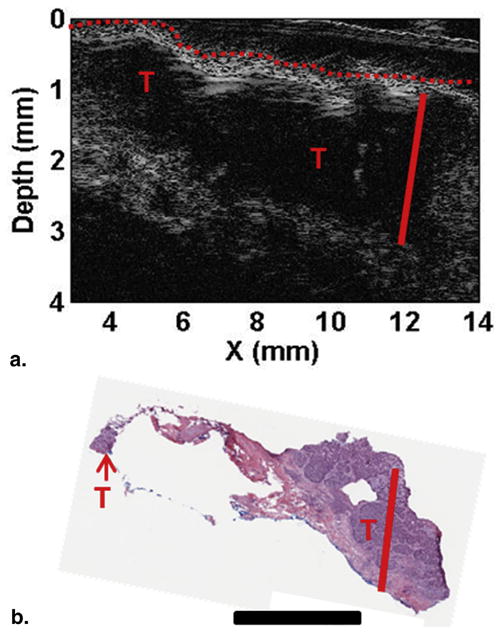
Depth profiling for patient 2. (a) High frequency ultrasound image and (b) H&E staining. Skin surface marked with the red dashed line, depth to deepest tumor marked with the solid red line, and suspicious areas are marked with red “T”s. Scale bar in (b) corresponds to 2 mm. For interpretation of the references to color in this figure legend, the reader is referred to the web version of this article.
Figure 7.
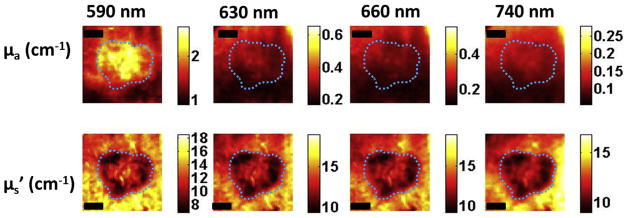
Optical property maps at all wavelengths for patient 1 having basal cell carcinoma. The Dashed line marks tumor boundary. Scale bar corresponds to 2 mm.
Figure 8.
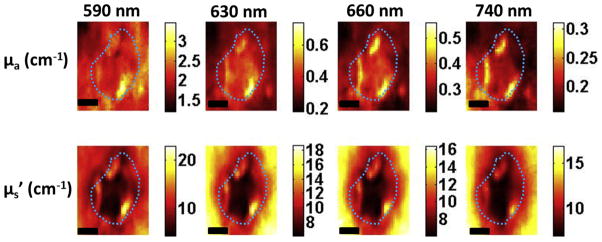
Optical property maps at all wavelengths for patient 2 having squamous cell carcinoma. The Dashed line marks tumor boundary. Scale bar corresponds to 2 mm.
The effective optical penetration depth (δ), defined as δ = (3μa(μa + μs′))−1/2, is of importance to PDT because it gives the rough estimate of the average penetration depth of the treatment light (19). Because the usual photosensitizer for skin PDT is PpIX, which has a small absorption peak of 630 nm in the red wavelength region, the PDT treatment is performed at this wavelength. Therefore, we calculated the optical penetration depth at 630 nm. The δ was smaller in both tumors compared to the surrounding normal, meaning that PDT light would penetrate shallower in tumor compared to the surrounding normal tissue. Patient 1 showed an 18% higher depth of light penetration at 630 nm than patient 2. This difference could result in less treatment light reaching the tumor, indicating the importance of optical property quantification for PDT treatment planning. Knowing the extent of the tumor is important for an effective treatment. It provides thickness information for the clinician to aid in PDT planning. As Figure 4 and Table 1 show, the effective penetration depth of 630-nm light is 1.8 times larger than the thickness of the tumor for patient 1 (3.19 ± 0.51 mm vs. 1.79 mm). However, for patient 2 the effective penetration depth of 630-nm light is only 1.4 times larger than the tumor thickness (2.69 ± 0.73 mm vs. 1.86 mm). These are important pieces of information that clinicians can use to better plan treatment strategies by optimizing the light dose for each patient. By combining information from multiple imaging modalities (SFDI and HFUS), clinicians can have useful information to better plan treatments. We note that there was some crusty skin layer on the tumor of patient 2. This typically resulted in the calculation of highly reduced scattering values because of the multiple index mismatches between tissue and air. Although this may pose as an artifact or outlier in terms of discriminating between healthy and disease tissue, SFDI’s ability to detect this plays a critical role in terms of PDT planning and optimization, because the penetration and interrogation of treatment light will be greatly hampered by this as well.
TABLE 1.
Reconstructed SFDI and HFUS Parameters for Two Patients (Mean ± Standard Deviation [SD])
| Parameter | Patient 1 (BCC)
|
Patient 2 (SCC)
|
||||
|---|---|---|---|---|---|---|
| Tumor
|
Normal
|
P Value | Tumor
|
Normal
|
P Value | |
| Mean ± SD | Mean ± SD | Mean ± SD | Mean ± SD | |||
| Optical absorption at 630 nm (cm−1) | 0.27 ± 0.03 | 0.21 ± 0.02 | <.0001 | 0.41 ± 0.06 | 0.32 ± 0.04 | <.0001 |
| Optical scattering at 630 nm (cm−1) | 11.77 ± 1.20 | 14.97 ± 0.97 | <.0001 | 10.83 ± 2.47 | 13.77 ± 2.62 | <.0001 |
| Optical penetration depth at 630 nm (mm) | 3.19 ± 0.51 | 3.25 ± 0.34 | <.0001 | 2.69 ± 0.73 | 2.74 ± 0.63 | <.0001 |
| StO2 (%) | 82.30 ± 2.75 | 76.85 ± 6.23 | <.0001 | 83.74 ± 4.95 | 89.73 ± 2.60 | <.0001 |
| THC (mmol) | 0.05 ± 0.01 | 0.03 ± 0.01 | <.0001 | 0.07 ± 0.01 | 0.08 ± 0.01 | <.0001 |
| Max thickness-HFUS (mm) | 1.79 ± 0.05 | 1.86 ± 0.02 | ||||
| Max thickness-Mohs (mm) | 1.76 | 1.87 | ||||
BCC, basal cell carcinoma; HFUS, high frequency ultrasound; SFDI, spatial frequency domain imaging; SCC, squamous cell carcinoma.
To quantitatively compare the tumor area to the surrounding normal tissue, an image analysis with a hand-drawing tool function (imfreehand, Matlab; Mathworks, Inc., Natick, MA, USA) was used to choose region of interest (ROI) for both tumor and normal tissue determined from reflectance maps at 590 nm. Statistical indices (mean, standard deviation) of each ROI are summarized in Table 1. Both tumors showed contrasts compared to normal tissue. Tumor ROI showed higher mean absorption parameter but lower mean scattering parameter. The StO2 and THC were higher in the tumor for patient 1, whereas StO2 was lower in the tumor and THC did not show contrast for patient 2. There were also contrast differences between the two tumors. Patient 2 had ~33.5% higher absorption and ~8.7% lower scattering (at 630 nm) than patient 1. The StO2 for both tumors were similar whereas the THC was 40% higher in patient 2, which supports the fact that SCCs are usually well vascularized compared to BCCs (20).
The instrument was designed to provide high spatial uniformity in terms of both projection illumination and collection efficiency. The instrument was tested to have <5% variance in these aspects and the small spatial variance is accounted for and corrected through our instrument calibration procedure. However, nonflat surface geometries can impart errors in the determination of optical properties through SFDI. The depth of focus of both projection and camera can play a significant role in reducing associated errors of this imaging system. For our instrument, tissue within ±2 mm of the image plane would incur no >10% error in optical properties. For the preliminary results presented here, tumors were located on the surfaces with height differences within that range. Moreover, one can apply an approach similar to that suggested by Gioux et al. (21), and correct for the surface curvature effects.
In the present study, we only performed reflectance measurements with the SFDI imaging instrument to quantify intrinsic contrasts. However, the instrument can perform fluorescence imaging as well. By using SFDI in fluorescence imaging mode, PS fluorescence can allow quantification of PS concentration by accurately compensating for light attenuation at both excitation and emission wavelengths (22,23). We have recently applied this approach to demonstrate the quantification of PpIX concentration in BCC and SCC models (22). Fluorescence imaging can also be used for monitoring PDT response because PS fluorescence changes during PDT, and these changes may be indicative of PDT response (10). It should also be noted that the present clinical study involves photoacoustic imaging, which uses optical contrasts at ultrasound resolution and can provide depth-resolved imaging of skin tissue and complement both SFDI and HFUS. However, our photoacoustic laser was highly unstable and required long warm-up times and created lasing issues at the clinics. Thus, we could not obtain photoacoustic measurements for these patients.
CONCLUSIONS
For an effective PDT, knowledge about the lesion thickness (and depth) is desired so that the treatment planning can be optimized accordingly. Moreover, StO2, blood volume, and vasculature affect PDT efficacy; therefore, quantifying these parameters can allow a clinician to assess therapy response earlier and adapt the treatment accordingly to improve outcome. Before using this instrument during therapy, it is necessary to demonstrate its ability to accurately extract these parameters in clinical settings. This pilot study is designed to validate our instrument in a clinical setting. The proposed approach is significant not only for PDT but also for surgery because these noninvasive parameters can provide additional information about the tumor structure and contrast for surgical guidance. SFDI provided optical parameters which can provide intrinsic contrasts and light dosimetry for PDT planning and vascular parameters of StO2 and THC for assessing tissue oxygenation. HFUS provided tumor depth and thickness, which is useful in demarcating tumor spread for surgical guidance and light dose modeling for PDT.
Acknowledgments
This research is partially supported by the American Society for Dermatologic Surgery Cutting Edge Research Grant (CERG, N. Zeitouni), P30CA16056 (Startup grant, U. Sunar) and NCI CA55791 (P01 Program Project Grant).
References
- 1.Ericson MB, Wennberg AM, Larko O. Review of photodynamic therapy in actinic keratosis and basal cell carcinoma. Ther Clin Risk Manag. 2008;4:1–9. [PMC free article] [PubMed] [Google Scholar]
- 2.Kalka K, Merk H, Mukhtar H. Photodynamic therapy in dermatology. J Am Acad Dermatol. 2000;42:389–413. doi: 10.1016/s0190-9622(00)90209-3. [DOI] [PubMed] [Google Scholar]
- 3.Maytin EV, Anand N, Baran C, et al. Enhancement and optimization of PpIX-based photodynamic therapy of skin cancer: translational studies from bench to clinic. Proc SPIE. 2009;7164:71640K–9. [Google Scholar]
- 4.van den Akker JT, de Bruijn HS, Beijersbergen van Henegouwen GM, et al. Protoporphyrin IX fluorescence kinetics and localization after topical application of ALA pentyl ester and ALA on hairless mouse skin with UVB-induced early skin cancer. Photochem Photobiol. 2000;72:399–406. doi: 10.1562/0031-8655(2000)072<0399:pifkal>2.0.co;2. [DOI] [PubMed] [Google Scholar]
- 5.Rhodes LE, de Rie M, Enstrom Y, et al. Photodynamic therapy using topical methyl aminolevulinate vs surgery for nodular basal cell carcinoma: results of a multicenter randomized prospective trial. Arch Dermatol. 2004;140:17–23. doi: 10.1001/archderm.140.1.17. [DOI] [PubMed] [Google Scholar]
- 6.Rhodes LE, de Rie MA, Leifsdottir R, et al. Five-year follow-up of a randomized, prospective trial of topical methyl aminolevulinate photodynamic therapy vs surgery for nodular basal cell carcinoma. Arch Dermatol. 2007;143:1131–1136. doi: 10.1001/archderm.143.9.1131. [DOI] [PubMed] [Google Scholar]
- 7.Busch TM, Xing X, Yu G, et al. Fluence rate-dependent intratumor heterogeneity in physiologic and cytotoxic responses to Photofrin photodynamic therapy. Photochem Photobiol Sci. 2009;8:1683–1693. doi: 10.1039/b9pp00004f. [DOI] [PMC free article] [PubMed] [Google Scholar]
- 8.Zhou X, Pogue BW, Chen B, et al. Pretreatment photosensitizer dosimetry reduces variation in tumor response. Int J Radiat Oncol Biol Phys. 2006;64:1211–1220. doi: 10.1016/j.ijrobp.2005.11.019. [DOI] [PubMed] [Google Scholar]
- 9.Georgakoudi I, Nichols MG, Foster TH. The mechanism of Photofrin photobleaching and its consequences for photodynamic dosimetry. Photochem Photobiol. 1997;65:135–144. doi: 10.1111/j.1751-1097.1997.tb01889.x. [DOI] [PubMed] [Google Scholar]
- 10.Wilson BC, Patterson MS. The physics, biophysics and technology of photodynamic therapy. Phys Med Biol. 2008;53:R61–109. doi: 10.1088/0031-9155/53/9/R01. [DOI] [PubMed] [Google Scholar]
- 11.Henderson BW, Gollnick SO, Snyder JW, et al. Choice of oxygen-conserving treatment regimen determines the inflammatory response and outcome of photodynamic therapy of tumors. Cancer Res. 2004;64:2120–2126. doi: 10.1158/0008-5472.can-03-3513. [DOI] [PubMed] [Google Scholar]
- 12.Cuccia DJ, Bevilacqua F, Durkin AJ, et al. Quantitation and mapping of tissue optical properties using modulated imaging. J Biomed Opt. 2009;14:024012. doi: 10.1117/1.3088140. [DOI] [PMC free article] [PubMed] [Google Scholar]
- 13.Saager RB, Cuccia DJ, Saggese S, et al. A light emitting diode (LED) based spatial frequency domain imaging system for optimization of photodynamic therapy of nonmelanoma skin cancer: quantitative reflectance imaging. Lasers Surg Med. 2013;45:207–215. doi: 10.1002/lsm.22139. [DOI] [PMC free article] [PubMed] [Google Scholar]
- 14.Azhari H. Ultrasound: medical imaging and beyond (an invited review) Curr Pharm Biotechnol. 2012;13:2104–2116. doi: 10.2174/138920112802502033. [DOI] [PubMed] [Google Scholar]
- 15.Marmur ES, Berkowitz EZ, Fuchs BS, et al. Use of high-frequency, high-resolution ultrasound before Mohs surgery official publication for American Society for Dermatologic Surgery. Dermatol Surg. 2010;36:841–847. doi: 10.1111/j.1524-4725.2010.01558.x. [DOI] [PubMed] [Google Scholar]
- 16.Schmid-Wendtner MH, Burgdorf W. Ultrasound scanning in dermatology. Arch Dermatol. 2005;141:217–224. doi: 10.1001/archderm.141.2.217. [DOI] [PubMed] [Google Scholar]
- 17.Gruber JD, Paliwal A, Krishnaswamy V, et al. System development for high frequency ultrasound-guided fluorescence quantification of skin layers. J Biomed Opt. 2010;15:026028. doi: 10.1117/1.3374040. [DOI] [PMC free article] [PubMed] [Google Scholar]
- 18.Moore JV, Allan E. Pulsed ultrasound measurements of depth and regression of basal cell carcinomas after photodynamic therapy: relationship to probability of 1-year local control. Br J Dermatol. 2003;149:1035–1040. doi: 10.1111/j.1365-2133.2003.05558.x. [DOI] [PubMed] [Google Scholar]
- 19.Jacques SL, editor. Optics of light dosimetry for PDT in superficial lesions versus bulky tumors. Proc SPIE. 2002;4612:59–68. [Google Scholar]
- 20.Chin CW, Foss AJ, Stevens A, et al. Differences in the vascular patterns of basal and squamous cell skin carcinomas explain their differences in clinical behaviour. J Pathol. 2003;200:308–313. doi: 10.1002/path.1363. [DOI] [PubMed] [Google Scholar]
- 21.Gioux S, Mazhar A, Cuccia DJ, et al. Three-dimensional surface profile intensity correction for spatially modulated imaging. J Biomed Opt. 2009;14:034045. doi: 10.1117/1.3156840. [DOI] [PMC free article] [PubMed] [Google Scholar]
- 22.Sunar U, Rohrbach D, Morgan J, et al. Quantification of PpIX concentration in basal cell carcinoma and squamous cell carcinoma models using spatial frequency domain imaging. Biomed Opt Express. 2013;4:531–537. doi: 10.1364/BOE.4.000531. [DOI] [PMC free article] [PubMed] [Google Scholar]
- 23.Saager RB, Cuccia DJ, Saggese S, et al. Quantitative fluorescence imaging of protoporphyrin IX through determination of tissue optical properties in the spatial frequency domain. J Biomed Opt. 2011;16:126013. doi: 10.1117/1.3665440. [DOI] [PMC free article] [PubMed] [Google Scholar]


