Abstract
In vivo quantification of extracellular pH (pHe) in tumour may provide a useful biomarker for tumour cell metabolism. In this study, we assess the viability of continuous-wave electron paramagnetic resonance (CW-EPR) spectroscopy with a pH-sensitive nitroxide to measure extracellular tumour pH in the mouse model. 750 MHz CW-EPR spectroscopy of C3H HeJ mice hind leg squamous cell tumour was performed after intra-venous tail vein injection of pH-sensitive nitroxide (R-SG) during stages of normal tumour growth, and in response to a single 10 Gy dose of X-ray irradiation. An inverse relationship was observed between tumour volume and pHe value, whereby during normal tumour growth a constant reduction in pHse was observed. This relationship was disrupted by X-ray irradiation, and from 2–3 days post exposure, a transitory increase pHe was observed. In this study we demonstrated the viability of CW-EPR spectroscopy using R-SG nitroxide to obtain high sensitivity pH measurements in mouse tumour model with accuracy < 0.1 pH units. In addition, measured changes in pHe in response to X-ray irradiation suggest this may offer a useful method for assessing physiological change in response to existing and novel cancer therapies.
Keywords: EPR, pH, Tumour, Radiotherapy
INTRODUCTION
Disruption of acid-base homeostasis in solid tumours has been well documented (1–3). The higher demand for energy and for the biosynthesis of nucleotides in cancer cells, is met by a process of aerobic glycolysis; the so called ‘Warburg effect’, which results in ATP production through non-oxidative breakdown of glucose (4,5), and leads to increased extracellular lactate and H+ levels due to glucose catabolism, and decreased perfusion due to immature vasculature within the tumour, resulting in an increase in acidity within the extracellular space. Unlike normal cells, tumour cells have been shown to proliferate in acidic environments (6,7). As such, the diffusion of H+ ions along the concentration gradient from tumour to adjacent normal tissue may be one mechanism facilitating the progression of tumour growth. Additionally, the excess carbon used in lactate production may result in faster incorporation of carbon into biomass, thereby facilitating cell proliferation (5). The adverse microenvironment resulting from the reduction in extracellular pH (pHe), along with increased levels of cellular hypoxia, has a profound effect on the effectiveness of cytotoxic anti-cancer drugs, and provides an increased therapeutic resistance (8). Therefore, improvement in therapeutic outcome may depend on the effectiveness of treatment approaches that specifically target cells in low pHe environments, or those that can increase tumour pHe (2,9–12).
In recent years, several approaches to pH imaging and quantification have been explored, including positron emission tomography (PET) (1), fluorophore lifetime imaging (13), and a number of different MRI based approaches, including spectroscopy (14,15), chemical exchange saturation transfer (CEST) (1,16,17), and proton-electron double-resonance imaging (PEDRI) (18–20).
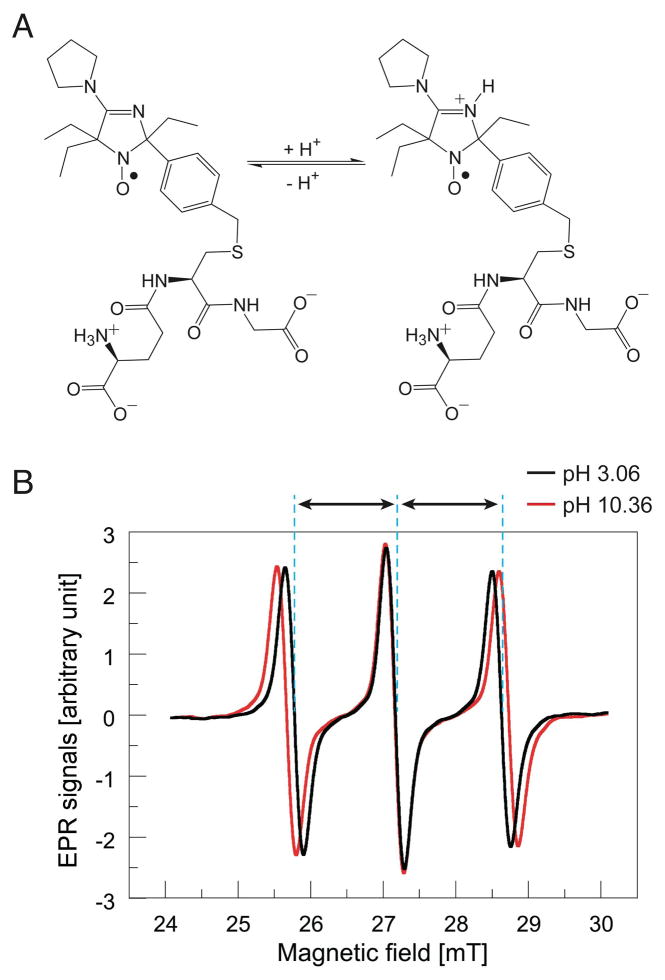
More recently, the use of an L-band (1.2 GHz) electron paramagnetic resonance (EPR) imaging system with a pH-sensitive imidazoline nitroxide, R-SG (Fig. 1A), has been demonstrated as a viable alternative for application in animal model studies (18), providing good sensitivity to pHe, which unlike PET imaging does not require the use of radionuclides, and without the potential complications of mixed contrast effects that have be shown to occur in CEST imaging due to direct saturation and magnetic transfer effects (21). The process of calculating pH by measuring the hyperfine splitting constant (HFC) only offers a comparatively simple approach, and EPR has the added advantage that by using alternative nitroxide spin probes, other biophysical parameters such as pO2 can be measured, which along with pH is recognized as a biomarker for tumour viability. As such, EPR represents a potentially useful pre-clinical tool for the assessment of tumour viability in response to novel therapeutics. In this work, we assess the use of a 750 MHz continuous-wave (CW) EPR, which provides a greater sample penetration depth than the 1.2 GHz system, and R-SG nitroxide for pHe monitoring in tumour-bearing mice during normal tumour growth, and in response to X-ray irradiation.
Figure 1.
(A) Molecular configuration of protonated and non-protonated forms of pH sensitive spin probe R-SG: 2-(4-((2-(4-Amino-4-carboxybutanamido)-3-(carboxymethylamino)-3-oxoproylthio)methyl)phenyl)-4-pyrrolidino-2,5,5-triethyl-2,5-dihydro-1H-imidazol-1-oxyl (this compound is abbreviated as R-SG). (B) pH dependent spectra of R-SG. Hyperfine coupling constant (HFC), defined as half the distance between first and third spectra, varies according local pH.
MATERIALS AND METHODS
Nitroxide spin probes
The pH-sensitive nitroxide; R-SG, (2-(4-((2-(4-amino-4-carboxybutanamido)-3-(carboxymethylamino)-3-oxoproylthio)methyl)phenyl)-4-pyrrolidino-2,5,5-triethyl-2,5-dihydro-1H-imidazol-1-oxyl) was synthesized as previously described (18).
In vitro phantom measurement and pH calibration
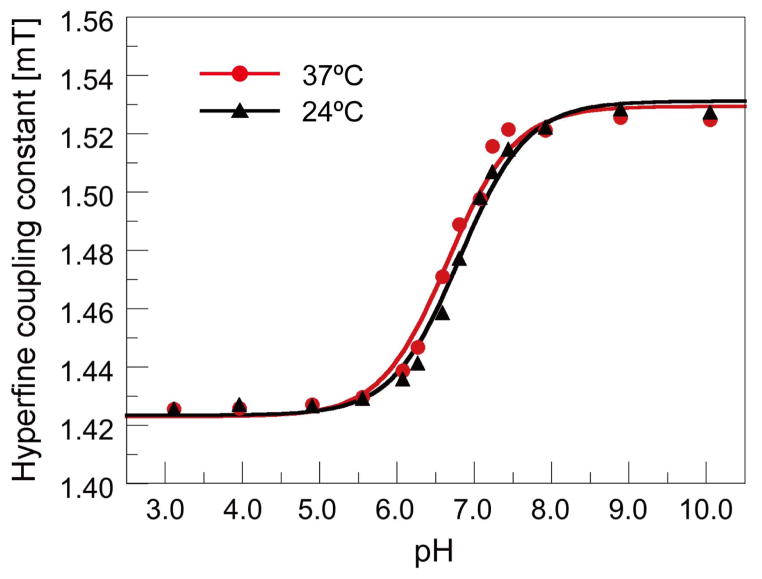
In vitro spectroscopic measurements of HFC were performed with the following measurement parameters: scan time 3 s, magnetic field scanning 5 mT, magnetic field modulation 0.15 mT, modulation frequency 90 kHz, time-constant of a lock-in amplifier 10 ms, and number of data points 512/scan, and number of averaging 30. The value of HFC was measured as half the difference in magnetic field between low- and high-field components of the EPR spectra (Fig. 1B). The relationship between pH and HFC was determined by way of repeated spectroscopic measurement (n=5) of fourteen different in vitro phantoms of known pH value of equivalent molecular concentration of R-SG / phosphate buffer solution (R-SG / PBS – 1 mM, 100 μL) across a physiologically applicable pH range. After repeated spectroscopic measurement of the fourteen different pH phantoms, average HFC values were used to construct a titration curve equating HFC with pH, which was then used for calibration of subsequent in vivo HFC measurements in mouse tumour.
CW-EPR spectroscopy
In vitro spectroscopic measurements of R-SG solution phantoms were performed using a 750 MHz CW-EPR spectrometer (22), with the following parameters: scan time 3 s, magnetic field scanning 6 mT, magnetic field modulation 0.25 mT, modulation frequency 90 kHz, time-constant of a lock-in amplifier 10 ms, and number of data points 2048/scan, and number of averaging 40. The tumour-included thigh of a subject mouse was inserted to an RF resonator (22 mm in diameter, 30 mm in length) of a 750 MHz CW-EPR spectrometer.
Mouse preparation
Six-week old male C3H HeJ mice were purchased (Japan SLC Hamamatsu, Japan), and used for all control and tumour model experiments. Mice were kept in a circadian controlled environment, with access to food and water ad libitum. All experiments were performed in accordance with the guidelines of the ‘Law for The Care and Welfare of Animals in Japan’ and approved by the Animal Experiment Committee of Hokkaido University, and under isoflurane sedations levels of 1.5–3%.
Tumour cell preparation
Murine squamous carcinoma SCC VII cells derived from C3H/He mice, were kindly obtained from Dr. S. Masunaga, Kyoto University and were maintained in vitro in α-MEM medium (Gibco-BRL/Invitrogen, Carlsbad, CA) supplemented with 10% fetal bovine serum (Filtron, Brooklyn, Australia) at 37°C in 5% CO2/95% air.
Validation of methodology
To assess the accuracy of EPR based measurement of pHe, a series of in vitro measurements were obtained using both EPR and pH electrodes (CyberScan pH 1500, Eutech Instruments, Singapore, with a pH sensitivity of ± 0.002) across a range of R-SG / PBS pH phantoms.
Based on earlier mouse experiments, an intravenous tail vein injection of 50 mM, 100 μL (0.22 mmol/kg body weight) R-SG / PBS was found to provide adequate signal strength for in vivo measurements, with an in vivo half-life of approximately 11 minutes. However, to assess the potential toxicity of R-SG, a subset of healthy mice (n=6) were injected with a high concentration R-SG / PBS (100 mM, 100 μL (0.44 mmol/kg body weight)) on day 0, and their body weights measured daily for one week, along with those of an additional 6 control mice that received no R-SG injection.
pHe change during normal tumour growth
Prior to injection of tumour cells (Day 0), C3H HeJ mice (n=6) underwent EPR scanning of the right hind leg. Subsequently, each mouse was injected with suspended serum-free culture medium containing approximately one million squamous carcinoma cells (SCC VII) directly into the right hind leg thigh muscle. For the next 11 days, scanning was performed daily for each mouse, and tumour volume (V) was estimated using linear calipers and the relationship: .
pH response to X-ray irradiation
In a separate experiment, C3H HeJ mice (n=6) were injected with an equivalent squamous cell solution, and were monitored until a maximum tumour dimension of approximately 20 mm was observed. At this time, mice underwent an initial EPR scan (Day X), and were subsequently exposed to 10 Gy of X-rays to the tumour-bearing thigh only. EPR measurements were then performed daily for an additional one-week period.
For irradiation of transplanted tumors, anesthetized mice were shielded with lead panels, except for the tumor-bearing thigh. X-irradiation was performed with a Shimadzu PANTAK HF-350 X-ray generator with a 0.5 mm Al + 0.5 mm Cu filter at a dose rate of 0.85 Gy/min at 200 kVp, 20 mA.
Statistical analysis
Accuracy of pHe measurements was defined as EPR-based pHe value minus electrode-based pHe value. Additionally, Pearson product-moment correlation coefficient r was obtained between pHe values measured with EPR and those obtained via electrode. The precision of measurements was calculated as the average of the standard deviation of repeat measurements.
Analysis of mouse body weight as an indicator of potential R-SG toxicity was performed using repeated 2-Way ANOVA (SPSS v20.1) based on calculated sample size (G*Power v3.1.7) (23) of R-SG injected mice and control mice. In assessing the significance of pHe changes during normal tumour growth, as well as in response to X-ray irradiation, the student t-test was used to compare the initial pHe measurements (pHe values before tumor cell implantation (Day 0) and / or before X-ray irradiation to tumour (Day X) with measurements on subsequent days (Day N). A statistical significance level of p < 0.05 was used for all statistical testing in this article.
RESULTS
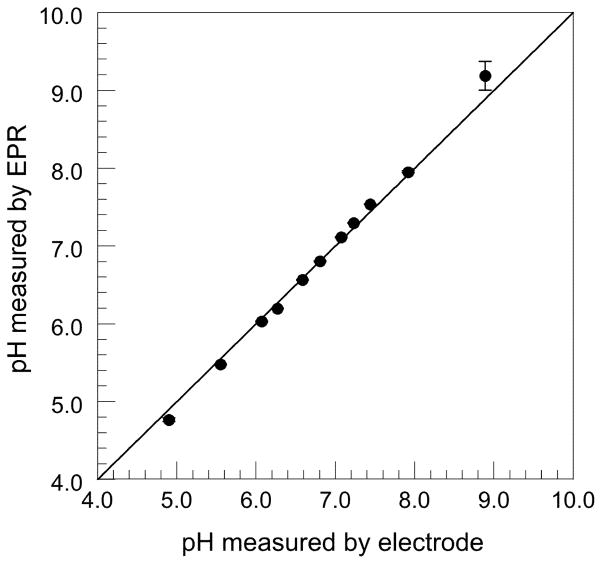
Figure 2 shows the relation between the measured HFC values and pH values measured with the pH electrode meter. This titration curve was used as a calibration curve to convert the HFC values of R-SG to pH values. Measurement of pH phantoms across the range of 5.55 to 7.92 pH using both EPR spectroscopy and pH electrode, showed high linear correlation, with a calculated Pearson product-moment correlation coefficient r of 0.9992 (n=9) (Fig. 3). We found EPR based measurements were accurate to within 0.1 pH units in the range of 5.55 to 7.92, with an average precision of 0.012 pH units, based on the a standard deviation of repeat measures. At marginal pH values (4.90 and 8.89), the differences of EPR-based and electrode-based pHe values were greater than 0.1 pH units, due to the non-linearity of the pH / HFC calibration curve at the upper and lower extremes (Fig. 2).
Figure 2.
R-SG titration curve. Each point represents the average of 5 HFC measurements using in vitro capillary tube phantoms containing R-SG / PBS of known pH value, allowing calibration of in vivo mouse model HFC measurements to estimates of pHe.
Figure 3.
Comparison of in vitro phantom pH values obtained with both EPR spectroscopy and pH electrodes, demonstrating < 0.1 pH deviation between methods across the pH range of 5.55–7.92.
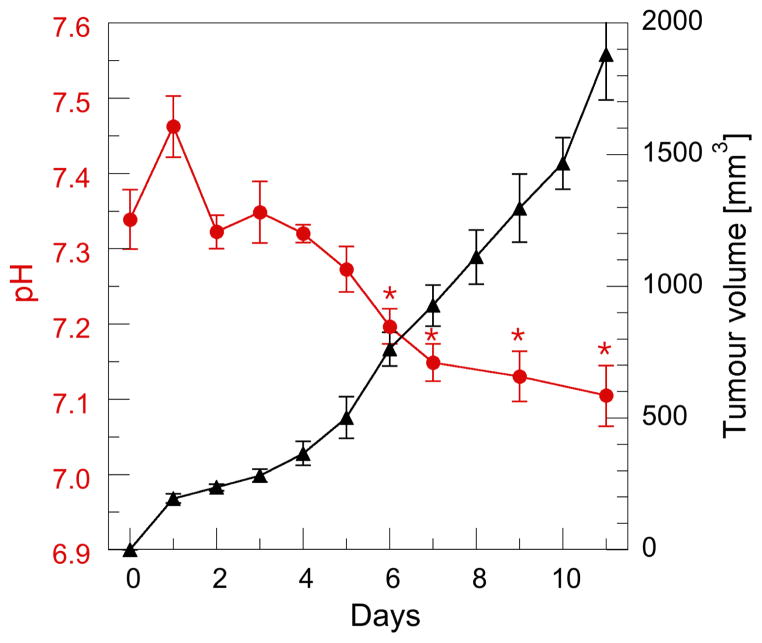
High concentration R-SG / PBS injection in a subset of healthy mice to assess R-SG toxicity, resulted in zero mortality rates. Repeated 2-Way ANOVA of daily body weight for R-SG and control mice demonstrated no-significant change in mice body weight between the two groups (F = 0.59, p = 0.46). However, a trend toward interaction was observed between the two groups and time (F = 2.13, p = 0.051). The relationship between pHe and tumour volume is presented in Fig. 4, whereby an approximately linear daily increase in volume corresponded with an initial increase in pHe on day 1, and a subsequent decrease thereafter. Independent Student t-tests of pHe data before squamous cell implantation (Day 0), with those of Day N, revealed statistical significance for each day after Day 6.
Figure 4.
Relationship between tumour volume and pHe during normal tumour growth. Each data point represents the mean of 6 mice with standard error of the mean (SEM) displayed. Day 0 - prior to squamous cell injection into the right hind leg. An inverse relationship between tumour volume and pHe was observed in all mice from Day 3. Significant difference in pHe between Day 0 and Day N is shown * (p < 0.05).
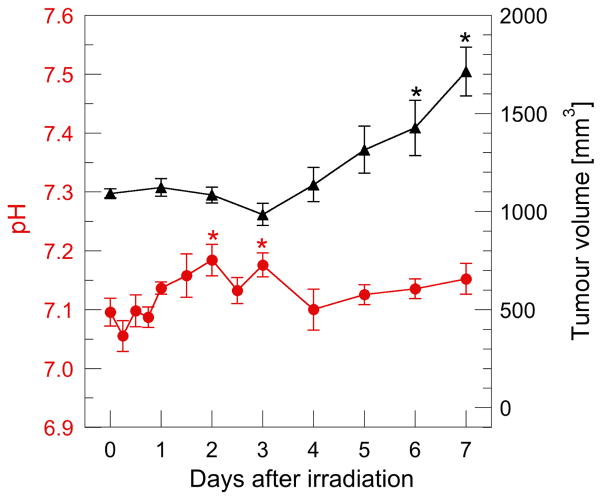
Our results highlight retardation in tumour growth response to X-ray irradiation (Fig. 5), whereby Student’s t-test analysis of tumour volume between Day 0 (measured before irradiation) and Day N, showed a delay of several days before a significant increase was observed. In addition, a significant difference in pHe, was observed two and three days post X-ray irradiation (p < 0.05). Individual mouse tumour pH without radiation as well as mice that received a single dose is presented in Fig. S1 (Supplementary material).
Figure 5.
Tumour regrowth and pHe in irradiated mice. The mean tumour volume before irradiation was approximately equal to the non-irradiated group at Day 9 in Fig. 4. Each data point represents the mean of 6 mice with standard error of the mean displayed. Significant difference in pHe and tumour volume between Day 0 (measured before irradiation) and Day N is shown * (p < 0.05).
DISCUSSION
In this work we demonstrated the viability of CW-EPR spectroscopy and nitroxide spin probe R-SG, to obtain longitudinal in vivo measurements of pHe in mouse tumour model, as well as investigate the effects of X-ray irradiation on pHe. Based on zero mortality rate, and no statistically significant difference in weight loss over a one-week period between control mice and mice that received a single high-concentration intravenous injection of R-SG / PBS, we conclude that any toxicity effects of the R-SG are negligible, and not likely to confound the observed results in this study.
The accuracy of EPR measured pHe values was also validated in vitro across a physiologically applicable pH range by way of electrode measurement of capillary tube phantoms, giving an accuracy to within 0.1 pH units in the pH range of 5.55–7.92, with an average precision of 0.012 pH units, which is comparable to or better than recent CEST based techniques (16,24). Reduction in accuracy outside this pH rage is the result of non-linearity of the calibration curve for pH values not in vicinity of pKa (pH = 6.65). However, the loss of sensitivity in EPR based pH measurement at these extreme values is most likely not relevant for in vivo mouse model studies.
The longitudinal in vivo measurements obtained in this study highlight the inverse relationship between pHe, and tumour growth. This observation was observed in both the group-averaged data (Fig. 4) as well individual mouse data (Fig. S1). Our observation may correlate with the increased inter-capillary distance, which occurs during tumour growth (25), and the subsequent effect that reduced local perfusion and hypoxia, as well as hyperglycolytic activity and extracellular lactate build up has on pHe (26–29). A previous reported study using EPR oxymetry in the same SCCVII tumour model, demonstrated an inverse relationship in tumor pO2 with volume, most notably 5–8 day after tumour inoculation (30). In combination with the present study, this result suggests an almost simultaneous decrease of both tumour pO2 and pHe may occur with increase in tumour volume, and highlights the concomitant change to glycolytic phenotype with reduced tumour oxygenation and subsequent acidosis, providing the desired biological conditions for proliferation of squamous cell carcinoma in living animals.
Despite previous studies showing increased radioresistance and a reduction in radiation-induced apoptosis in acidotic and hypoxic environments (29,31,32), intra-tumoural pHe is thought to be a useful parameter of response to antitumour treatment, as well as a parameter of distinction between normal and neoplastic environments. Previous work by Lindner et al. demonstrated that pHe decreased significantly in response to treatment with doxorubicin, due to tumour lysis and release of intracellular lactate (10). In the present study however, we observed a temporary reversal in the relationship between pHe and tumour growth in response to X-ray irradiation (Fig. 5), which culminated in a statistically significant increase in pHe two days after irradiation; a result which also correlates with the previously mentioned EPR oximetry study of pO2 changes in response to radiation (30). Individual mouse response to tumour X-ray irradiation also demonstrated a suppression of pHe reduction, whereas the subsequent increase in pHe appears less well defined. Previous work investigating radiation induced blood flow changes in human tumours demonstrated a short term improvement in intra-tumoural blood circulation in response to a single dose of X-ray irradiation (33). Similarly, an increase in pHe was observed, albeit in combination with hyperthermia, in patients who received tumour X-ray irradiation (34). In context to the results of this study, it is speculated that upregulation of tumour circulation by X-ray irradiation (35,36), may have washed lactate out of the tumour microenvironment, resulting in elevated tumoural pHe during the period of growth delay.
In contrast to alternative in vivo approaches to pHe measurement, EPR is limited in application to measurement of biological samples and small animals, due to the physical constraints of signal attenuation by sample tissue at higher microwave frequencies and loss of sensitivity at lower frequencies. A 750-MHz EPR system provides a good compromise between these constraints, allowing pH measurement accurate to within 0.1 pH units, with sufficient signal penetration depth to image an entire mouse. In this regard, it represents an effective pre-clinical imaging modality. However, one caveat with the current spectroscopic methodology is the inclusion of normal tissue within the sampled volume. The measured HFC represents the integration of all measured nitroxide signal within the sampled volume, and as such the pHe of small tumour volumes might be overestimated. To further address this issue, our future work will focus on 3D EPR imaging to assess spatial variance of pHe throughout mice tumour model and in response to therapeutics.
Supplementary Material
Acknowledgments
This work was supported in part by a grant (21360193 to H.H.) from Japan Society for the Promotion of Science (JSPS), NEXT program (LR002 to H.H.) from JSPS and a grant from NIH (EB014542 to V.V.K.).
Abbreviations used
- pHe
extracellular pH
- CW-EPR
continuous-wave electron paramagnetic resonance
- R-SG
(2-(4-((2-(4-amino-4-carboxybutanamido)-3-(carboxymethylamino)-3-oxoproylthio)methyl)phenyl)-4-pyrrolidino-2,5,5-triethyl-2,5-dihydro-1H-imidazol-1-oxyl)
- CEST
chemical exchange saturation transfer
- PEDRI
proton-electron double-resonance imaging
- PBS
phosphate buffer solution
- SEM
standard error of the mean
- HFC
hyperfine coupling
- pKa
acid dissociation constant
- pO2
partial pressure of oxygen
References
- 1.Zhang X, Lin Y, Gillies RJ. Tumor pH and its measurement. J Nucl Med. 2010;51(8):1167–1170. doi: 10.2967/jnumed.109.068981. [DOI] [PMC free article] [PubMed] [Google Scholar]
- 2.Stubbs M, McSheehy PM, Griffiths JR, Bashford CL. Causes and consequences of tumour acidity and implications for treatment. Mol Med Today. 2000;6(1):15–19. doi: 10.1016/s1357-4310(99)01615-9. [DOI] [PubMed] [Google Scholar]
- 3.Gerweck LE, Seetharaman K. Cellular pH gradient in tumor versus normal tissue: potential exploitation for the treatment of cancer. Cancer Res. 1996;56(6):1194–1198. [PubMed] [Google Scholar]
- 4.Webb BA, Chimenti M, Jacobson MP, Barber DL. Dysregulated pH: a perfect storm for cancer progression. Nat Rev Cancer. 2011;11(9):671–677. doi: 10.1038/nrc3110. [DOI] [PubMed] [Google Scholar]
- 5.Vander Heiden MG, Cantley LC, Thompson CB. Understanding the Warburg effect: the metabolic requirements of cell proliferation. Science. 2009;324(5930):1029–1033. doi: 10.1126/science.1160809. [DOI] [PMC free article] [PubMed] [Google Scholar]
- 6.Robey IF, Baggett BK, Kirkpatrick ND, Roe DJ, Dosescu J, Sloane BF, Hashim AI, Morse DL, Raghunand N, Gatenby RA, Gillies RJ. Bicarbonate increases tumor pH and inhibits spontaneous metastases. Cancer Res. 2009;69(6):2260–2268. doi: 10.1158/0008-5472.CAN-07-5575. [DOI] [PMC free article] [PubMed] [Google Scholar]
- 7.Gatenby RA, Gillies RJ. Why do cancers have high aerobic glycolysis? Nat. Rev Cancer. 2004;4(11):891–899. doi: 10.1038/nrc1478. [DOI] [PubMed] [Google Scholar]
- 8.Skarsgard LD, Acheson DK, Vinczan A, Wouters BG, Heinrichs BE, Loblaw DA, Minchinton AI, Chaplin DJ. Cytotoxic effect of RB 6145 in human tumour cell lines: dependence on hypoxia, extra- and intracellular pH and drug uptake. Br J Cancer. 1995;72(6):1479–1486. doi: 10.1038/bjc.1995.533. [DOI] [PMC free article] [PubMed] [Google Scholar]
- 9.Adams DJ, Morgan LR. Tumor physiology and charge dynamics of anticancer drugs: implications for camptothecin-based drug development. Current Med Chem. 2011;18(9):1367–1372. doi: 10.2174/092986711795029609. [DOI] [PMC free article] [PubMed] [Google Scholar]
- 10.Lindner D, Raghavan D. Intra-tumoural extra-cellular pH: a useful parameter of response to chemotherapy in syngeneic tumour lines. Br J Cancer. 2009;100(8):1287–1291. doi: 10.1038/sj.bjc.6605022. [DOI] [PMC free article] [PubMed] [Google Scholar]
- 11.Kozin SV, Shkarin P, Gerweck LE. The cell transmembrane pH gradient in tumors enhances cytotoxicity of specific weak acid chemotherapeutics. Cancer Res. 2001;61(12):4740–4743. [PubMed] [Google Scholar]
- 12.Prescott DM, Charles HC, Poulson JM, Page RL, Thrall DE, Vujaskovic Z, Dewhirst MW. The relationship between intracellular and extracellular pH in spontaneous canine tumors. Clin Cancer Res. 2000;6(6):2501–2505. [PubMed] [Google Scholar]
- 13.Hassan M, Riley J, Chernomordik V, Smith P, Pursley R, Lee SB, Capala J, Gandjbakhche AH. Fluorescence lifetime imaging system for in vivo studies. Mol Imaging. 2007;6(4):229–236. [PMC free article] [PubMed] [Google Scholar]
- 14.Hashim AI, Zhang X, Wojtkowiak JW, Martinez GV, Gillies RJ. Imaging pH and metastasis. NMR Biomed. 2011;24(6):582–591. doi: 10.1002/nbm.1644. [DOI] [PMC free article] [PubMed] [Google Scholar]
- 15.Gallagher FA, Kettunen MI, Day SE, Hu DE, Ardenkjaer-Larsen JH, Zandt R, Jensen PR, Karlsson M, Golman K, Lerche MH, Brindle KM. Magnetic resonance imaging of pH in vivo using hyperpolarized 13C-labelled bicarbonate. Nature. 2008;453(7197):940–943. doi: 10.1038/nature07017. [DOI] [PubMed] [Google Scholar]
- 16.Sheth VR, Li Y, Chen LQ, Howison CM, Flask CA, Pagel MD. Measuring in vivo tumor pHe with CEST-FISP MRI. Magn Reson Med. 2012;67(3):760–768. doi: 10.1002/mrm.23038. [DOI] [PMC free article] [PubMed] [Google Scholar]
- 17.Sun PZ, Cheung JS, Wang E, Lo EH. Association between pH-weighted endogenous amide proton chemical exchange saturation transfer MRI and tissue lactic acidosis during acute ischemic stroke. J Cereb Blood Flow Metab. 2011;31(8):1743–1750. doi: 10.1038/jcbfm.2011.23. [DOI] [PMC free article] [PubMed] [Google Scholar]
- 18.Bobko AA, Eubank TD, Voorhees JL, Efimova OV, Kirilyuk IA, Petryakov S, Trofimiov DG, Marsh CB, Zweier JL, Grigor’ev IA, Samouilov A, Khramtsov VV. In vivo monitoring of pH, redox status, and glutathione using L-band EPR for assessment of therapeutic effectiveness in solid tumors. Magn Reson Med. 2012;67(6):1827–1836. doi: 10.1002/mrm.23196. [DOI] [PMC free article] [PubMed] [Google Scholar]
- 19.Khramtsov VV, Caia GL, Shet K, Kesselring E, Petryakov S, Zweier JL, Samouilov A. Variable Field Proton-Electron Double-Resonance Imaging: Application to pH mapping of aqueous samples. J Magn Reson. 2010;202(2):267–273. doi: 10.1016/j.jmr.2009.11.017. [DOI] [PMC free article] [PubMed] [Google Scholar]
- 20.Efimova OV, Sun Z, Petryakov S, Kesselring E, Caia GL, Johnson D, Zweier JL, Khramtsov VV, Samouilov A. Variable radio frequency proton-electron double-resonance imaging: application to pH mapping of aqueous samples. J Magn Reson. 2011;209(2):227–232. doi: 10.1016/j.jmr.2011.01.011. [DOI] [PMC free article] [PubMed] [Google Scholar]
- 21.Dula AN, Smith SA, Gore JC. Application of Chemical Exchange Saturation Transfer (CEST) MRI for Endogenous Contrast at 7 Tesla. J Neuroimaging. 2013;23(4):526–532. doi: 10.1111/j.1552-6569.2012.00751.x. [DOI] [PMC free article] [PubMed] [Google Scholar]
- 22.Sato-Akaba H, Kuwahara Y, Fujii H, Hirata H. Half-life mapping of nitroxyl radicals with three-dimensional electron paramagnetic resonance imaging at an interval of 3. seconds Anal Chem. 2009;81(17):7501–7506. doi: 10.1021/ac901169g. [DOI] [PubMed] [Google Scholar]
- 23.Faul F, Erdfelder E, Lang AG, Buchner A. G*Power 3: a flexible statistical power analysis program for the social, behavioral, and biomedical sciences. Behav Res Meth. 2007;39(2):175–191. doi: 10.3758/bf03193146. [DOI] [PubMed] [Google Scholar]
- 24.Sheth VR, Liu G, Li Y, Pagel MD. Improved pH measurements with a single PARACEST MRI contrast agent. Contrast Media Mol Imaging. 2012;7(1):26–34. doi: 10.1002/cmmi.460. [DOI] [PMC free article] [PubMed] [Google Scholar]
- 25.Thomlinson RH, Gray LH. The histological structure of some human lung cancers and the possible implications for radiotherapy. Br J Cancer. 1955;9(4):539–549. doi: 10.1038/bjc.1955.55. [DOI] [PMC free article] [PubMed] [Google Scholar]
- 26.Gillies RJ, Raghunand N, Karczmar GS, Bhujwalla ZM. MRI of the tumor microenvironment. J Magn Reson Imaging. 2002;16(4):430–450. doi: 10.1002/jmri.10181. [DOI] [PubMed] [Google Scholar]
- 27.Parkins CS, Stratford MR, Dennis MF, Stubbs M, Chaplin DJ. The relationship between extracellular lactate and tumour pH in a murine tumour model of ischaemia-reperfusion. Br J Cancer. 1997;75(3):319–323. doi: 10.1038/bjc.1997.53. [DOI] [PMC free article] [PubMed] [Google Scholar]
- 28.Svastova E, Hulikova A, Rafajova M, Zat’ovicova M, Gibadulinova A, Casini A, Cecchi A, Scozzafava A, Supuran CT, Pastorek J, Pastorekova S. Hypoxia activates the capacity of tumor-associated carbonic anhydrase IX to acidify extracellular pH. FEBS Lett. 2004;577(3):439–445. doi: 10.1016/j.febslet.2004.10.043. [DOI] [PubMed] [Google Scholar]
- 29.Wachsberger P, Burd R, Dicker AP. Tumor response to ionizing radiation combined with antiangiogenesis or vascular targeting agents: exploring mechanisms of interaction. Clin Cancer Res. 2003;9(6):1957–1971. [PubMed] [Google Scholar]
- 30.Fujii H, Sakata K, Katsumata Y, Sato R, Kinouchi M, Someya M, Masunaga S, Hareyama M, Swartz HM, Hirata H. Tissue oxygenation in a murine SCC VII tumor after X-ray irradiation as determined by EPR spectroscopy. Radiother Oncol. 2008;86(3):354–360. doi: 10.1016/j.radonc.2007.11.020. [DOI] [PMC free article] [PubMed] [Google Scholar]
- 31.Park HJ, Lee SH, Chung H, Rhee YH, Lim BU, Ha SW, Griffin RJ, Lee HS, Song CW, Choi EK. Influence of environmental pH on G2-phase arrest caused by ionizing radiation. Radiat Res. 2003;159(1):86–93. doi: 10.1667/0033-7587(2003)159[0086:ioepog]2.0.co;2. [DOI] [PubMed] [Google Scholar]
- 32.Lee HS, Park HJ, Lyons JC, Griffin RJ, Auger EA, Song CW. Radiation-induced apoptosis in different pH environments in vitro. Int J Radiat Oncol Biol Phys. 1997;38(5):1079–1087. doi: 10.1016/s0360-3016(97)00073-4. [DOI] [PubMed] [Google Scholar]
- 33.Mantyla MJ, Toivanen JT, Pitkanen MA, Rekonen AH. Radiation-induced changes in regional blood flow in human tumors. Int J Radiati Oncol Biol Phys. 1982;8(10):1711–1717. doi: 10.1016/0360-3016(82)90291-7. [DOI] [PubMed] [Google Scholar]
- 34.Wike-Hooley JL, Van der Zee J, van Rhoon GC, Van den Berg AP, Reinhold HS. Human tumour pH changes following hyperthermia and radiation therapy. Eur J Cancer Clin Oncol. 1984;20(5):619–623. doi: 10.1016/0277-5379(84)90006-3. [DOI] [PubMed] [Google Scholar]
- 35.Sonveaux P, Dessy C, Brouet A, Jordan BF, Gregoire V, Gallez B, Balligand JL, Feron O. Modulation of the tumor vasculature functionality by ionizing radiation accounts for tumor radiosensitization and promotes gene delivery. FASEB J. 2002;16(14):1979–1981. doi: 10.1096/fj.02-0487fje. [DOI] [PubMed] [Google Scholar]
- 36.Crokart N, Jordan BF, Baudelet C, Ansiaux R, Sonveaux P, Gregoire V, Beghein N, DeWever J, Bouzin C, Feron O, Gallez B. Early reoxygenation in tumors after irradiation: determining factors and consequences for radiotherapy regimens using daily multiple fractions. Int J Radiat Oncol Biol Phys. 2005;63(3):901–910. doi: 10.1016/j.ijrobp.2005.02.038. [DOI] [PubMed] [Google Scholar]
Associated Data
This section collects any data citations, data availability statements, or supplementary materials included in this article.


