

Abstract
An imbalance between normal adipogenesis and osteogenesis by mesenchymal stem cells (MSCs) has been shown to be related to various human metabolic diseases, such as obesity and osteoporosis; however, the underlying mechanisms remain elusive. We found that the interaction between osteopontin (OPN), an arginine-glycine-aspartate-containing glycoprotein, and integrin αv/β1 plays a critical role in the lineage determination of MSCs. Although OPN is a well established marker during osteogenesis, its role in MSC differentiation is still unknown. Our study reveals that blockade of OPN function promoted robust adipogenic differentiation, while inhibiting osteogenic differentiation. Re-expression of OPN restored a normal balance between adipogenesis and osteogenesis in OPN-/- MSCs. Retarded bone formation by OPN-/- MSCs was also verified by in vivo implantation with hydroxyapatite-tricalcium phosphate (HA-TCP), a bone-forming matrix. The role of extracellular OPN in MSC differentiation was further demonstrated by supplementation and neutralization of OPN. Blocking well-known OPN receptors integrin αv/β1 but not CD44, also affected MSC differentiation. Further studies revealed that OPN inhibits the C/EBPs signaling pathway through integrin αv/β1. Consistent with these in vitro results, OPN-/- mice had a higher fat to total body weight ratio than did wild-type mice. Therefore, our study demonstrates a novel role for OPN-integrin αv/β1 in regulating MSC differentiation.
Keywords: adipocytes, osteoblasts, integrins, C/EBP, differentiation
INTRODUCTION
Obesity and osteoporosis, two related polygenic diseases, are increasingly prevalent [1]. Over the past decade, these two important public health concerns have attracted significant attention. Various studies have demonstrated an inverse correlation between fat mass and bone mass [2]. The imbalance between fat and bone is often associated with pathophysiological conditions, such as obesity [3], aging [4], prolonged steroid therapy [5], and ovariectomy [6]. Adipocytes and osteoblasts can be traced back to a common precursor, the mesenchymal stem cell (MSC). MSCs are a subset of multipotent fibroblast-like progenitor cells and exist in many different tissues, including bone marrow, fat, muscle, umbilical cord, and brain [7]. MSCs have great potential in stem cell-based therapies, due to their potent immunomodulatory properties [8] and their intrinsic ability to differentiate into multiple cell lineages, such as adipocytes, osteoblasts, chondrocytes, and neurons [9, 10]. Under defined conditions in vitro, MSCs can differentiate into adipocytes or osteoblasts, depending on the presence of particular cytokines (e.g., IFNγ, TNF-α, TGFβ, BMPs) [11, 12] and the extracellular matrix [13]. Transcription factors C/EBPs and PPARγ are critical for adipogenesis, while Runx2/Cbfa1 is required for osteogenesis. It has been shown that adipogenic factors (e.g., isobutylmethylxanthin, indomethacin, and dexamethasone) activate C/EBPs and PPARγ; while osteogenic factors (e.g., L-ascorbic acid, and β-glycerophosphate) upregulate Runx2/Cbfa1. Some studies in vitro have demonstrated that adipogenic factors can inhibit osteogenesis [14] while osteogenic factors inhibit adipogenesis [15].
Osteopontin (OPN), also known as secreted phosphoprotein 1 (SPP1), is a soluble protein that is present in most body fluids. Although OPN may exist intracellularly as a regulator of cytoskeleton dynamics and gene expression, most studies have focused on the secreted form. Extracellular OPN functions through its interactions with multiple ubiquitously-expressed cell surface receptors, including various integrins (αvβ1, αvβ3, αvβ5, α4β1, α8β1, and α9β1) and CD44 [16]. Binding of OPN to these receptors can elicit a broad range of functions, such as cell adhesion, survival, migration and immune regulation [16]. Aberrant expression of OPN has been implicated in numerous physiological and pathophysiological processes, including bone remodeling [17], responses to stress [18], wound repair [19], tumor metastasis [20] and autoimmune disorders [21].
OPN is abundantly secreted by MSCs and can be further up-regulated during the osteogenic differentiation of these cells [22]. However, little is known about its role in regulating MSC differentiation. In this study, we employed murine bone marrow-derived MSCs and examined the role of OPN in the regulation of their osteogenic and adipogenic differentiation. We found that both antibody neutralization and genetic ablation of OPN accelerated the adipogenic differentiation and impaired the osteogenic differentiation of MSCs. The retarded bone formation capacity of OPN-/- MSCs was also verified in vivo. We further showed that the effect of OPN on MSC differentiation was exerted through regulation of the expression of C/EBPβ and C/EBPα following interaction with integrin αv/β1 containing receptors. Notably, OPN-/- mice exhibited more fat deposition than their wild-type counterparts. Thus, our studies revealed a novel role for OPN in directing adipogenic and osteogenic differentiation of MSCs.
MATERIALS AND METHODS
Mice
OPN-/- mice (129 background, 129/SvJ) were developed at Rutgers University in 1998 [23]. Wild-type control mice (129 background, 129/SvJ) were purchased from the Jackson Laboratory (Bar Harbor, ME, USA). Age-matched male mice were used for phenotypic analyses of the ratio of fat weight to body weight. Female immunocompromised nude mice (Balb/c, nu/nu) were purchased from the SLAC Laboratory Animal of Chinese Academy of Science (Shanghai, China). Mice were maintained under specific pathogen-free conditions in the vivarium of Shanghai Jiao Tong University School of Medicine. All procedures were approved by the Institutional Animal Care and Use Committee of the Institute of Health Sciences, Shanghai Institutes for Biological Sciences of Chinese Academy of Sciences.
Reagents
The following antibodies were used in flow cytometry: PE-conjugated anti-mouse CD44, CD34, Sca-1, CD45, integrin αv, α4, α5, β1, β3, and β5 (eBioscience, San Diego, CA, USA), polyclonal antibodies produced in goat against mouse integrin α8 and α9 (LifeSpan Biosciences, Seattle, WA, USA), PE-conjugated polyclonal secondary antibody to goat (Abcam, Cambridge, MA, USA). Antibodies used in western blotting analysis were: OPN (R&D Systems, Minneapolis, MN, USA), C/EBPβ, C/EBPα, Runx2, β-actin, GAPDH (Cell Signaling Technology, Danvers, MA, USA). Neutralizing antibodies were: integrin β1, CD44 (LifeSpan Biosciences). The anti-OPN mouse monoclonal antibodies (2C5, 1H3F7, and 2A1) and ras-induced OPN (275-3-2) were purified at Rutgers University [24]. Recombinant mouse OPN (rmOPN) was from R&D Systems. Cyclo(-Arg-Gly-Asp-D-Phe-Val-) (Cyclic RGD) was obtained from Merck (Whitehouse Station, NJ, USA).
Cells
MSCs were derived from tibia and femur bone marrow of 6- to 8-week-old OPN-/- mice and matched wild-type mice according to a protocol previously described in our lab [8, 25]. Briefly, bone marrow cells were filtered through 40 μm nylon mesh, and cultured in DMEM medium supplemented with 10% FBS, 2 mM glutamine, 100 U/ml penicillin, and 100 μg/ml streptomycin (complete medium, all from Invitrogen, Carlsbad, CA, USA). Non-adherent cells were removed after 24 hours, and adherent cells were maintained with medium replenishment every 3 days. To obtain MSC clones, cells at confluence were harvested and seeded in 96-well plates by limited dilution. Individual clones were then picked and expanded. Cells were used within the 15th passage.
Differentiation of MSCs
Differentiation of MSCs was induced according to established protocols [26] with minor modification. For adipocytes differentiation, MSCs were cultured in medium containing 0.5 mM isobutylmethylxanthin, 60 mM indomethacin, 100 nM dexamethasone and 10 mg/ml insulin (adipocyte differentiation medium). MSCs were grown in 24-well plate with medium changes every 3 days. The presence of adipocytes was verified by staining for triglycerides with Oil Red O, an indicator of intracellular lipid accumulation.
For osteogenic differentiation, MSCs were cultured in DMEM supplemented with 10% FBS, 10 nM dexamethasone, 100 mM L-ascorbic acid, and 10 mM β-glycerophosphate (osteogenic differentiation medium). These cultures were then stained with Alizarin Red S to identify calcium deposition, an indication of active osteoblasts. All chemical reagents used in MSC differentiation were purchased from Sigma.
Ectopic bone formation
MSCs (2×10⁶ ) were mixed with a carrier, HA-TCP ceramic particles (40mg, Bio-lu Biomaterials Company, Shanghai, China), and this mixture was implanted subcutaneously into the dorsal surface of 8- to 12-week-old nude mice [11]. The implants were harvested, fixed in 4% paraformaldehyde for micro-CT, then decalcified and embedded in paraffin. Thin sections (8 μm) were stained with hematoxylin and eosin (H&E). Image J software was used to analyze the sections.
Lentiviral vectors construction and infection
The full length cDNA encoding mouse OPN was amplified by PCR using primers 5’-CCGCTCGAGACCATGAGATTGGCAGTGAT-3’ and 5’-CGGGATCCCTAGTTGACCTCAGAAGATG-3’, including XhoI and BamHI (both from Takara, Dalian, China) restriction enzyme sites (underlined), respectively. The PCR product and pLVX-IRES-ZsGreen1 vector plasmid were doubly digested with XhoI and BamHI. Then an OPN expression plasmid was constructed by inserting the digested PCR product into the digested expression vector pLVX-IRES-ZsGreen1. The OPN expression plasmid was verified by DNA sequencing. The OPN expression plasmid (Zs-OPN) or control vector plasmid (Zs-Vector) with helper plasmids were co-transfected with 293FT for virus packaging, respectively. Lentivirus supernatant was collected 60 hours after transfection. OPN-specific (shOPN) and control (shControl) short hairpin RNA (shRNA) lentivirus particles were prepared by GeneChem (Shanghai, China).
Target cells were infected using lentiviral supernatant with 10 mg/ml polybrene (Sigma). OPN expression in target cells was detected by western blot analysis.
RNA interference
siRNA specific for mouse OPN and control siRNA with scrambled sequences were purchased from Dharmacon (Lafayette, CO, USA). In each transfection, 5 μl siRNAs (100 pM) were introduced into MSCs (1.5×10⁶ cells) using the Amaxa Nucleofector device, with program U-023 and Nucleofector kit V (Amaxa, Cologne, Germany). The efficiency of transduction was determined for a control plasmid containing enhanced green fluorescent protein (eGFP) cDNA (Pmax, part of Nucleofector kit), for which the expression of eGFP was evaluated by flow cytometry and fluorescence microscopy, typically resulting in >90% efficiency.
Western blotting analysis
Adherent cells were scraped from the culture dish and washed twice with ice-cold PBS. Total protein was extracted from the cell pellet with RIPA lysis buffer (Upstate, Charlottesville, VA, USA). Samples were incubated at 4°C for 30 min, then centrifuged at 10,000×g for 15 min at 4°C. The supernatants were transferred, mixed, and boiled in SDS sample buffer. The lysates were separated by polyacrylamide gel electrophoresis and transferred to a 0.45 μm polyvinylidene fluoride (PVDF) blotting membrane (Whatman Inc., Clifton, NJ, USA). The membrane was then incubated at room temperature in a blocking solution composed of 5% skimmed milk powder dissolved in TBST (0.05% Tween 20, 10 mM Tris, pH 8.0, and 140 mM NaCl) for 1 hour followed by incubation with the primary antibodies overnight at 4°C. The membrane was washed three times in TBST (5 min each), then incubated with horseradish peroxidase-conjugated secondary antibody in the blocking solution. The blot was then exposed by ECL (Pierce, Rockford, IL, USA) after another three washes in TBST.
Real-time PCR
Total RNA was isolated from cell pellets using an RNAprep pure Cell/Bacteria Kit. First-strand cDNA synthesis was performed using the 1st strand cDNA Synthesizing Kit with random hexamer primers (all kits from Tiangen biotech, Beijing, China). Genes of interest were quantitated by real-time PCR. The mRNA levels of genes of interest were measured by real-time PCR (7900 HT by Applied Biosystems, Foster City, CA, USA) using SYBR Green Master Mix (TaKaRa Biotech). Total amount of mRNA was normalized to endogenous β-actin mRNA. Sequences of PCR primer pairs are listed in supplemental Table 1.
Flow cytometry analysis
Cells were harvested and washed once with PBS. The cell pellets were then suspended in staining buffer (PBS, 3% FCS, 0.01% NaN3) at a concentration of 1×10⁷ cells/ml. Cell suspension (100 μl) was incubated for 30 min on ice with either directly conjugated antibodies or biotinylated antibodies followed by streptavidin-PE for an additional 30 min on ice after washing. Cells were then washed with the staining buffer. The samples were subjected to flow cytometric analysis using a FACSCalibur flow cytometer (Becton Dickinson, San Jose, CA, USA). FCS Express software was used for data analysis.
Statistical analysis
The GraphPad Prism 5.0 software (GraphPad Software, Inc.) was used for the statistical analyses. Statistical significance was assessed by unpaired two-tailed Student’s t test and stated as follows: ns, not significant; * P < 0.05; ** P < 0.01; *** P < 0.001.
RESULTS
OPN-deficiency skews MSC differentiation toward the adipocyte lineage
Previous reports have shown that inflammatory cytokines play important roles in MSC differentiation [11]. OPN, a ubiquitously expressed cytokine originally identified in osteoblasts, has multi-faceted effects on bone remodeling, cell migration, tumor metastasis, and immune regulation [20, 21]. In wild-type mice, more than 200 ng/ml OPN is present in the serum (Fig. S1A). So far, its role, if any, in directing MSC differentiation remains elusive. Here, MSCs were derived from mouse bone marrow, as previously described by this laboratory [8, 25]. They were confirmed to have the normal MSC phenotype: Sca-1+ CD44+ MHC class Ilow MHC class II- CD34- CD31- CD11b- CD11c- CD45-, and the ability to differentiate into adipocytes and osteoblasts using established protocols [8, 26]. We found that bone marrow-derived MSCs express high levels of OPN (Figs. S1B, S1C, and 5D). To determine if OPN affects the differentiation of MSCs, we compared MSCs derived from wild-type and OPN-/- mice. There was no detectable difference in surface markers between them (Fig. S1D), indicating that OPN-deficiency does not influence the initial MSC phenotypic markers tested. OPN expression was shown to be undetectable in OPN-/- MSCs by real-time polymerase chain reaction (PCR) and western blotting analysis (Figs. S1E and 5D). To examine the effects of an absence of OPN on MSC differentiation, the MSCs were cultured in osteogenic- or adipogenic-induction medium. Compared with wild-type MSCs, adipogenic differentiation was dramatically accelerated in OPN-/- MSCs (Fig. 1A), according to the enumeration of adipocytes in six random microscopic fields for each group (Fig. 1B). This accelerated adipogenesis was further confirmed by a greatly increased expression level of Fabp4, the terminal adipocyte differentiation marker (Fig. 1C). In contrast, the kinetics of osteogenic differentiation by OPN-/- MSCs was significantly retarded compared to wild-type MSCs (Fig. 1D).
Figure 5. C/EBPs are involved in the OPN-directed adipogenic differentiation of MSCs.

(A) Total RNA from wild-type or OPN-/- MSCs were assayed for C/EBPα and Runx2 mRNA by real-time PCR. (B and C) Wild-type MSCs transfected with OPN siRNA (siOPN) or control siRNA (siControl) were analyzed for OPN mRNA three days after transfection, to verify knockdown efficiency (B). Total protein preps from the same cells were assayed for OPN, C/EBPβ, C/EBPα, Runx2 and p-AKT by western blotting analysis (C). (D) Total protein from OPN-/- or wild-type MSCs was analyzed for OPN, C/EBPα, Runx2 and p-AKT by western blotting. (E) Wild-type MSCs were treated with integrin β1- neutralizing antibody or an isotype control (each 10 μg/ml), or cyclic RGD (10 μM) or solvent for 12 hours, and C/EBPβ assayed from total protein. (F and H) Wild-type or OPN-/- MSCs cultured in adipogenic (F) or osteogenic (H) differentiation medium for the indicated times were analyzed for C/EBPα (F), or Runx2 and osterix (H) by real-time PCR. (G) Wild-type or OPN-/- MSCs were cultured in adipogenic differentiation medium for the indicated number of days, and their total protein analyzed for OPN, and C/EBPα. There are two isoforms of C/EBPα: p42 and p30 (indicated by arrows). In panel G, there are pen marks in the center of C/EBPα (p42) and GAPDH. *, P < 0.05; **, P < 0.01; ***, P < 0.001. All experiments were repeated at least three times.
Figure 1. OPN-deficiency favors MSC differentiation into adipocytes, rather than osteoblasts.

(A) Wild-type or OPN-/- MSCs were cultured in adipogenic differentiation medium for 3 or 6 days, and stained with Oil Red O to reveal lipid droplets (bar: 100 μm). (B) Adipocytes were enumerated in six random microscopic fields from four cultures in each group. (C) MSCs were subjected to adipogenic differentiation and Fabp4 expression on the indicated days was analyzed by real-time PCR. (D) MSCs were cultured in osteogenic differentiation medium for the indicated number of days, and calcium deposits were revealed by Alizarin Red S stain (bar: 500 μm). (E) OPN-/- MSCs were transfected with lentivirus containing control vector (Zs-Vector) or OPN-expressing vector (Zs-OPN), and OPN expression determined by real-time PCR and western blotting analysis. (F and G) OPN-/- MSCs transfected as in (E) and wild-type MSCs were cultured in adipogenic differentiation medium for 4 days and stained with Oil Red O (bar: 100 μm; adipocytes counted in five random fields from four wells per group) (F), or in osteogenic differentiation medium for 21 days and stained with Alizarin Red S (bar: 500 μm) (G). Values are means ± SEM. ***, P < 0.001. All experiments were repeated at least twice.
The results shown above indicate a clear shift from osteogenic to adipogenic differentiation in MSCs deficient in OPN. Although we have shown that genetic knockout of OPN in these mice is complete, the resultant changes in the differentiation of OPN-/- MSCs might possibly be due to other factors. To ascertain its role in the differentiation of MSCs, OPN was stably re-introduced into OPN-/- MSCs or knockdown in wild-type MSCs using lentiviral particles. OPN expression was verified by real-time PCR and western blotting analysis (Figs. 1E and S1F). We found that, indeed, re-introduction of OPN (Zs-OPN) into OPN-/- MSCs reverted the effects of OPN-deficiency significantly, resulting in decreased adipogenic differentiation (Fig. 1F) and enhanced osteogenic differentiation (Fig. 1G). Compared with wild-type MSCs, OPN-/- MSCs regained partial differentiation ability upon reintroduction of Zs-OPN. Since there are two isoforms (secreted and intracellular) of OPN translated from the same mRNA transcript, we examined their existence in Zs-OPN transfected OPN-/- MSCs and found that both secreted OPN and intracellular OPN in the transfected cells are at a lower levels than that produced endogenously by wild-type MSCs (Figs. S1C and S1F). This lower expression of OPN could be responsible for the incomplete reversion of the differentiation capacity. Similar to the effects of OPN deficiency, stable knockdown of OPN also showed dramatically augmented adipogenic differentiation (Fig. S2B) and greatly impaired osteogenic differentiation (Fig. S2C). Thus, OPN is likely to play a critical role in determining adipogenic or osteogenic differentiation by bone marrow-derived MSCs.
The bone formation capacity of OPN-/- MSCs was also impaired in vivo
The bone formation capacity of OPN-/- MSCs was also investigated in vivo using transplantation of hydroxyapatite-tricalcium phosphate (HA-TCP), an artificial bone-forming matrix. When HA-TCP was implanted with OPN-/- MSCs, there was less bone formation than with wild-type MSCs after 8 weeks, as indicated by bone mineral density (BMD) measured by micro-CT (Figs. 2A and 2B). The percentage of blue regions is lower in implants with OPN-/- MSCs than with wild-type MSCs, indicating lower bone formation capacity of OPN-/- MSCs. H&E staining of histological sections of the implants also revealed less bone formation by OPN-/- MSCs (Figs. 2C and 2D). Bone formation by OPN-/- MSCs was diminished at all earlier time points as well (2, 3, 4, or 6 weeks) (Figs. 2E and 2F). Therefore, consistent with our in vitro experiment, OPN deficiency also caused delayed bone formation by MSCs in vivo.
Figure 2. OPN-/- MSCs have delayed bone formation in vivo.

(A and C) The mixture of MSCs and hydroxyapatite-tricalcium phosphate (HA-TCP) was subcutaneously implanted into the dorsal surface of nude mice. Implants were harvested after 8 weeks, scanned by micro-CT (bar: 1 mm) (A) and histologic sections were stained with H&E (bar: 500 μm) (C). (E) Implants were harvested at the indicated time points and histological sections were stained with H&E (bar: 500 μm). Typical bone (B), connective tissue (CT), and HA-TCP (HA) are indicated. Calculated values derived from each analysis are shown in adjacent bar graphs (B, D, and F). Bars and error lines indicate means ± SEM (n=6). *, P < 0.05; **, P < 0.01; ***, P < 0.001.
OPN exerts its effect on MSC differentiation mainly in an extracellular manner
To further investigate the role of OPN in MSC differentiation, we employed a specific monoclonal antibody 2C5 [27] to neutralize OPN in vitro. For wild-type MSCs, adipogenic differentiation was significantly enhanced by the presence of 2C5 (Fig. 3A), while osteogenic differentiation was dramatically reduced (Fig. 3B). Two other OPN-specific monoclonal antibodies (1H3F7 and 2A1) yielded similar results (Fig. S3). The neutralizing antibody significantly reduced osteogenic differentiation and increased adipogenic differentiation though not extent as found in OPN-deficient MSCs. Since OPN exists in both secreted and intracellular isoforms, our antibody neutralization study clearly suggest a role for secreted OPN in regulating MSC differentiation, although the participation of intracellular OPN cannot be excluded. To verify the effects of extracellular OPN, we also applied exogenous OPN during MSC differentiation. When OPN-/- MSCs in osteogenic differentiation medium were supplemented with extracellular OPN, whether from a recombinant source or purified from the ras-transformed cell line 275-3-2 [24], these MSCs regained their capacity for osteogenic differentiation (Fig. 3C). Collectively, these data suggest that OPN exerts its regulatory role in MSC differentiation mainly in an extracellular manner, likely via cell surface receptors.
Figure 3. Anti-OPN monoclonal antibodies and OPN supplementation demonstrate that OPN directs MSC differentiation mainly in an extracellular manner.

(A and B) Wild-type MSCs and OPN-/- MSCs were cultured in complete medium (control), adipogenic differentiation medium, or osteogenic differentiation medium supplemented with OPN-specific antibody 2C5 or isotype control (each 10 μg/ml), then stained with Oil Red O after 6 days (bar: 50 μm) (A), or with Alizarin Red S after 21 days (bar: 500 μm) (B). (C) OPN-/- MSCs were cultured in osteogenic differentiation medium supplemented with recombinant OPN (rmOPN, 1 μg/ml) or purified native ras-induced OPN (275-3-2, 1 μg/ml) [27] for 21 days and stained with Alizarin Red S (bar: 500 μm). ***, P < 0.001. All experiments were repeated at least twice with similar results.
The effects of OPN on MSC differentiation are exerted through integrin αv/β1 containing receptors
The observations that antibodies neutralizing OPN can skew MSC differentiation toward adipogenesis at the expense of osteogenesis, and that exogenous OPN can restore normal differentiation in OPN-/- MSCs suggest that OPN directs MSC differentiation via extracellular receptors. Previous studies have demonstrated that OPN acts by binding to cell surface integrins and CD44 [16]. Integrin αvβ1, αvβ3, and αvβ5 are known receptors for OPN [28, 29]. Therefore, we examined the expression of integrins and CD44 on MSCs using flow cytometry, and found that integrin αv, β1 and CD44 are indeed highly expressed on both wild-type and OPN-/- MSCs (Figs. 4A and S1D). We next utilized antibodies or antagonist against known OPN receptors to determine which particular receptors mediate the effects of OPN on MSC differentiation. Treatment with antibody against integrin β1 led to enhanced adipogenesis and reduced osteogenesis, mimicking the effect of OPN-neutralizing antibodies on the adipogenic and osteogenic balance in MSC differentiation (Figs. 4B, 4C, and 4D); anti-CD44 had little effect. Additionally, adipogenic differentiation by MSCs was also augmented by cyclic RGD, an antagonist of integrin αv (Figs. 4E and 4F). These results strongly suggest that OPN modulation of adipogenic and osteogenic differentiation by MSCs is initiated by OPN binding to integrin αv/β1.
Figure 4. Blocking integrin αv or integrin β1 accelerates the adipogenic differentiation and retards the osteogenic differentiation of wild-type MSCs.

(A) Expression levels of various integrin subunits by wild-type MSCs or OPN-/- MSCs were determined by flow cytometry using subunit-specific polyclonal antibodies: integrin β1, β3, β5, αv, α4, α8, α9. (B, C, and D) Wild-type MSCs supplemented with blocking antibodies against integrin β1 or CD44, or an isotype control (each 10 μg/ml) were cultured in adipogenic differentiation medium for 6 days and stained with Oil Red O (bar: 100 μm; adipocytes counted in six random fields from four wells per group) (B and C), or in osteogenic differentiation medium for 24 days and stained with Alizarin Red S (D). (E and F) Wild-type MSCs were cultured in control medium or adipogenic differentiation medium supplemented with cyclic RGD (10 μM) or solvent (acetic acid) for 6 days, then stained with Oil Red O (bar: 100 μm) (E). Adipocytes were quantitated as described above (F). ns, not significant; ***, P < 0.001. Representative of three independent experiments.
OPN directs adipogenic differentiation in MSCs via the C/EBPs signaling pathway
To determine the mechanism by which OPN regulates adipogenesis and osteogenesis by MSCs, we analyzed key transcription factors involved in MSC differentiation. It has been shown that the C/EBPs, including C/EBPβ and C/EBPα, and PPARγ transcription factors function sequentially and synergistically to promote the expression of genes involved in adipogenic differentiation [30, 31]. We found much greater mRNA expression for C/EBPα, a key adipogenic differentiation factor, in OPN-/- MSCs as compared to wild-type MSCs (Figs. 5A and 5D). In contrast, an osteogenic transcription factor, Runx2, was diminished in OPN-/- MSCs (Fig. 5A). The expression levels of C/EBPα and Runx2 were also determined by western blotting analysis. In MSCs treated with OPN-targeted small interfering RNA (siRNA), C/EBPα was highly expressed, while Runx2 was down-regulated (Figs. 5B and 5C). A similar expression pattern was detected in OPN-/- MSCs (Fig. 5D). The PI3K-AKT signaling pathway has been implicated in the adipogenic differentiation of MSCs [32]. Interestingly, we found that AKT phosphorylation was increased in OPN-/- MSCs, a finding that was verified by using OPN-specific siRNA in wild-type MSCs (Figs. 5C and 5D).
C/EBPβ expression has been shown to be precisely regulated during adipogenic differentiation. Its upregulation leads to activation of downstream C/EBPα, and C/EBPβ is downregulated afterwards [30]. Thus, it is likely that OPN-knockdown in wild-type MSCs leads to a transient increase in C/EBPβ expression, which, in turn, activates C/EBPα expression. Coincidently, we found that C/EBPβ was upregulated in OPN-knockdown cells (Fig. 5C). Since we have demonstrated that OPN regulates MSC differentiation through its interaction with receptors containing integrin αv/β1 (Fig. 4), we next investigated the effect of blockade of integrin αv/β1, and found that C/EBPβ is indeed upregulated when integrin αv/β1 is unavailable for OPN binding (Fig. 5E). These results confirm that OPN exerts an effect via the αv/β1 integrin.
Besides the mutual activation of PPARγ and C/EBPα, C/EBPα has also been reported to be capable of auto-activation [33]. Therefore, we hypothesized that OPN-deficiency might lead to a default upregulation of C/EBPα in OPN-/- MSCs and predispose them to undergo adipogenic differentiation. To test this hypothesis, we examined the expression pattern of C/EBPα during the adipogenic differentiation of wild-type and OPN-/- MSCs. We found that, shortly after exposure to adipogenic differentiation medium, C/EBPα was indeed upregulated in OPN-/- MSCs, and this upregulation was more rapid than in wild-type MSCs (Figs. 5F and 5G). We also examined the expression of osteoblastic genes during osteogenic differentiation. Runx2 and osterix, two key transcription factors in osteogenic differentiation, were expressed at much lower levels in OPN-/- MSCs than in wild-type MSCs (Fig. 5H). Taken together, these data strongly suggest that OPN has inhibitory effects on the C/EBPs signaling and adipogenesis, and that OPN-deficiency may lead to a default upregulation of C/EBPα that favors adipogenic differentiation.
Mice lacking OPN develop a higher ratio of fat weight to body weight
According to previous reports, OPN-/- mice are fertile and give birth normally. These mice also show normal development of tissues and organs, including skeleton [19, 23]. However, little is known about the role of OPN in adipogenesis in vivo. We measured the body weight and total fat weight of 5-week-old male mice by nuclear magnetic resonance (NMR) using a Minispec mq7.5 Analyzer (Bruker Optik, Germany). Interestingly, the ratio of total fat weight to body weight was significantly higher in OPN-/- mice (Fig. 6A). Moreover, we collected and weighed the subcutaneous and abdominal visceral fat from these mice and found higher ratios of fat-to-body weight for both types of fat in OPN-/- mice (Fig. 6B). To further investigate the role of OPN in adipogenesis in vivo, especially in aged mice, we measured the body weight and total fat weight of 12-month-old male mice. We found a significant increase of fat ratio in these aged mice with OPN-deficiency as compared to wild-type mice (Fig. 6C). Thus, OPN-deficiency leads to greater fat deposition, especially during aging. This observation shows that a lack of OPN promotes adipogenesis in vivo.
Figure 6. Analyses of the ratio of fat weight to body weight in wild-type and OPN-/- mice.
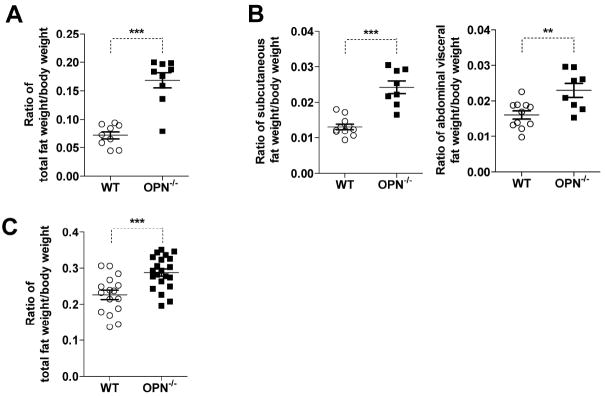
(A) The body weight and total fat weight of wild-type (WT) or OPN-/- five-week-old male mice was measured in vivo by nuclear magnetic resonance (NMR) using the Minispec mq7.5 Analyzer. The ratio of total fat weight-to-body weight was calculated (n=9). (B) Subcutaneous fat and abdominal visceral fat were separately excised, weighed, and represented as ratios relative to body weight. (WT, n=11; OPN-/-, n=8). (C) Twelve-month-old male mice were analyzed as in (A) (WT, n=16; OPN-/-, n=21). All values represent means ± SEM. **, P < 0.01; ***, P < 0.001.
DISCUSSION
Adipose tissue and bone are becoming recognized as important endocrine organs, in addition to their traditional functions. Their genesis and functions are mutually regulated through the secretion of various factors, such as adipokines [34] and osteocalcin [35]. In the present study, we investigated the role of OPN, an RGD-containing multifunctional glycoprotein secreted by diverse cell types, in regulating both adipogenic and osteogenic differentiation and found that this molecule is critical in controlling the balance between fat and bone by directing the differentiation of MSCs. These effects of OPN are exerted through integrin αv/β1, which elicit inhibition of adipogenic-related transcription factors, such as C/EBPβ, C/EBPα and PPARγ. Given the higher ratio of fat-to-body weight observed in OPN-/- mice, we believe that OPN is an important factor in regulating the balance between fat mass and bone mass.
OPN belongs to the small integrin-binding ligand N-linked glycoprotein (SIBLING) family, which also includes bone sialoprotein (BSP), dentin matrix protein 1 (DMP1), dentin sialophosphoprotein (DSPP) and matrix extracellular phosphoglycoprotein (MEPE). All of these members share common characteristics: chromosome location, RGD-motif, mainly expressed in bone and dentin as important components of the extracellular matrix. Most studies on these proteins focus on matrix mineralization and bone remodeling [36]. OPN is the most extensively studied member of the SIBLING family. It has two distinct protein isoforms: secreted and intracellular OPN. Intracellular OPN was first reported by Sodek’s group in cultures of fetal rat calvarial cells [37]. The perimembranously distributed intracellular OPN was found to be associated with CD44 and ezrin/radixin/moesin (ERM) complex, which was related to cell migration [38, 39]. Intracellular OPN also contributed to other signal transduction processes, such as activation of MAPK. Both cell migration and MAPK signaling are important during MSC differentiation. Our study showed that secreted OPN played a critical role in regulating MSC differentiation. When exogenous OPN was examined, it only accelerated osteogenic differentiation in OPN-/- MSCs (Fig. 3C), not in wild-type MSCs (Fig. S2D). This could be due to the production of OPN by MSCs at excessive amount. Indeed, in 60 hours, 1×10⁵ wild-type MSCs could produce about 800 ng secreted OPN (Fig. S1C). The MSCs may already be saturated by the high level of endogenously produced OPN, and do not response to the addition of exogenous OPN. Additionally, although our antibody neutralization study indicated that extracellular OPN plays a critical role in regulating MSC differentiation, the role of intracellular OPN in regulating MSC differentiation could not be excluded.
In this study, we focused on the effects of secreted OPN in regulating MSC differentiation. It has multiple functions that are exerted via its binding to certain cell surface receptors, including CD44 and several integrins [16]. By blocking the αv or β1 integrin chains with antagonist or neutralizing antibody, we found that adipogenic differentiation was accelerated and osteogenic differentiation was retarded in wild-type MSCs, demonstrating that OPN regulates MSC differentiation via integrin αv/β1. As a multifunctional protein, integrin β1 affects a variety of cellular functions, such as cell migration, adhesion, differentiation and growth [40, 41]. Receptors containing the β1 integrin chain, such as integrin α5β1, were reported to be involved in osteogenesis by MSCs [42]. Integrins were also shown to play a critical role in osteogenic differentiation by MSCs and in skeletal development in mice [43]. However, the identity of the agent that initiates such integrin-mediated signaling was heretofore unknown. Our results now reveal that OPN binding to integrin αv/β1 containing receptors is the trigger leading to changes in regulation of the adipogenic and osteogenic differentiation of MSCs.
The ectopic bone formation assay further verified that OPN plays critical role in regulating MSC differentiation in vivo. Although there are reports demonstrating that adipocytes can also be observed in the transplants of HA-TCP and MSCs [44, 45], adipocyte differentiation was not observed in our transplants. Gronthos et al. showed that among many bone marrow derived MSC clones with bone formation capability, only 31% formed adipose tissue in the transplants [46]. This provides an explanation for our observation. In vitro differentiation and ectopic bone formation assay showed that OPN-/- MSCs formed considerably less bone compared with wild-type MSCs. However, in OPN-/- mice, adipocyte and osteoblast (Fig. S4B, S4C, and S5), as well as bone (Fig. S4 A), were not significantly affected. We further verified this observation from two independently generated OPN-/- mice [19, 23]. It has been reported that several mouse strains with deficiency in physiologically important genes develop and grow normally, such as vitronectin-/- mice [47]. This may be due to functional redundancy in vivo; for example, with other members of the SIBLING family. In addition, OPN also shares receptors with other proteins, such as vitronectin. Thus, in vivo, these molecules may compensate for the lack of OPN. Another possibility is that OPN has limited or subtle functions under normal conditions, so the OPN-/- mice could develop normally. It has been shown that OPN-/- mice performed differently under pathological or stress situations [18]. Moreover, MSCs derived from OPN-/- mice grow similarly to those from wild-type mice in complete culture medium. Nevertheless, OPN-/- MSCs behave differently than wild-type MSCs in adipogenic and osteogenic differentiation medium. In addition, HA-TCP can induce bone formation by serving as a rich source for calcium and phosphorus. To some extent, HA-TCP and reagents used in MSC differentiation can also be regarded as stressors for MSCs. Thus, OPN-/- MSCs formed considerably less bone in vitro while the bones of OPN-/- mice were not affected.
In the present study, we systematically examined visceral and inguinal adipose tissue in mice eating a normal diet and found, surprisingly, that OPN-/- mice have a greater fat weight-to-body weight ratio than do wild-type mice. Interestingly, a recent study showed that mice lacking the Opn gene were protected from obesity and insulin resistance induced by a high-fat diet [48, 49]. It is reported that a high-fat diet results in a significant increase in various pro-inflammatory cytokines and immune cells in the fat tissue [50]. As an important pro-inflammatory cytokine, OPN is involved in autoimmune disease and chronic inflammation, including conditions such as rheumatoid arthritis, atherosclerosis, obesity-induced inflammation, and tumor metastasis [16]. Therefore, OPN plays distinct roles in controlling fat deposition under different circumstances. We believe that, under a high-fat diet, systemic depletion of OPN may alter the microenvironment of inflammation in fat tissue and thus affect the adipogenic process.
Our study provides critical information regarding several previously unexplained observations. OPN has been implicated in regulating the hematopoietic stem cell (HSC) niche [51, 52]. Interestingly, osteoblasts and adipocytes exert opposite effects on the HSC niche [53-55]. Our findings suggest that alterations in the bone marrow microenvironment of OPN-/- mice could be due to changes in the balance between osteogenic and adipogenic differentiation by MSCs. Also, it is well known that, with aging, there is an inverse relationship between bone density and fat accumulation in the bone marrow [2]. Indeed, we found that OPN-/- mice show significantly increased fat-to-body weight ratio as they age. Thus, further study of the regulation of OPN expression and its tissue distribution will provide a better understanding of many pathophysiological conditions related to fat, bone, and other tissues.
CONCLUSION
In summary, our study revealed an important role of OPN-integrin αv/β1 in regulating the balance of fat and bone tissue, which has not been reported before. We show that OPN could inhibit adipogenesis through inhibition of the C/EBPs signal via integrin αv/β1, not CD44. Since OPN, adipocytes, osteoblasts, and MSCs all have been implicated in regulating the HSC niche, our work also provides information for the understanding of the regulation of the HSC niche. Our study also provides a new piece of supporting evidence for the reciprocal regulation between bone and fat via secreted factors, and for targeting OPN as a potential therapy for bone and fat metabolic diseases.
Supplementary Material
Fig. S1. Phenotypes of wild-type and OPN-/- MSCs and OPN levels in serum and Zs-OPN MSCs. (related to Figure 1)
(A) Blood samples (n=5) were clotted for 2 hours at room temperature before centrifuging at 2000×g at 4°C for 20 min. Serums were collected and OPN was assayed immediately by ELISA. (B) OPN mRNA in total RNA from wild-type MSCs was assayed by real-time PCR and compared to β-actin (defined as 1). (C) Wild-type MSCs and Zs-OPN MSCs (1×10⁵ cells) were cultured in 2 ml complete medium for 60 hours. The supernatant was collected and centrifuged at 1000×g for 10 minutes and the OPN concentration was measured by ELISA. (D) MSC surface markers were analyzed by flow cytometry. OPN-/- or wild-type MSCs were harvested before achieving 90% confluence. Cells were then labeled with the indicated antibodies or isotype controls by direct immunofluorescence staining, and subjected to flow cytometry. Data were analyzed using the FCS Express software. Shaded areas represent isotype controls; purple lines represent specific antibodies. (E) OPN-deficiency expression. OPN mRNA in total RNA from wild-type or OPN-/- MSCs was assayed by real-time PCR. (F) Expression of OPN by Zs-OPN MSCs. Total RNA was extracted from both wild-type and Zs-OPN MSCs and OPN expression was determined by real-time PCR (left panel). Total protein was collected and OPN expression was determined by western blotting analysis (right panel). Antibody for detection of the two isoforms of OPN was purchased from Santa Cruz. sOPN, secreted OPN; iOPN, intracellular OPN. All values are means ± SEM.
Fig. S2. Knockdown of OPN in wild-type MSCs skews the balance of MSC differentiation. (related to Figure 1)
(A) Wild-type MSCs transfected with lentivirus expressing OPN-specific (shOPN) or control (shControl) shRNA were analyzed for OPN expression by real-time PCR (left panel) or western blotting analysis (right panel). (B and C) Cells transfected as in (A) were cultured in adipogenic differentiation medium for 6 days and stained with Oil Red O (bar: 100 μm; adipocytes counted in six random fields from four cultures per group) (B), or in osteogenic differentiation medium or control medium for 17 days and stained with Alizarin Red S (bar: 500 μm) (C). (D) Wild-type MSCs were cultured under the osteogenic differentiation medium with or without recombinant OPN (rmOPN, 1 μg /ml) for 15 days and stained with Alizarin Red S (bar: 500 μm). Values are means ± SEM. ***, P < 0.001. Representative of at least three independent experiments.
Fig. S3. Antibody neutralization of OPN significantly promoted adipogenic differentiation of MSCs. (related to Figure 3)
MSCs within 15 passages were cultured in adipogenic differentiation medium supplemented with OPN-specific monoclonal antibodies (2C5, 1H3F7, and 2A1; 1 μg/ml or 10 μg/ml) or isotype control (10 μg/ml) and renewed after 3 days. On day 6, cells were stained with Oil Red O (bar: 500 μm). Arrows indicated adipocytes. Representative of three independent experiments.
Fig. S4. In vivo quantification of bone mineral density and adipocytes. (related to Figure 6)
(A) Tibia and femur (n=9) were harvested and connective tissue removed before fixing in 4% formaldehyde for 24 hours at room temperature. Fixed bone samples were scanned by micro-CT and analyzed by CTAn software. (B) Freshly isolated tibia and femur (the ends away from the knee were opened) were fixed in 4% formaldehyde for 24 hours at room temperature. The bone samples were embedded and sectioned. The 5 μm undecalcified sections were stained with Goldner's trichrome staining. Adipocytes were large oval-shaped or circular cells with a cell membrane without cytoplasmic staining, indicated by an arrow in the enlargement of the lower right quadrant (bar: 500 μm). (C) The area, number, and mean size of adipocytes were determined by the ImageJ software. Values are means ± SEM, n=5. ns, not significant.
Fig. S5. In vivo quantification of adipocytes and osteoblasts. (related to Figure 6)
Total RNA were extracted from tibia and femur according the protocol by Carter et al. (BMC Biotechnology 2012, 12:5). The expression of adipocyte markers (Fabp4, Glut4, Perilipin, Adiponectin, Leptin) and osteoblast markers (Osteocalcin, Osterix, Collagen I a, Runx2, ALP) were determined by real-time PCR. Values are means ± SEM, n=5. ns, not significant; *, P < 0.05; ***, P < 0.001.
Acknowledgments
The authors thank Jingjing Li and Fengying Li for technical assistances in breeding the mice, and Dr. Chengjiang Gao, Department of Immunology, Shandong University, for the helpful discussion. This work was supported by grants from the Ministry of Science and Technology of China (2010CB945600, 2011DFA30630), Scientific Innovation Project of the Chinese Academy of Science (KSCX2-YW-R-245, XDA010 40107), the National Science and Technology Project of China (31010103908), and grants from the National Institutes of Health of the United States of America (DE014913, DE019932, and GM866889).
Footnotes
AUTHOR CONTRIBUTIONS
Q.C.: conception and design, collection and assembly of data, data analysis and interpretation, manuscript writing
P.S.S.: conception and design, collection and assembly of data, data analysis and interpretation, manuscript writing
L.Y.Z.: collection and/or assembly of data, data analysis and interpretation
C.L.X.: lentivirus preparation, data analysis and interpretation
C.X.Z.: data analysis and interpretation
Y.Y.H.: tissue section and HE staining
W.Z.L.: data analysis and interpretation
Y.H.: data analysis and interpretation
X.R.Z.: provision of study material
C.S.S.: manuscript writing
A.I.R.: manuscript writing
A.B.R.: manuscript writing
G.W.R.: conception and design, data analysis and interpretation
Y.Y.Z.: provision of study material
Y.W.: data analysis and interpretation, manuscript writing
D.T.D.: conception and design, provision of study material, manuscript writing
Y.F.S.: conception and design, data analysis and interpretation, financial support, manuscript writing, final approval of manuscript
DISCLOSURES OF POTENTIAL CONFLICTS OF INTEREST
The authors declare no potential conflicts of interest.
References
- 1.Rosen CJ, Bouxsein ML. Mechanisms of disease: is osteoporosis the obesity of bone? Nature Clinical Practice Rheumatology. 2006;2:35–43. doi: 10.1038/ncprheum0070. [DOI] [PubMed] [Google Scholar]
- 2.Meunier P, Aaron J, Edouard C, et al. Osteoporosis and the replacement of cell populations of the marrow by adipose tissue - A quantitative study of 84 iliac bone biopsies. Clin Orthop Relat Res. 1971;80:147–154. doi: 10.1097/00003086-197110000-00021. [DOI] [PubMed] [Google Scholar]
- 3.Gomez-Ambrosi J, Rodriguez A, Catalan V, et al. The bone-adipose axis in obesity and weight loss. Obes Surg. 2008;18:1134–1143. doi: 10.1007/s11695-008-9548-1. [DOI] [PubMed] [Google Scholar]
- 4.Justesen J, Stenderup K, Ebbesen EN, et al. Adipocyte tissue volume in bone marrow is increased with aging and in patients with osteoporosis. Biogerontology. 2001;2:165–171. doi: 10.1023/a:1011513223894. [DOI] [PubMed] [Google Scholar]
- 5.Li XD, Jin L, Cui QJ, et al. Steroid effects on osteogenesis through mesenchymal cell gene expression. Osteoporosis International. 2005;16:101–108. doi: 10.1007/s00198-004-1649-7. [DOI] [PubMed] [Google Scholar]
- 6.Wronski TJ, Lowry PL, Walsh CC, et al. Skeletal Alterations in Ovariectomized Rats. Calcified Tissue International. 1985;37:324–328. doi: 10.1007/BF02554882. [DOI] [PubMed] [Google Scholar]
- 7.Meirelles LDS, Chagastelles PC, Nardi NB. Mesenchymal stem cells reside in virtually all post-natal organs and tissues. Journal of Cell Science. 2006;119:2204–2213. doi: 10.1242/jcs.02932. [DOI] [PubMed] [Google Scholar]
- 8.Ren GW, Zhang LY, Zhao X, et al. Mesenchymal stem cell-mediated immunosuppression occurs via concerted action of chemokines and nitric oxide. Cell Stem Cell. 2008;2:141–150. doi: 10.1016/j.stem.2007.11.014. [DOI] [PubMed] [Google Scholar]
- 9.Jiang Y, Jahagirdar BN, Reinhardt RL, et al. Pluripotency of mesenchymal stem cells derived from adult marrow. Nature. 2002;418:41–49. doi: 10.1038/nature00870. [DOI] [PubMed] [Google Scholar]
- 10.Pittenger MF, Mackay AM, Beck SC, et al. Multilineage potential of adult human mesenchymal stem cells. Science. 1999;284:143–147. doi: 10.1126/science.284.5411.143. [DOI] [PubMed] [Google Scholar]
- 11.Liu Y, Wang L, Kikuiri T, et al. Mesenchymal stem cell-based tissue regeneration is governed by recipient T lymphocytes via IFN-gamma and TNF-alpha. Nat Med. 2011;17:1594–1601. doi: 10.1038/nm.2542. [DOI] [PMC free article] [PubMed] [Google Scholar]
- 12.Roelen BA, Dijke P. Controlling mesenchymal stem cell differentiation by TGF-beta family members. J Orthop Sci. 2003;8:740–748. doi: 10.1007/s00776-003-0702-2. [DOI] [PubMed] [Google Scholar]
- 13.Salasznyk RM, Williams WA, Boskey A, et al. Adhesion to vitronectin and collagen I promotes osteogenic differentiation of human mesenchymal stem cells. J Biomed Biotechnol. 2004:24–34. doi: 10.1155/S1110724304306017. [DOI] [PMC free article] [PubMed] [Google Scholar]
- 14.Lecka-Czernik B, Moerman EJ, Grant DF, et al. Divergent effects of selective peroxisome proliferator-activated receptor-gamma 2 ligands on adipocyte versus osteoblast differentiation. Endocrinology. 2002;143:2376–2384. doi: 10.1210/endo.143.6.8834. [DOI] [PubMed] [Google Scholar]
- 15.Cheng SL, Shao JS, Charlton-Kachigian N, et al. Msx2 promotes osteogenesis and suppresses adipogenic differentiation of multipotent mesenchymal progenitors. J Biol Chem. 2003;278:45969–45977. doi: 10.1074/jbc.M306972200. [DOI] [PubMed] [Google Scholar]
- 16.Wang KX, Denhardt DT. Osteopontin: Role in immune regulation and stress responses. Cytokine & Growth Factor Reviews. 2008;19:333–345. doi: 10.1016/j.cytogfr.2008.08.001. [DOI] [PubMed] [Google Scholar]
- 17.Denhardt DT, Noda M. Osteopontin expression and function: Role in bone remodeling. J Cell Biochem. 1998;72:92–102. doi: 10.1002/(SICI)1097-4644(1998)72:30/31+<92::AID-JCB13>3.0.CO;2-A. [DOI] [PubMed] [Google Scholar]
- 18.Wang KX, Shi YF, Denhardt DT. Osteopontin regulates hindlimb-unloading-induced lymphoid organ atrophy and weight loss by modulating corticosteroid production. Proc Natl Acad Sci USA. 2007;104:14777–14782. doi: 10.1073/pnas.0703236104. [DOI] [PMC free article] [PubMed] [Google Scholar]
- 19.Liaw L, Birk DE, Ballas CB, et al. Altered wound healing in mice lacking a functional osteopontin gene (spp1) J Clin Invest. 1998;101:1468–1478. doi: 10.1172/JCI1122. [DOI] [PMC free article] [PubMed] [Google Scholar]
- 20.Rittling SR, Chambers AF. Role of osteopontin in tumour progression. Br J Cancer. 2004;90:1877–1881. doi: 10.1038/sj.bjc.6601839. [DOI] [PMC free article] [PubMed] [Google Scholar]
- 21.Chabas D, Baranzini SE, Mitchell D, et al. The influence of the proinflammatory cytokine, osteopontin, on autoimmune demyelinating disease. Science. 2001;294:1731–1735. doi: 10.1126/science.1062960. [DOI] [PubMed] [Google Scholar]
- 22.Rickard DJ, Sullivan TA, Shenker BJ, et al. Induction of rapid osteoblast differentiation in rat bone marrow stromal cell cultures by dexamethasone and BMP-2. Dev Biol. 1994;161:218–228. doi: 10.1006/dbio.1994.1022. [DOI] [PubMed] [Google Scholar]
- 23.Rittling SR, Matsumoto HN, McKee MD, et al. Mice lacking osteopontin show normal development and bone structure but display altered osteoclast formation in vitro. J Bone Miner Res. 1998;13:1101–1111. doi: 10.1359/jbmr.1998.13.7.1101. [DOI] [PubMed] [Google Scholar]
- 24.Kazanecki CC, Uzwiak DJ, Denhardt DT. Control of osteopontin signaling and function by post-translational phosphorylation and protein folding. J Cell Biochem. 2007;102:912–924. doi: 10.1002/jcb.21558. [DOI] [PubMed] [Google Scholar]
- 25.Ren GW, Su JJ, Zhang LY, et al. Species variation in the mechanisms of mesenchymal stem cell-mediated immunosuppression. Stem Cells. 2009;27:1954–1962. doi: 10.1002/stem.118. [DOI] [PubMed] [Google Scholar]
- 26.Xu GW, Zhang LY, Ren GW, et al. Immunosuppressive properties of cloned bone marrow mesenchymal stem cells. Cell Res. 2007;17:240–248. doi: 10.1038/cr.2007.4. [DOI] [PubMed] [Google Scholar]
- 27.Kazanecki CC, Kowalski AJ, Ding T, et al. Characterization of anti-osteopontin monoclonal antibodies: Binding sensitivity to post-translational modifications. J Cell Biochem. 2007;102:925–935. doi: 10.1002/jcb.21487. [DOI] [PubMed] [Google Scholar]
- 28.Hu DD, Lin ECK, Kovach NL, et al. A biochemical characterization of the binding of osteopontin to integrins alpha v beta 1 and alpha v beta 5. J Biol Chem. 1995;270:26232–26238. doi: 10.1074/jbc.270.44.26232. [DOI] [PubMed] [Google Scholar]
- 29.Hruska KA, Rolnick F, Huskey M, et al. Engagement of the osteoclast integrin alpha v beta 3 by osteopontin stimulates phosphatidylinositol 3-hydroxyl kinase activity. Endocrinology. 1995;136:2984–2992. doi: 10.1210/endo.136.7.7540546. [DOI] [PubMed] [Google Scholar]
- 30.Yeh WC, Cao Z, Classon M, et al. Cascade regulation of terminal adipocyte differentiation by three members of the C/EBP family of leucine zipper proteins. Genes Dev. 1995;9:168–181. doi: 10.1101/gad.9.2.168. [DOI] [PubMed] [Google Scholar]
- 31.Rosen ED, MacDougald OA. Adipocyte differentiation from the inside out. Nat Rev Mol Cell Biol. 2006;7:885–896. doi: 10.1038/nrm2066. [DOI] [PubMed] [Google Scholar]
- 32.Yang HJ, Xia YY, Wang L, et al. A novel role for neural cell adhesion molecule in modulating insulin signaling and adipocyte differentiation of mouse mesenchymal stem cells. J Cell Sci. 2011;124:2552–2560. doi: 10.1242/jcs.085340. [DOI] [PubMed] [Google Scholar]
- 33.Lin FT, Lane MD. CCAAT/enhancer binding protein alpha is sufficient to initiate the 3T3-L1 adipocyte differentiation program. Proc Natl Acad Sci USA. 1994;91:8757–8761. doi: 10.1073/pnas.91.19.8757. [DOI] [PMC free article] [PubMed] [Google Scholar]
- 34.Oh KW, Lee WY, Rhee EJ, et al. The relationship between serum resistin, leptin, adiponectin, ghrelin levels and bone mineral density in middle-aged men. Clin Endocrinol. 2005;63:131–138. doi: 10.1111/j.1365-2265.2005.02312.x. [DOI] [PubMed] [Google Scholar]
- 35.Lee NK, Sowa H, Hinoi E, et al. Endocrine regulation of energy metabolism by the skeleton. Cell. 2007;130:456–469. doi: 10.1016/j.cell.2007.05.047. [DOI] [PMC free article] [PubMed] [Google Scholar]
- 36.Staines KA, MacRae VE, Farquharson C. The importance of the SIBLING family of proteins on skeletal mineralisation and bone remodelling. J Endocrinol. 2012;214:241–255. doi: 10.1530/JOE-12-0143. [DOI] [PubMed] [Google Scholar]
- 37.Zohar R, Lee W, Arora P, et al. Single cell analysis of intracellular osteopontin in osteogenic cultures of fetal rat calvarial cells. J Cell Physiol. 1997;170:88–100. doi: 10.1002/(SICI)1097-4652(199701)170:1<88::AID-JCP10>3.0.CO;2-K. [DOI] [PubMed] [Google Scholar]
- 38.Zohar R, Cheifetz S, McCulloch CAG, et al. Analysis of intracellular osteopontin as a marker of osteoblastic cell differentiation and mesenchymal cell migration. European Journal of Oral Sciences. 1998;106:401–407. doi: 10.1111/j.1600-0722.1998.tb02206.x. [DOI] [PubMed] [Google Scholar]
- 39.Zohar R, Suzuki N, Suzuki K, et al. Intracellular osteopontin is an integral component of the CD44-ERM complex involved in cell migration. J Cell Physiol. 2000;184:118–130. doi: 10.1002/(SICI)1097-4652(200007)184:1<118::AID-JCP13>3.0.CO;2-Y. [DOI] [PubMed] [Google Scholar]
- 40.Segat D, Comai R, Di Marco E, et al. Integrins alpha 6A beta 1 and alpha 6B beta 1 promote different stages of chondrogenic cell differentiation. J Biol Chem. 2002;277:31612–31622. doi: 10.1074/jbc.M203471200. [DOI] [PubMed] [Google Scholar]
- 41.Giancotti FG, Ruoslahti E. Transduction - Integrin signaling. Science. 1999;285:1028–1032. doi: 10.1126/science.285.5430.1028. [DOI] [PubMed] [Google Scholar]
- 42.Martino MM, Mochizuki M, Rothenfluh DA, et al. Controlling integrin specificity and stem cell differentiation in 2D and 3D environments through regulation of fibronectin domain stability. Biomaterials. 2009;30:1089–1097. doi: 10.1016/j.biomaterials.2008.10.047. [DOI] [PMC free article] [PubMed] [Google Scholar]
- 43.Ge CX, Xiao GZ, Jiang D, et al. Critical role of the extracellular signal-regulated kinase-MAPK pathway in osteoblast differentiation and skeletal development. J Cell Biol. 2007;176:709–718. doi: 10.1083/jcb.200610046. [DOI] [PMC free article] [PubMed] [Google Scholar]
- 44.McCarty RC, Gronthos S, Zannettino AC, et al. Characterisation and developmental potential of ovine bone marrow derived mesenchymal stem cells. J Cell Physiol. 2009;219:324–333. doi: 10.1002/jcp.21670. [DOI] [PubMed] [Google Scholar]
- 45.Hicok KC, Du Laney TV, Zhou YS, et al. Human adipose-derived adult stem cells produce osteoid in vivo. Tissue Eng. 2004;10:371–380. doi: 10.1089/107632704323061735. [DOI] [PubMed] [Google Scholar]
- 46.Gronthos S, Zannettino AC, Hay SJ, et al. Molecular and cellular characterisation of highly purified stromal stem cells derived from human bone marrow. J Cell Sci. 2003;116:1827–1835. doi: 10.1242/jcs.00369. [DOI] [PubMed] [Google Scholar]
- 47.Zheng X, Saunders TL, Camper SA, et al. Vitronectin is not essential for normal mammalian development and fertility. Proc Natl Acad Sci U S A. 1995;92:12426–12430. doi: 10.1073/pnas.92.26.12426. [DOI] [PMC free article] [PubMed] [Google Scholar]
- 48.Chapman J, Miles PD, Ofrecio JM, et al. Osteopontin is required for the early onset of high fat diet-induced insulin resistance in mice. Plos One. 2010;5:e13959. doi: 10.1371/journal.pone.0013959. [DOI] [PMC free article] [PubMed] [Google Scholar]
- 49.Kiefer FW, Neschen S, Pfau B, et al. Osteopontin deficiency protects against obesity-induced hepatic steatosis and attenuates glucose production in mice. Diabetologia. 2011;54:2132–2142. doi: 10.1007/s00125-011-2170-0. [DOI] [PMC free article] [PubMed] [Google Scholar]
- 50.Shoelson SE, Lee J, Goldfine AB. Inflammation and insulin resistance. J Clin Invest. 2006;116:1793–1801. doi: 10.1172/JCI29069. [DOI] [PMC free article] [PubMed] [Google Scholar]
- 51.Nilsson SK, Johnston HM, Whitty GA, et al. Osteopontin, a key component of the hematopoietic stem cell niche and regulator of primitive hematopoietic progenitor cells. Blood. 2005;106:1232–1239. doi: 10.1182/blood-2004-11-4422. [DOI] [PubMed] [Google Scholar]
- 52.Stier S, Ko Y, Forkert F, et al. Osteopontin is a hematopoietic stem cell niche component that negatively regulates stem cell pool size. J Exp Med. 2005;201:1781–1791. doi: 10.1084/jem.20041992. [DOI] [PMC free article] [PubMed] [Google Scholar]
- 53.Calvi LM, Adams GB, Weibrecht KW, et al. Osteoblastic cells regulate the haematopoietic stem cell niche. Nature. 2003;425:841–846. doi: 10.1038/nature02040. [DOI] [PubMed] [Google Scholar]
- 54.Zhang JW, Niu C, Ye L, et al. Identification of the haematopoietic stem cell niche and control of the niche size. Nature. 2003;425:836–841. doi: 10.1038/nature02041. [DOI] [PubMed] [Google Scholar]
- 55.Naveiras O, Nardi V, Wenzel PL, et al. Bone-marrow adipocytes as negative regulators of the haematopoietic microenvironment. Nature. 2009;460:259–263. doi: 10.1038/nature08099. [DOI] [PMC free article] [PubMed] [Google Scholar]
Associated Data
This section collects any data citations, data availability statements, or supplementary materials included in this article.
Supplementary Materials
Fig. S1. Phenotypes of wild-type and OPN-/- MSCs and OPN levels in serum and Zs-OPN MSCs. (related to Figure 1)
(A) Blood samples (n=5) were clotted for 2 hours at room temperature before centrifuging at 2000×g at 4°C for 20 min. Serums were collected and OPN was assayed immediately by ELISA. (B) OPN mRNA in total RNA from wild-type MSCs was assayed by real-time PCR and compared to β-actin (defined as 1). (C) Wild-type MSCs and Zs-OPN MSCs (1×10⁵ cells) were cultured in 2 ml complete medium for 60 hours. The supernatant was collected and centrifuged at 1000×g for 10 minutes and the OPN concentration was measured by ELISA. (D) MSC surface markers were analyzed by flow cytometry. OPN-/- or wild-type MSCs were harvested before achieving 90% confluence. Cells were then labeled with the indicated antibodies or isotype controls by direct immunofluorescence staining, and subjected to flow cytometry. Data were analyzed using the FCS Express software. Shaded areas represent isotype controls; purple lines represent specific antibodies. (E) OPN-deficiency expression. OPN mRNA in total RNA from wild-type or OPN-/- MSCs was assayed by real-time PCR. (F) Expression of OPN by Zs-OPN MSCs. Total RNA was extracted from both wild-type and Zs-OPN MSCs and OPN expression was determined by real-time PCR (left panel). Total protein was collected and OPN expression was determined by western blotting analysis (right panel). Antibody for detection of the two isoforms of OPN was purchased from Santa Cruz. sOPN, secreted OPN; iOPN, intracellular OPN. All values are means ± SEM.
Fig. S2. Knockdown of OPN in wild-type MSCs skews the balance of MSC differentiation. (related to Figure 1)
(A) Wild-type MSCs transfected with lentivirus expressing OPN-specific (shOPN) or control (shControl) shRNA were analyzed for OPN expression by real-time PCR (left panel) or western blotting analysis (right panel). (B and C) Cells transfected as in (A) were cultured in adipogenic differentiation medium for 6 days and stained with Oil Red O (bar: 100 μm; adipocytes counted in six random fields from four cultures per group) (B), or in osteogenic differentiation medium or control medium for 17 days and stained with Alizarin Red S (bar: 500 μm) (C). (D) Wild-type MSCs were cultured under the osteogenic differentiation medium with or without recombinant OPN (rmOPN, 1 μg /ml) for 15 days and stained with Alizarin Red S (bar: 500 μm). Values are means ± SEM. ***, P < 0.001. Representative of at least three independent experiments.
Fig. S3. Antibody neutralization of OPN significantly promoted adipogenic differentiation of MSCs. (related to Figure 3)
MSCs within 15 passages were cultured in adipogenic differentiation medium supplemented with OPN-specific monoclonal antibodies (2C5, 1H3F7, and 2A1; 1 μg/ml or 10 μg/ml) or isotype control (10 μg/ml) and renewed after 3 days. On day 6, cells were stained with Oil Red O (bar: 500 μm). Arrows indicated adipocytes. Representative of three independent experiments.
Fig. S4. In vivo quantification of bone mineral density and adipocytes. (related to Figure 6)
(A) Tibia and femur (n=9) were harvested and connective tissue removed before fixing in 4% formaldehyde for 24 hours at room temperature. Fixed bone samples were scanned by micro-CT and analyzed by CTAn software. (B) Freshly isolated tibia and femur (the ends away from the knee were opened) were fixed in 4% formaldehyde for 24 hours at room temperature. The bone samples were embedded and sectioned. The 5 μm undecalcified sections were stained with Goldner's trichrome staining. Adipocytes were large oval-shaped or circular cells with a cell membrane without cytoplasmic staining, indicated by an arrow in the enlargement of the lower right quadrant (bar: 500 μm). (C) The area, number, and mean size of adipocytes were determined by the ImageJ software. Values are means ± SEM, n=5. ns, not significant.
Fig. S5. In vivo quantification of adipocytes and osteoblasts. (related to Figure 6)
Total RNA were extracted from tibia and femur according the protocol by Carter et al. (BMC Biotechnology 2012, 12:5). The expression of adipocyte markers (Fabp4, Glut4, Perilipin, Adiponectin, Leptin) and osteoblast markers (Osteocalcin, Osterix, Collagen I a, Runx2, ALP) were determined by real-time PCR. Values are means ± SEM, n=5. ns, not significant; *, P < 0.05; ***, P < 0.001.