Abstract
In speech-production research, 3D MRI of the upper airway has provided insights into vocal tract shaping and data for its modeling. Small movements of articulators can lead to large changes in the produced sound, therefore improving the resolution of these datasets, within the constraints of a sustained speech sound (6-12 seconds), is an important area for investigation. The purpose of the study is to provide a first application of compressed sensing (CS) to high-resolution 3D upper airway MRI using spatial finite difference as the sparsifying transform, and to experimentally determine the benefit of applying constraints on image phase. Estimates of image phase are incorporated into the CS reconstruction to improve the sparsity of the finite difference of the solution. In a retrospective sub-sampling experiment with no sound production, 5x and 4x were the highest acceleration factors that produced acceptable image quality when using a phase constraint and when not using a phase constraint, respectively. The prospective use of a 5x undersampled acquisition and phase-constrained CS reconstruction enabled 3D vocal tract MRI during sustained sound production of English consonants /s/, /∫/, /l/, and /r/ with 1.5 × 1.5 × 2.0 mm3 spatial resolution and 7 seconds of scan time.
Keywords: compressed sensing, speech production, vocal tract, phase constraint, total variation, regularization
INTRODUCTION
Three-dimensional (3D) imaging of the upper airway during sustained sound production has recently emerged as a promising tool in speech production research as a means to capture the full geometry of the vocal tract. The diversity of tongue shapes and dynamics are made possible, at least in part, through different lingua-palatal bracing mechanisms (1-4) leading to complex airway geometries, the understanding of which is critical for investigations into the production of both normal and disordered speech. In addition to helping shed light on the intricate airway shaping mechanisms underlying the production of various linguistically-meaningful speech sounds, 3D imaging also lends itself to providing quantitative volumetric information of the airway regions. The shaping of the tongue and other articulators, and the temporal characteristics of their shaping, give rise to characteristic patterns of acoustic resonance behavior of the vocal tract that define the properties of human speech that can be modeled with such quantitative information.
Recent work has shown that three-dimensional tongue shape and the dynamics underlying shape formation are critical to understanding natural linguistic classes and issues of phonological representation as evidenced in speech motor control. Previous models of speech production often assumed that the position of maximum constriction, defined in the midsagittal plane, was the main “place of articulation” parameter. Imaging studies such as those by Narayanan et al. (5) have suggested that articulation cannot be characterized solely by identifying a constriction position and that speech production targets go beyond the midsagittal plane. Initial speech studies using MRI focused on vowel sounds (6,7). The models of the vocal tract constructed from the MR images of different vowels yielded good estimations of vowel formant frequencies and formant patterns, which agreed with the general acoustic implication of the notion of the tongue height and backness on vowel articulation. For example, the study by Narayanan et al. (8) that focused on tongue shaping and 3D vocal tract data and models for the American English vowels /a/, /i/, /u/ showed distinct differences in tongue shaping: the anterior tongue was raised and convex for /i/ compared to the lowered concave shape for /a/ while the tongue back showed an opposite trend in the degree of concavity. These data were used in a finite element based simulation of the vocal tract models to study the acoustic properties of the vowel sounds. Other studies have investigated a variety of continuant consonant sounds such as fricatives and liquids. Narayanan et al. (3) examined vocal tract shaping of consonants using MRI and other articulatory measurements, and have presented data and results on three dimensional vocal tract and tongue shapes for fricative sounds produced by talkers of American English. These data showed key differences in tongue shaping between the sibilants /s/ (concave, grooved) and /∫/ (convex, cupped) and were helpful in deriving meaningful acoustic source models for these sounds (9). Using insights gained in imaging work, in conjunction with the quantitative data of vocal tract area functions and sublingual cavity of Alwan et al. (4), Espy-Wilson et al. (10) created acoustic models for the American-English /r/ delineating clearly the role of the oral and pharyngeal constrictions and the sublingual volume. Similar advances have been made toward understanding the acoustics of lateral sounds (11,12). While these studies represent significant progress in speech research, they can be further improved by addressing certain technological limitations.
These previous MRI studies were based on 2D multi-slice acquisitions, requiring multiple repetitions of the same sound and scan-time on the order of several minutes (3-7,11,13,14). These procedures are prone to data inconsistency, resulting from slightly different positions of the jaw, head, and tongue during each repetition. Compared to 2D multi-slice, it is well known that 3D encoding provides contiguous coverage with the potential for thinner slices and improved signal-to-noise ratio (SNR) efficiency. However, 3D encoding with high spatial resolution currently requires prohibitively long scan time and easily exceeds the normal duration of sustained sound production with minimal subject motion.
3D MRI scans may be accelerated using time-efficient k-space sampling (15), parallel imaging (16,17), or with the recently developed approach of compressed sensing (18-21). Many of the efficient k-space sampling schemes (based on spiral and echo-planar trajectories) are prone to severe blurring artifacts and geometric distortions due to off-resonance at the air-tissue boundaries. Parallel imaging requires the design and use of receiver coil arrays where the elements have differing sensitivity over the anatomic region of interest (22). Compressed sensing MRI (CS-MRI) relies only on sparsity of the final reconstructed image in a transform domain (18-21).
In this manuscript, we investigate the use of CS-MRI for accelerated 3D upper airway imaging, and investigate the potential benefit of phase constraints. MR images often have spatially varying phases whose sources may include receiver coil phase, gradient/DAQ delays, off-resonance, flow and motion. Phase constrained (PC) CS, originally proposed by Lustig et al. (20), applies a low spatial resolution phase estimate as part of the encoding function. This is expected to increase sparsity of the solution in certain transform domains (e.g., finite difference). We explore the use of PC-CS in this application, because air-tissue boundaries are the primary features of interest and are expected to experience substantial phase variation due to air-tissue susceptibility. We compare phase estimation from a low-resolution fully sampled regime with a two-stage approach that estimates the object phase map from a non-PC CS reconstruction. In retrospective sub-sampling experiments with no sound production, CS reconstructed images with and without phase constraints were compared qualitatively. Undersampled 3DFT acquisition and PC-CS reconstruction was then prospectively applied with acceleration factors of 3, 4, and 5, to high-resolution 3D vocal tract scanning during sustained sound production of English consonants /s/, /∫/, /l/, /r/, sounds characterized by complex tongue and airway shaping.
THEORY
Consider 3DFT imaging, where ky and kz are the phase encoding directions, and therefore the axes of undersampling. After 1D Fourier transformation along kx, the signal for each x position can be expressed as:
| [1] |
Here, kj is the jth sampled k-space sample location in the (ky, kz) domain and 1 ≤ j ≤ J, where J is the total number of phase encodes. rl is the lth spatial position in the (y, z) image domain, and L is the total number of pixels. φ is the phase in the (y, z) image domain and m is the desired magnitude image (representing amplitude of transverse magnetization) in the (y, z) image domain, and n is the i.i.d. (independent and identically-distributed) additive white Gaussian noise. Because Eq. [1] holds for 1 ≤ j ≤ J, there exist J linear equations that can be expressed as one matrix equation:
| [2] |
Here, the signal vector s is [s(k1)s(k2)...s(kJ)]T, Φ is the J × L Fourier encoding matrix, where Φ(j, l) = e-i2πkj·rl, P is an L × L diagonal matrix, where the lth diagonal element is eiϕ(rl). m = [m(r1)m(r2)..m(rL)]T is the unknown image estimate and n = [n(k1)n(k2)..n(kJ)]T. When J << L, Eq. [2] becomes a highly underdetermined linear system, and infinitely many solutions for m exist. Compressed sensing theory states that m can be exactly recovered with a very high probability when m is sparse in a transform domain, by minimizing the l1-norm of the sparsifying transform of the solution under the constraint that ∥s - ΦPm∥2 is close to zero. Unconstrained optimization is more practical for large-scale reconstruction problems such as MRI image reconstruction, therefore, the unknown image estimate m is obtained by minimizing the following convex function:
| [3] |
Here, λ is a regularization parameter that controls the relative weight of sparsity and data fitting, and Ψ is a sparsifying transform (e.g., wavelets, curvelets, or finite difference). In this work, we adopted the finite difference sparsifier that contains the horizontal and vertical gradients of the image. In the absence of P (i.e., P is the identity matrix), the optimization problem is referred to as non-phase-constrained CS reconstruction. In phase constrained CS reconstruction, P contains a predetermined estimate of the object phase, which may originate from system delays, receiver coil phase, and phase accrual due to off-resonance.
MATERIALS AND METHODS
Data Acquisition
Experiments were performed on a Signa Excite HD 3.0 T scanner (GE Healthcare, Waukesha, WI) with gradients capable of 40 mT/m amplitude and 150 mT/m/ms slew rate. The receiver bandwidth was set to ±125 kHz (i.e., 4 μs sampling rate). A birdcage head coil was used for RF transmission and signal reception. Each subject was screened and provided informed consent in accordance with institutional policy.
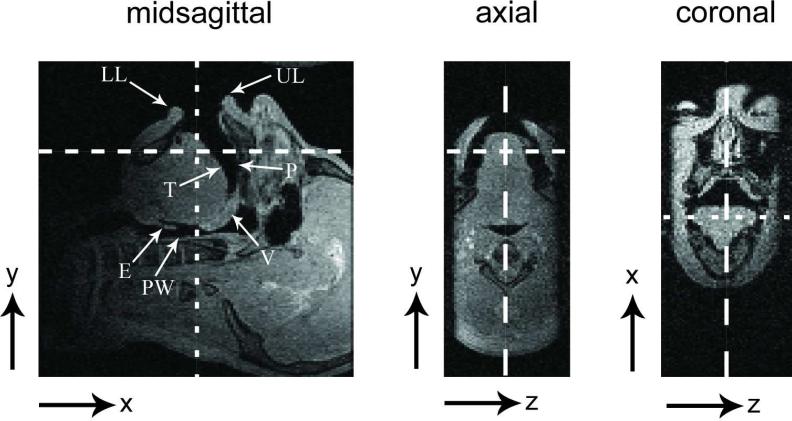
The vocal tract region of interest was imaged using a single midsagittal slab with 8-cm thickness in the right-left (R-L) direction. The readout direction was superior-inferior (S-I) and the phase encode directions were anterior-posterior (A-P) and right-left (R-L) (see Fig. 1). A gradient echo sequence was used with TE = 2.2 msec, TR = 4.6 msec, flip angle = 5°, NEX = 1, spatial resolution = 1.5 × 1.5 × 2.0 mm3, and FOV = 24 × 24 × 10 cm3.
Figure 1.
Illustration of scan plane prescription, which is used for the 3D upper airway imaging. The dashed lines indicate the orthogonal slice orientation of each image. The largest-width, medium-width, and smallest-width dashed lines are for the prescription of the midsagittal, coronal, and axial slices, respectively. An 8 cm sagittal slab excitation is applied to cover the vocal tract volume of interest. The readout direction is along S-I so that the analog low-pass filter suppresses uninteresting regions (e.g., the brain and neck). The features of interest include: [LL] lower lip, [UL] upper lip, [P] palate, [T] tongue surface, [V] velum, [PW] pharyngeal wall, [E] epiglottis.
Pseudo-random undersampling was implemented as follows. First, two independent and uniformly distributed random numbers corresponding to k-space radius and azimuthal angle were generated to create pseudo random (ky, kz) location in polar form. From the randomly chosen samples, the nearest (ky, kz) Cartesian phase encodes were selected for sampling. This scheme achieves a sampling density that is inversely proportional to k-space radius. Second, a low spatial frequency, whose outermost k-space radius was 30 % of the full k-space radius, was fully sampled. The final sampling patterns and corresponding reduction factors are shown in Fig. 2.
Figure 2.
k-space sampling patterns used in the experimental studies. Relative reduction factors are (a) 1, (b) 1.3, (c) 3, (d) 4, and (e) 5. Note that an ellipse with radii 30% of the overall k-space radii was fully sampled in all cases for the estimation of low-resolution image phase.
Image Reconstruction
Since all datasets were fully sampled along the readout (kx) direction, data were first inverse-Fourier transformed along the readout direction, and image reconstruction was performed separately for each y-z planar section. For each x position, fully sampled datasets were reconstructed using 2D inverse Fourier transform (IFT). For the simulated and real undersampled acquisitions, un-acquired k-space locations were filled with zeros prior to inverse Fourier transformation.
For PC-CS, the phase map was calculated in two ways: (PC-I) Taking a 2D inverse Fourier transform of fully sampled low spatial frequency data. In order to remove Gibbs ringing artifacts due to k-space truncation, the low spatial frequency dataset was multiplied by a 2D Hanning window. (PC-II) Taking the phase of the complex-valued image estimate obtained from a non-PC CS iterative reconstruction. To avoid noise contamination, the PC-II phase map was masked to contain only spatial locations where the magnitude image was greater than 20 % of its maximum value.
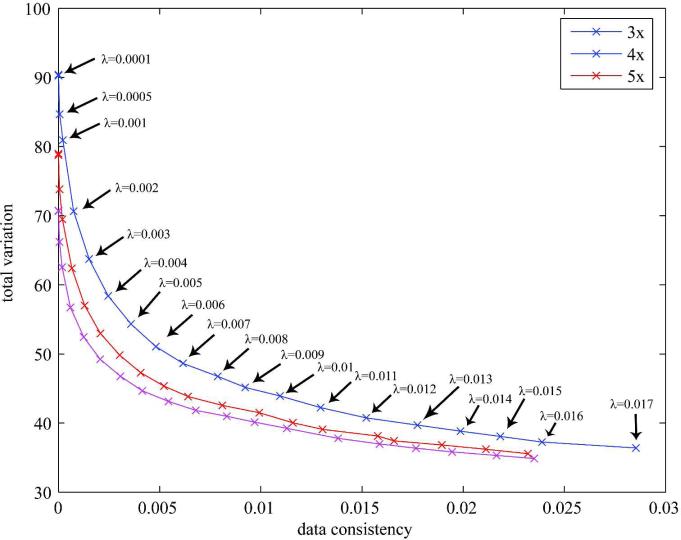
CS reconstructions from undersampled datasets were based on an iterative non-linear conjugate gradient algorithm (20) which sought to find a global minimum for the cost function in Eq [3]. The l1-norm of the finite difference of the solution (also known as Total Variation (23)) was used as a regularizer. The regularization parameter λ was chosen based on the L-curve method (24). We examined the tradeoff between data consistency and total variation for a broad range of λ values (see Fig. 3) prior to selecting a λ value for prospective scans. To speedup reconstructions over a broad range of λ values, the final image from a particular λ value was used as the initial image estimate for the CS reconstruction with the next higher λ value.
Figure 3.
L-curve for the selection of regularization parameter λ for CS reconstruction of the 3D upper airway data with reduction factors of 3, 4, and 5. The CS reconstruction was terminated at the 1000th iterate. The plotted points (x) and their corresponding regularization parameter values (λ) are shown for reduction factor 3. Virtually identical patterns were observed for reduction factors 4 and 5. The corners of the L-curve are not sharp, but provide a clear trade-off between total variation (sparsity) and data consistency.
In-vivo Experiments
Subjects were in supine position and their heads were immobilized by inserting foam pads between their ears and the receiver coil. A fully sampled dataset without sound production was acquired in one trained subject. Their mouth was held open for 36 seconds without swallowing. A total of 8000 (ky, kz) encodes, where the number of ky and kz encodes was 160 and 50, respectively, was used to fully cover 3D k-space at the Nyquist rate. This dataset was retrospectively sub-sampled to simulate the sampling patterns shown in Fig. 2. The CS reconstructions were performed both without and with phase constraints.
Prospective accelerated acquisitions were performed by imaging the vocal tract shaping during each sustained sound production of English consonants /s/, /∫/, /l/, and /r/. Scan time for the 3, 4, and 5-fold accelerated acquisitions took 12, 9, and 7 seconds, respectively. 2D CS reconstruction was performed for each axial slice. The initial estimate for the CS reconstruction of a slice was taken from the final image estimate obtained from the CS reconstruction of its adjacent slice. PC-CS reconstruction was applied with λ = 0.005 and 100 iterations for 65 contiguous slices of interest along x (i.e., S-I direction). 3D visualization of tongue shape was realized by manually segmenting the tongue in each reconstructed coronal image, stacking the segmented slices, and finally performing 3D volume rendering using the vol3d.m Matlab routine (publicly available at http://www.mathworks.com). The final volume rendered tongue surfaces were able to be displayed at any view angle, providing efficient visualization of tongue shaping.
RESULTS
Figure 3 shows an L-curve obtained from the non-PC CS reconstruction. The corner of the L-curve was not sharp and λ = 0.005, which lies on highest curvature, was chosen as an optimal regularization parameter for both the non-PC and PC CS reconstructions. For large values of λ (i.e., λ > 0.01 in Fig. 3), reconstruction strongly favored minimization of total variation so that reconstructed images were observed to be overly smooth.
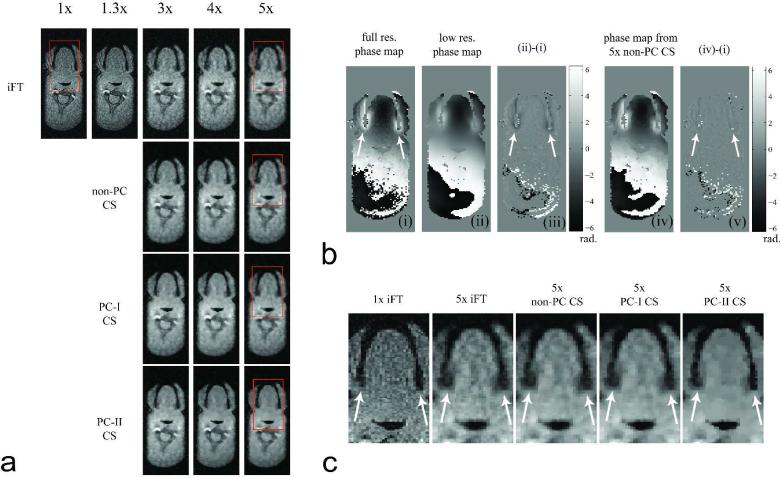
Figure 4 shows images from one axial slice extracted from 3D volume in the retrospective sub-sampling experiment. Figure 4a contains images obtained from IFT, non-PC CS, PC-I CS, and PC-II CS reconstructions of the datasets sub-sampled with different reduction factors. The image from the elliptic k-space full sampling (1.3x) was comparable in image quality to that from the rectangular k-space full sampling (1x). The IFT reconstructed images from the undersampled data exhibited incoherent aliasing artifacts and the image quality was degraded with higher reduction factors. The non-PC CS reconstruction improved image quality over the IFT reconstruction in terms of de-noising and enhancement of the air-tissue boundaries. The PCI and PC-II CS reconstructions further improved the boundary depiction quality for reduction factors 3, 4, and 5. Figure 4b contains phase difference images after the low and high resolution phase maps were subtracted from the full resolution fully sampled reference phase map. Notice the larger phase errors in the low resolution phase map (see Fig. 4b(iii)) particularly in the ROIs with rapid phase variations (indicated by the white arrows in Fig. 4b(i,iii,v)). Figure 4c compares the boundary depiction in ROIs with rapid phase variation for different reconstruction schemes. The PC-II CS reconstruction clearly improved the depiction of the air-tissue boundaries compared to PC-I CS reconstruction (see white arrows in Fig. 4c).
Figure 4.
Axial slice reconstructions from retrospective sub-sampling of fully sampled data. (a) Magnitude images reconstructed by use of inverse Fourier transform (iFT), non-phase-constrained compressed sensing (CS), PC-I CS, and PC-II CS reconstructions of 1x, 1.3x, 3x, 4x, 5x sub-sampled data. (b) (i) Full-resolution phase map from fully sampled 1x data. (ii) Low-resolution phase map from fully sampled low-frequency data. (iii) Phase difference between phase maps (i) and (ii). (iv) Phase map from non-PC CS reconstruction of 5x sub-sampled data. (v) Phase difference between phase maps (i) and (iv). (c) Magnified ROIs inside the red rectangle in (a). Notice the sharp depiction of the air tissue boundaries in 5x PC-II CS reconstructed image (see the white arrows in (c)).
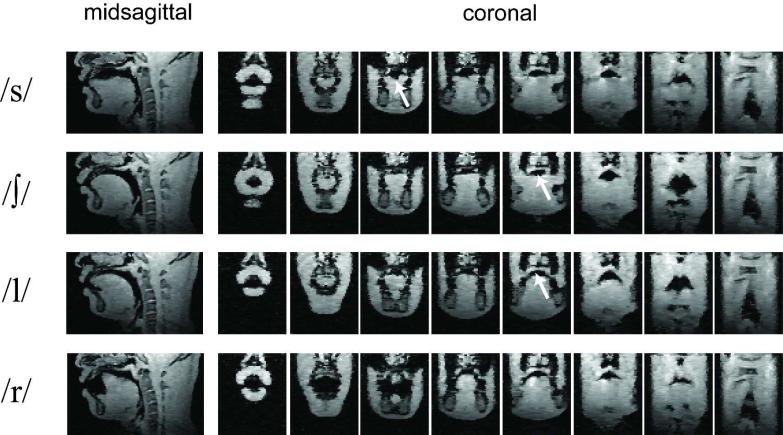
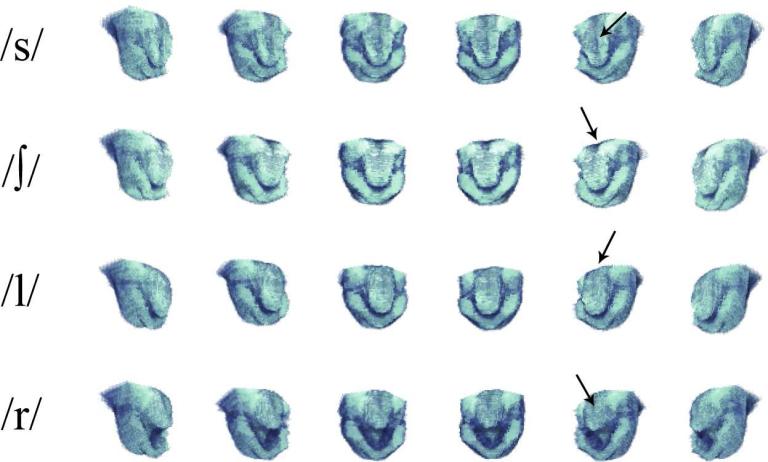
Figure 5 shows a midsagittal slice and eight equally spaced coronal slices reformatted from a 3D vocal tract volume obtained after the PC-II CS reconstructions. 3D imaging provided many useful vocal tract shaping features that cannot be captured by 2D midsagittal imaging alone. The groove of the tongue surface could be clearly observed in coronal sections in /s/ (see the white arrow in the /s/ row of Fig. 5). /∫/ and /l/ sounds exhibited very similar vocal tract shaping patterns in the midsagittal scan plane, but when comparing the coronal slices, the vocal tract cross sectional areas were significantly different (see the white arrows in the /∫/ and /l/ rows in Fig. 5). Figure 6 shows a 3D visualization of the tongue surface for each sound production of /s/, /∫/, /l/, and /r/. The groove of the tongue was clearly seen for the fricative /s/ and /∫/ sounds, but it was not observed for the /l/ sound. The cupping of the tongue was observed in the /r/ sound.
Figure 5.
Reformatted 2D midsagittal and coronal images after the PC-II CS reconstructions of the 5x undersampled 3DFT dataset. The prospective use of accelerated 3DFT scanning required just 7 seconds of scan time during which one trained subject produced each sustained English consonant /s/, /∫/, /l/, and /r/. This achieved 1.5 × 1.5 × 2.0 mm3 resolution over a 24 × 24 × 10 cm3 FOV. Representative 2D midsagittal images are shown in the leftmost column. Eight representative coronal slices of interest are shown that are ordered from lips to pharyngeal wall. Important articulatory features provided by the 3D vocal tract dataset include: (1) groove of the tongue surface for fricative sound /s/ (see the arrow in the /s/ row) and (2) wider shaping of the vocal tract between the hard palate and the tongue front for /l/ indicating the curving of the tongue sides to allow airflow along the sides (for the comparison, see the arrows in the /∫/ and /l/ rows) although their 2D midsagittal slices exhibit similar shaping patterns.
Figure 6.
3D visualization of the tongue and lower jaw after the PC-II CS reconstructions from the dataset prospectively acquired with 5x acceleration. Tongue grooves are seen for /s/ and /∫/, further forward in /s/ than /∫/, but not for /l/ (see the arrows in /s/, /∫/, and /l/). Cupping of the tongue (i.e., cavity behind the tongue front) is seen for /r/ (see the arrow in /r/).
DISCUSSION
The major sources of phase include: 1) receiver coil phase, 2) spatial frequency offset due to field inhomogeneity and air-tissue magnetic susceptibility difference, and 3) gradient/DAQ timing delay. These may be estimated from separate calibration scans or via self-calibration, which was chosen in this study. Self-calibration avoids possible errors caused by the vocal tract geometry changing between calibration scans and accelerated scans. It is noted that the features of interest are air-tissue boundaries such as the tongue surface, lips, hard palate, velum, and epiglottis which are coordinated for the generation of unique gestures depending on different articulation tasks. Even two separate productions of the same sound/articulation task could result in slightly different vocal tract shaping, and has been a source of difficulty widely reported in the literature.
The PC-II CS reconstruction utilized a relatively high spatial resolution phase map obtained from the non-PC CS reconstruction and improved the depiction of the air-tissue boundaries with large degree of phase variation, particularly at high acceleration factors. The phase map estimate may be prone to artifacts due to imperfect CS reconstruction, but it does tend to contain the rapidly varying phase information, while the low spatial resolution phase map does not. A drawback of the PC-II CS reconstruction is an increased reconstruction time because of the need for an additional iterative CS reconstruction just for the phase estimate.
The use of TV regularization was effective at improving the depiction of air-tissue boundaries and suppressing noise-like aliasing artifacts, and was more effective when combined with the phase-constrained reconstruction technique. The de-noising and edge-preserving characteristics can improve the performance of the subsequent image processing tasks (e.g., Canny edge detection, image segmentation) for the quantification process such as the measurement of the vocal tract area function. The degree of the influence of TV regularizer was controlled by the choice of the regularization parameter λ. The L-curve analysis provided the insight of choosing an appropriate λ. Moreover, the wavelet or curvelet transform can be used as another sparsifying basis and the reconstruction may be improved by incorporating an additional regularizer into the optimization function.
A drawback of the method is that reconstruction is computationally intensive and requires a considerable reconstruction time. The convergence speed of the algorithm was observed to decrease as either a higher acceleration factor or a large value of the regularization parameter is used. For the generation of a 3D volume of the upper airway, 100 iterations were used to reconstruct a single image and this iterative reconstruction was processed for 65 contiguous slices of interest along x. The generation of a 3D volume when using PC CS took approximately 4 hours on a 3.4 GHz of CPU with 3.0 GB of RAM.
In this work, the CS reconstructions were performed in two dimensions (y, z) after 1D IFT along kx. If computation time and memory size were not issues, there are potential benefits to solving the CS optimization in 3D directly. Sparsity along x would allow for some additional denoising, and there would be an opportunity to correct shifts in x-position due to off-resonance if the different sources of image phase could be separated.
Although not shown here, the use of coil arrays (e.g., 8-channel neurovascular array in our work) can improve the SNR in 3D upper airway imaging. If the combined use of parallel imaging and compressed sensing were adopted, significantly higher accelerations would be achievable (20,21,25,26). Linguistically relevant high resolution features such as tongue tip constrictions and epiglottis would be easily resolved. Moreover, it may be possible to measure the vocal tract area function with greater precision, therefore improving the accuracy of the quantitative analysis of vocal tract shaping in both normal and disordered speech production.
CONCLUSIONS
We have demonstrated the application of compressed sensing (CS) MRI to high-resolution 3D imaging of the vocal tract during a single sustained sound production task (no repetitions needed). Phase constrained CS outperformed conventional CS in spatial locations with large phase variations (lateral edges of the tongue). We have demonstrated that 5x acceleration is achievable with PC CS, with negligible loss of tissue boundary information that is relevant to speech production research. We have demonstrated a 3D upper airway imaging using an undersampled 3DFT gradient echo acquisition with a 1.5 × 1.5 × 2.0 mm3 spatial resolution in 7 seconds, which is a duration practical for sustained sound production.
ACKNOWLEDGEMENTS
This work was supported by NIH Grant R01 DC007124-01. We acknowledge the support and collaboration of the Speech Production and Knowledge group at the University of Southern California. We also acknowledge Michael Lustig and Jong Chul Ye for useful discussion.
Grant Sponsors: National Institutes of Health (#R01-DC007124-01);
REFERENCES
- 1.Stone M, Faber A, Cordaro M. Cross-sectional tongue movement and tongue-palate movement in [s] and [sh] syllables. Proceedings of the 13th International Congress of Phonetic Sciences, Universite de Provence. 1991:354–357. [Google Scholar]
- 2.Stone M, Faber A, Raphael LJ, Shawker TH. Cross-sectional tongue shapes and linguopalatal contact patterns in [s], [sh], and [l]. J Phonetics. 1992;20(2):253–270. [Google Scholar]
- 3.Narayanan SS, Alwan AA, Haker K. An articulatory study of fricative consonants using magnetic resonance imaging. J Acoust Soc Am. 1995;98(3):1325–1347. [Google Scholar]
- 4.Alwan A, Narayanan S, Haker K. Toward articulatory-acoustic models for liquid consonants based on MRI and EPG data. Part II: The rhotics. J Acoust Soc Am. 1997;101:1078–1089. doi: 10.1121/1.417972. [DOI] [PubMed] [Google Scholar]
- 5.Narayanan S, Byrd D, Kaun A. Geometry, kinematics, and acoustics of Tamil liquid consonants. J Acoust Soc Am. 1999:1993–2007. doi: 10.1121/1.427946. [DOI] [PubMed] [Google Scholar]
- 6.Baer T, Gore JC, Gracco LC, Nye PW. Analysis of vocal tract shape and dimensions using magnetic resonance imaging: Vowels. J Acoust Soc Am. 1991;90(2):799–828. doi: 10.1121/1.401949. [DOI] [PubMed] [Google Scholar]
- 7.Story BH, Titze IR. Vocal tract area functions from magnetic resonance imaging. J Acoust Soc Am. 1996;100(1):537–554. doi: 10.1121/1.415960. [DOI] [PubMed] [Google Scholar]
- 8.Narayanan S, Alwan A, Song Y. New results in vowel production: MRI, EPG, and acoustic data. Proc EuroSpeech, Rhodes, Greece. 1997;1:1007–1010. [Google Scholar]
- 9.Narayanan S, Alwan A. Noise source models for fricative consonants. IEEE Trans Speech and Audio Processing. 2000;8(3):328–344. [Google Scholar]
- 10.Espy-Wilson CY, Boyce SE, Jackson MTT, Narayanan S, Alwan A. Acoustic modeling of the American English /r/. J Acoust Soc Am. 2000;108(1):343–356. doi: 10.1121/1.429469. [DOI] [PubMed] [Google Scholar]
- 11.Bangayan P, Alwan A, Narayanan S. From MRI and acoustic data to articulatory synthesis: A case study of the lateral approximants in American English.. Proceedings of the Intl Conf Spoken Lang Processing; Philadelphia, PA. 1996.pp. 793–796. [Google Scholar]
- 12.Zhang Z, Espy-Wilson CY. A vocal-tract model of American English /l/. J Acoust Soc Am. 2004;115(3):1274–1280. doi: 10.1121/1.1645248. [DOI] [PubMed] [Google Scholar]
- 13.Narayanan S, Alwan A, Haker K. Toward articulatory-acoustic models for liquid consonants based on MRI and EPG data. Part I: The laterals. J Acoust Soc Am. 1997;101:1064–1077. doi: 10.1121/1.418030. [DOI] [PubMed] [Google Scholar]
- 14.Zhou X, Espy-Wilson CY, Boyce S, Tiede M, Holland C, Choe A. A magnetic resonance imaging-based articulatory and acoustic study of “retroflex” and “bunched” American English /r/. J Acoust Soc Am. 2008;123(6):4466–4481. doi: 10.1121/1.2902168. [DOI] [PMC free article] [PubMed] [Google Scholar]
- 15.Irarrazabal P, Nishimura DG. Fast three dimensional magnetic resonance imaging. Magn Reson in Med. 1995;33:656–662. doi: 10.1002/mrm.1910330510. [DOI] [PubMed] [Google Scholar]
- 16.Griswold MA, Jakob PM, Heidemann RM, Nittka M, Jellus V, Wang J, Kiefer B, Haase A. Generalized autocalibrating partially parallel acquisitions (GRAPPA). Magn Reson in Med. 2002;47:1202–1210. doi: 10.1002/mrm.10171. [DOI] [PubMed] [Google Scholar]
- 17.Pruessmann KP, Weiger M, Scheidegger MB, Boesiger P. SENSE: sensitivity encoding for fast MRI. Magn Reson Med. 1999;42:952–962. [PubMed] [Google Scholar]
- 18.Candes EJ, Romberg J, Tao T. Robust uncertainty principles: Exact signal reconstruction from highly incomplete frequency information. IEEE Trans Info Theory. 2006;52(2):489–509. [Google Scholar]
- 19.Donoho DL. Compressed Sensing. IEEE Trans Info Theory. 2006;52(4):1289–1306. [Google Scholar]
- 20.Lustig M, Donoho D, Pauly JM. Sparse MRI: The application of compressed sensing for rapid MR imaging. Magn Reson Med. 2007;58:1182–1195. doi: 10.1002/mrm.21391. [DOI] [PubMed] [Google Scholar]
- 21.Block KT, Uecker M, Frahm J. Undersampled radial MRI with multiple coils. Iterative image reconstruction using a total variation constraint. Magn Reson in Med. 2007;57:1086–1098. doi: 10.1002/mrm.21236. [DOI] [PubMed] [Google Scholar]
- 22.Hayes CE, Carpenter C, Evangelou IE, Chi-Fishman G. Design of a highly sensitive 12-channel receive coil for tongue MRI.. Proceedings of the 15th Annual Meeting of ISMRM; Berlin. 2007.p. 449. [Google Scholar]
- 23.Rudin LI, Osher S, Fatemi E. Nonlinear total variation noise removal algorithm. Physica D. 1992;60(1-4):259–268. [Google Scholar]
- 24.Hansen PC. Analysis of discrete ill-posed problems by means of the L-curve. SIAM Review. 1992;34(4):561–580. [Google Scholar]
- 25.King KF. Combined compressed sensing and parallel imaging.. Proceedings of the 16th Annual Meeting of ISMRM; Toronto. 2008.p. 1488. [Google Scholar]
- 26.Marinelli L, Hardy CJ, Blezek DJ. MRI with accelerated multi-coil compressed sensing.. Proceedings of the 16th Annual Meeting of ISMRM; Toronto. 2008.p. 1484. [Google Scholar]


