

Abstract
Rheumatoid arthritis (RA) is a chronic inflammatory joint disease with episodic flares. In TNF-Tg mice, a model of inflammatory–erosive arthritis, the popliteal lymph node (PLN) enlarges during the pre-arthritic ‘expanding’ phase, and then ‘collapses’ with adjacent knee flare associated with the loss of the intrinsic lymphatic pulse. As the mechanisms responsible are unknown, we developed in vivo methods to quantify lymph viscosity and pressure in mice with wild-type (WT), expanding and collapsed PLN. While no differences in viscosity were detected via multiphoton fluorescence recovery after photobleaching (MP-FRAP) of injected FITC-BSA, a 32.6% decrease in lymph speed was observed in vessels afferent to collapsed PLN (P < 0.05). Direct measurement of intra-lymph node pressure (LNP) demonstrated a decrease in expanding PLN versus WT pressure (3.41 ± 0.43 vs. 6.86 ± 0.56 cmH2O; P < 0.01), which dramatically increased to 9.92 ± 1.79 cmH2O in collapsed PLN. Lymphatic pumping pressure (LPP), measured indirectly by slowly releasing a pressurized cuff occluding indocyanine green (ICG), demonstrated an increase in vessels afferent to expanding PLN versus WT (18.76 ± 2.34 vs. 11.04 ± 1.47 cmH2O; P < 0.01), which dropped to 2.61 ± 0.72 cmH2O (P < 0.001) after PLN collapse. Herein, we document the first in vivo measurements of murine lymph viscosity and lymphatic pressure, and provide evidence to support the hypothesis that lymphangiogenesis and lymphatic transport are compensatory mechanisms to prevent synovitis via increased drainage of inflamed joints. Furthermore, the decrease in lymphatic flow and loss of LPP during PLN collapse are consistent with decreased drainage from the joint during arthritic flare, and validate these biomarkers of RA progression and possibly other chronic inflammatory conditions.
Introduction
Rheumatoid arthritis (RA) has long been recognized as a prevalent autoimmune disease that affects 1% of the population (Firestein, 2003) with salient pathological features characterized by chronic synovial inflammation that waxes and wanes with episodic flares. These joint flares are associated with significant morbidity and loss of function. However, the mechanisms responsible for the vacillations of disease activity are poorly understood. Recently, research efforts have focused on the lymphatic system based on the concept that alterations in lymphatic flow may be of importance in the fluctuating course observed in chronic inflammatory diseases including RA (Cueni & Detmar, 2008; Chakraborty et al. 2010; Buckland, 2011; Aldrich & Sevick-Muraca, 2013). Studies with TNF transgenic mice (TNF-Tg), a model of chronic RA (Keffer et al. 1991), have provided valuable insights into the pathophysiology of inflammatory–erosive arthritis. Inflamed joints in this model have been analysed with contrast enhanced (CE) MRI, which demonstrated that draining popliteal lymph nodes (PLN) undergo a striking increase in volume during the pre-arthritic ‘expanding’ phase and subsequently ‘collapse’ (Guo et al. 2009; Li et al. 2010, 2011). This PLN collapse (i.e. reduction in lymph node volume and contrast enhancement), is accompanied by the migration of a subset of CD21hi/CD23+/IgMhi/CD1d+ B cells in inflamed nodes (B-in) into the paracortical sinuses (Li et al. 2010). Most recently it has been shown that B-in clogging of the PLN can be ameliorated by anti-CD20 B cell depletion therapy (BCDT) via the restoration of lymphatic egress from inflamed joints (Li et al. 2013). Additional alterations in lymphoid biology during inflammatory arthritis include increased vascular endothelial growth factor c (VEGF-C)-dependent lymphangiogenesis, especially within the PLN (Zhang et al. 2007, 2011), and diminished lymphatic pulse as determined by near infrared-indocyanine green (NIR-ICG) imaging (Li et al. 2013; Zhou et al. 2011). While loss of the lymphatic pulse and draining lymph node collapse are now recognized as important biomarkers of flare in RA patients (Manzo et al. 2011), progress towards a therapeutic intervention has stalled due to a lack of knowledge regarding the mechanisms that govern these pathological events, and the absence of methods to quantify lymphatic function in humans, which has only recently been achieved (Rasmussen et al. 2010; Zhang et al. 2012).
Since the lymphatic system is responsive to mechanical changes, such as pressure (McHale & Roddie, 1976; Hargens & Zweifach, 1977) and stretch (Davis et al. 2012; Scallan et al. 2012), two important parameters that could be involved in arthritic flare that have yet to be investigated are changes in viscosity and pressure within lymphatic vessels and lymph nodes efferent to inflamed joints. In the case of viscosity, an additional rationale for its study in RA flare comes from the known role of blood viscosity changes in stroke (Coull et al. 1991), and plasma cell dyscrasias (Mehta, 2003), in which increased viscosity results in decreased blood flow. Furthermore, RA synovial fluid was shown to have a lower relative viscosity versus that of osteoarthritis, possibly due to the decrease in concentration of hyaluronic acid found in RA patients (Balazs, 1967; Swann et al. 1974; Reimann, 1976). However, while viscometer measurements of canine lymph have been achieved via direct collection from the thoracic duct (Burton-Optiz & Nemser, 1917), these studies cannot be performed within murine models due to their small size. Thus, optical in vivo techniques, such as multiphoton fluorescence recovery after photobleaching (MP-FRAP) (Brown et al. 1999; Sullivan et al. 2009), are required to assess lymph viscosity changes in small animals.
Intraluminal pressure has been shown to regulate lymphatic muscle cell contractile function (McHale & Roddie, 1976), and the pressure threshold at which a contraction occurs has been delineated to be 11 ± 4.1 cmH2O (Hargens & Zweifach, 1977). Furthermore, lymphatic pumping pressure (LPP) has been measured in humans by injecting ICG distal to the lymphatic vessels and using an inflatable cuff to observe the LPP that overcomes the occluding pressure, which revealed that LPP is decreased in lymphoedema patients (Unno et al. 2010). Similarly, intra-LN pressure (LNP) measured in sentinel LN of breast cancer patients has shown a correlation with tumour metastases size, with the observation that very high pressures are found when tumour replaces much of the LN (Nathanson & Mahan, 2011). Given that these approaches are potentially scalable to small animal models, efforts to adapt them to quantify LPP and LNP in mice are warranted. To this end, we describe here the first in vivo measurements of murine lymph viscosity, LPP and LNP and assess the role of these parameters in PLN collapse and arthritic flare.
Methods
Ethical approval
The research was conducted with approval by the University of Rochester Institutional Animal Care and Use Committee.
Animals
The 3647 line of TNF-Tg mice (Keffer et al. 1991) were originally obtained from Dr G. Kollias and are maintained as heterozygotes in a C57BL/6 background. During CE-MRI, power Doppler ultrasound (PD-US) and LNP and LPP measurements, animals were anaesthetized with 1.5% isoflurane in oxygen. During MP-FRAP, animals were anaesthetized with intraperitoneal injection of ketamine (60 mg kg−1) and xylazine (4 mg kg−1). After the experiments, mice were euthanized with either CO2 asphyxiation or sodium pentobarbital overdose and a secondary method of cervical dislocation.
CE-MRI and analysis
MRI scans were performed in a 3T Siemens Trio (Siemens Medical Solutions, Erlangen, Germany) as described previously (Proulx et al. 2007a,b2007b, 2008). Briefly, TNF-Tg mice were anaesthetized and the knee and ankle were inserted into a customized coil. After a pre-contrast MRI scan, gadolinium-diethylenetriamine pentaacetic acid (Gd-DTPA) contrast (Omniscan, Amersham Health, Oslo, Norway) was injected via orbital venous plexus at 0.5 ml kg−1. The second scan was started 5 minutes after injection to allow for circulation of Gd-DTPA.
CE-MRI was used to measure lymph node contrast enhancement (LNCE). Amira (TGS Unit, Mercury Computer Systems, San Diego, CA, USA) was used to quantify this parameter as described previously (Proulx et al. 2007a,b2007b, 2008). Briefly, the 3D stack of pre-contrast scans was aligned with post-contrast scans via automatic registration. Then, a stack of images was generated by subtracting the pre-contrast scans from the post-contrast scans using the Arithmetic module. The PLN volume was segmented by manually drawing region of interests (ROIs) on the 3D stack. The delineation of the PLN from the surrounding fat pad tissue was determined based on signal intensity >1500 arbitrary units (a.u.). LNCE is defined as the LN signal intensity divided by the mean muscle signal intensity.
PD-US and analysis
PLN were imaged with a high-resolution small animal ultrasound system (VisualSonics 770, Toronto, Ontario, Canada) using a 704 scanhead as previously described (Bouta et al. 2013). Hair was removed from ankle to hip with a depilatory cream and the mouse placed in the supine position on the 37°C heated imaging platform. Paws were taped to surface electrodes for heart rate monitoring and respiratory rate synchronization. B mode and PD scans were performed of the entire fat pad in which the PLN resides with a wall filter of 2.5 mm s−1, a scan speed of 2 mm s−1, dynamic range of 13.13–24.06 dB and the number of pulses to radio-frequency (RF) cycles as two. After imaging was complete, data analysis was accomplished using Amira. First, the PLN was manually segmented and the PD signal was thresholded (>64 a.u.) to encompass the PD signal. Then, a mask was created by using the Arithmetic module using the expression A × (B>0), where A refers to the PD signal and B refers to the mask (PLN). This leaves a volume positive for Doppler signal that occupies the PLN, which can be quantified via the Material Statistics module. Then, the PD signal within the PLN was normalized by the volume of the PLN to derive the normalized PD volume (NPDV).
PLN phenotyping
PLN studied in LPP and LNP experiments were phenotyped via CE-MRI as expanding or collapsed based on LNCE as previously described (Li et al. 2011), in which a LNCE < 4.5 a.u. was considered collapsed and LNCE > 4.5 a.u. was considered expanding (Bouta et al. 2013). PLN studied in MP-FRAP experiments were phenotyped via PD-US to measure NPDV as previously described (Bouta et al. 2013). PLN with NPDV > 0.023 were defined as expanding whereas PLN with NPDV < 0.016 were defined as collapsed.
Diffusion coefficient and lymph speed measurement
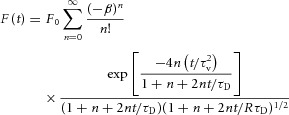
Diffusion coefficient and lymph speed measurements were performed as described previously (Bouta et al. 2011). Briefly, a tunable mode-locked Ti:Sapphire laser (Mai Tai; Spectra Physics, Mountain View, CA, USA), yielding 80-fs pulses at a repetition rate of 100 MHz was used to monitor the sample at a low power while keeping focal volume consistent throughout the experiment. Then, the sample was photobleached with a brief strong pulse of the laser, modulated through a KDP* Pockels’ cell (model No. 350–80; Conoptics, Danbury, CT, USA), to induce photobleaching. Timing of the bleach and monitor pulses was delivered by a pulse generator (model No. DG535, Stanford Research Systems, Sunnyvale, CA, USA), while the voltage output to the Pockels’ cell was controlled by a specially designed control box. Photons were collected by a photomultiplier tube (Hamamatsu, Bridgewater, NJ, USA) and recorded throughout the experiment by a photon counter (model No. SR400; Stanford Research Systems). After the bleach, the laser power returned to the lower monitor power as the fluorescence recovers to baseline. Multiple monitor-bleach-recovery curves, performed in rapid succession, are summed to produce the final curve, collected via LabVIEW (National Instruments, Austin, TX, USA). Recovery of the fluorescence is dependent on diffusion and convection. From the recovery curve after photobleaching, the diffusion coefficient and speed can be determined by fitting the recovery data in Matlab (MathWorks, Natick, MA, USA) to a model previously described (Brown et al. 1999; Sullivan et al. 2009):
 |
(1) |
where β is the bleach depth parameter, τv is a time constant due to flow, τD is a time constant due to diffusion and R is the square of the ratio of the axial to radial dimensions of the focal volume.
From this, the diffusion coefficient (D) can be determined by (Brown et al. 1999; Sullivan et al. 2009):
| (2) |
where wr is the radius of the focal volume. The speed (v) can be calculated by (Brown et al. 1999; Sullivan et al. 2009):
| (3) |
MP-FRAP is first calibrated by measuring the in vitro diffusion coefficient of FITC-BSA in water. The relative FITC-BSA diffusion coefficient values calculated in vitro (in water) versus in vivo (in lymph) were used to ratiometrically calculate the viscosity of lymph via the Stokes–Einstein equation. This ratiometric approach minimizes sources of experimental uncertainty in the final calculated lymph viscosity, compared to calculating viscosity from the Stokes–Einstein equation alone based on a software-fitted diffusion coefficient value for FITC-BSA in lymph, which in turn is dependent on lymph viscosity. The hind footpads of mice were injected with 30 μl of 1 mg ml−1 FITC-BSA in water (Sigma Aldrich, St Louis, MO, USA) 1 h before MP-FRAP measurements. Then, skin was removed and the desired location of MP-FRAP was confirmed by imaging the lymphatic vessel with two-photon microscopy. Only curves with a smooth recovery and sufficient bleaching (>10%) were used (Supplemental Fig. S1A). Bleach during the monitor phase was tested for by varying the monitor power and observing the photon counts (Supplemental Fig. S1B). Two-photon excitation scales as the square of the excitation intensity and the linear portion of the curve has a slope of 2.076 ± 0.084 (r2 = 0.970, P < 0.0001) on a log–log plot, indicating that there is no bleaching occurring in the linear portion of this representative curve and that these monitor powers can be used for MP-FRAP. Higher powers (to the right of the dashed line) fell from the power-squared relationship and are unsuitable for MP-FRAP. To confirm that there is no excitation saturation during the bleach phase, the bleach power is varied and the bleach depth parameter, or bleaching dose, is calculated (Supplemental Fig. S1C). The representative curve has a slope = 2.185 ± 0.323 (r2 = 0.793, P < 0.0001), demonstrating a power-squared dependence and indicating that all of the tested bleach powers are appropriate for MP-FRAP. To obtain the curves with the best bleach, the highest monitor and bleach power that showed no bleaching during the monitor or excitation saturation during the bleach were used. The following parameters were kept constant for all in vitro and in vivo MP-FRAP curves: bleach time of 0.02 ms, bin width of 1.28×10⁻³ ms, 5120 bins per record, 5000 curves per scan, trigger rate of 149.596 Hz. Therefore, each MP-FRAP curve took ∼28 s to collect. Previously, we have shown a lymphatic pulse rate of up to 2 times per minute (Li et al. 2013). Therefore, it is likely that we are averaging over 1 to 2 pulses per scan. This probable variation in the number of pulses per scan will increase the variability in the reported diffusion speed measurements but will not increase the likelihood of a false positive result across groups. Furthermore, each reported diffusion coefficient and speed is the average of five independent measurements within each animal.
Lymphatic pumping pressure measurement
Clinical methods to measure LPP (Unno et al. 2010) were adapted for use in mice with a custom vinyl cuff. For this non-invasive method, the hair was first removed with a depilatory cream and the mouse footpad was injected with 10 μl of 0.1 mg/ml ICG (Akorn, Lake Forest, IL, USA). Next, the transparent cuff was placed loosely on the lower leg (Fig. 1A). ICG was visible in the popliteal lymphatic vessels (PLV) prior to inflating the cuff (Fig. 1B). Then, the cuff was inflated to 60 cmH2O to occlude the PLV (Fig. 1C). The pressure was then slowly lowered until ICG was visible in the previously occluded PLV. At this point, the pressure within the PLV has overcome the pressure of the cuff and the LPP can be recorded. This was repeated five times for each animal (Supplemental Movie S1) and then averaged to give the final result. Pressure within the cuff was controlled with an Eagle Inflation Device (20cc, Bard Medical, Covington, GA, USA), measured with a pressure transducer (Sorenson Transpac IV, Abbott, North Chicago, IL, USA) and recorded with customized software (LabVIEW; National Instruments).
Figure 1.

TNF-Tg mice 4.5 months old were, anaesthetized, placed in the prone position on a heated platform, and a transparent cuff was placed loosely around their leg (dashed arrow, A). Then, ICG was injected into the footpad (arrowhead in B and C) and visualized within the PLV through the deflated transparent cuff (white arrow in B) which lead to the PLN (yellow arrow in B and C). Finally, the cuff was inflated to 60 cmH2O to occlude the PLV (white arrow in C), and the LPP was determined by slowly deflating the cuff until ICG was visible in the previously occluded PLV. Each LPP data point was derived from the mean of ≥3 repeated experiments. To check the within sample variability the LPP in the same leg was determined the next day (D). Note the significant correlation between the first and second measurement (slope = 0.9186 ± 0.1629, r2 = 0.841, P < 0.01).
Lymph node pressure measurement
Pressure measurements were performed as described previously (Bouta et al. 2011). Briefly, TNF-Tg mice and their WT littermates (ages 4–10 months) were injected with 30 μl of 1% Evan's Blue (Sigma Aldrich) in the hind footpad for initial visualization the PLN. After 20 minutes, the PLN was exposed via an incision through the overlying skin. An operating microscope (Op Mi6, Ziess, West Germany) and micromanipulator (Model M3301R, World Precision Instruments, Sarasota, FL, USA) were used to insert a luer lock borosilicate glass micropipette with an inner tip diameter of 30 μm (World Precision Instruments, Sarasota, FL, USA) into the PLN. The glass micropipette was attached to a pressure transducer (Sorenson Transpac IV, Abbott, North Chicago, IL, USA) and infusion pump (PHD 2000, Harvard Apparatus, Holliston, MA, USA) via polyvinyl chloride (PVC) tubing. Pressure recording was achieved using customized software (LabVIEW; National Instruments). Correct placement of the micropipette was evident when Evan's Blue could be visualized at the tip of the micropipette after insertion. The PLN pressure measurement was repeated five times in each PLN and averaged to give the final result. After each insertion into the PLN, an infusion pump was used to clear the pipette. LNP varied less than 10% between measurements. Calibration of the glass micropipette and pressure transducer was performed before each session manometrically.
Statistical analysis
All results are presented as the mean ± standard error. Data was first checked for normality and groups were checked to have equal variances by the Kolmogorov–Smirnov (K-S) test and F-test, respectively. Comparisons between groups were analysed by an ANOVA or Kruskal–Wallis ANOVA with Tukey's multiple comparison test or Dunn's post hoc test, depending on the normality and variances of the data. P values less than 0.05 were considered significant.
Results
In vivo MP-FRAP of lymphatic vessels afferent to WT, expanding and collapsed PLN was performed, and representative primary data of the recovery portion of the curves are presented in Fig. 2A–C. These data were used to calculate the diffusion coefficients (Fig. 2D) and lymph velocities (Fig. 2E) of the three groups (Table 1). No differences in lymph viscosity were calculated between the three groups, indicating that this physiological parameter does not change during arthritic progression. However, while lymph velocities were very similar in vessels afferent to WT and expanding PLN, we observed a significant 32.6% decrease in lymph speed afferent to collapsed PLN compared to that of vessels afferent to expanding PLN. This finding is consistent with intravital microscopy studies demonstrating a dramatic decrease in cellular velocity, and NIR-ICG imaging demonstrating decreased lymphatic clearance, in collapsed versus expanding lymphatic afferents to PLN in TNF-Tg mice (Li et al. 2013).
Figure 2.
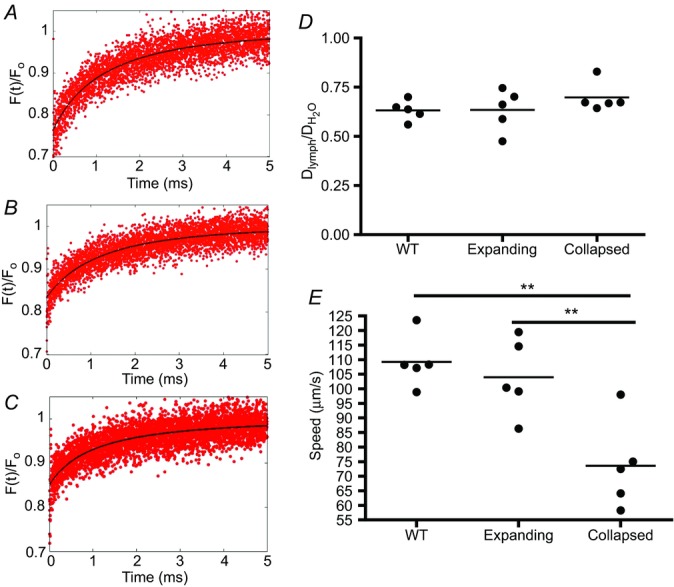
In vivo MP-FRAP was performed on lymphatic vessels afferent to WT, expanding and collapsed PLN in WT and TNF-Tg mice 3–11 months of age as described in Supplemental Fig. S1. The recovery portion fluorescence (F(t)) is shown normalized to the baseline fluorescence (F0) of representative MP-FRAP curves obtained by analysing lymphatic vessels afferent to WT (A), expanding (B) and collapsed (C) PLN. The model the MP-FRAP recovery portion is fitted to account for both diffusion and convection. The diffusion coefficient of FITC-BSA in lymph (Dlymph) is normalized to the diffusion coefficient of FITC-BSA in water ( ; D). Differences in viscosity can be inferred from the diffusion coefficient through the Stokes–Einstein equation, μ = (kbT)/(6πDr), where μ is the viscosity, kb is the Boltzmann constant, T is the temperature, D is the diffusion coefficient and r is the Stokes radius. Lymph speed calculated from the fit is shown (E, **P < 0.01 by Kruskal–Wallis ANOVA with a Dunn's post hoc test).
Table 1.
Summary of measured and calculated values
| WT | Expanding | Collapsed | |
|---|---|---|---|
 |
0.63 ± 0.02 | 0.63 ± 0.05 | 0.70 ± 0.03 |
| Viscosity (Pa s) | 1.81 ± 0.07 | 1.84 ± 0.16 | 1.61 ± 0.07 |
| Speed (μm s−1) | 109.21 ± 3.99 | 104.09 ± 5.71 | 73.61 ± 6.79**,## |
| LPP (cmH2O) | 11.04 ± 1.47 | 18.76 ± 2.34** | 2.61 ± 0.72**### |
| LNP (cmH2O) | 6.86 ± 0.56 | 3.41 ± 0.43* | 9.92 ± 1.79## |
Dlymph, diffusion coefficient of FITC-BSA in lymph;  , diffusion coefficient of FITC-BSA in water; LPP, lymphatic pumping pressure; LNP, lymph node pressure. Values are means ± standard error, n ≥ 4 for each group.
P < 0.05 vs. WT;
P < 0.01 vs. WT;
P < 0.01 vs. expanding;
P <0.001 vs. expanding.
To further substantiate the loss of lymphatic flow in lymphatic vessels afferent to collapsed PLN, we determined the LPP (Fig. 3) and the LNP (Fig. 4) of the three groups. Interestingly, we found that LPP significantly increased in vessels afferent to expanding PLN versus WT, which is consistent with the theory that these vessel are contracting more forcibly to compensate for the increase in cellular and fluid egress from inflamed joints following initiation of arthritis. Moreover, LPP plummeted over 7-fold after PLN collapse, which is consistent with the loss of the lymphatic pulse during arthritic flare (Li et al. 2013). The LNP results corroborated these findings, as we observed a significant decrease in expanding versus WT PLN (3.41 ± 0.43 vs. 6.86 ± 0.56 cmH2O; P < 0.001), which is consistent with the increased lymphangiogenesis during the expanding phase of arthritic progression (Guo et al. 2009; Li et al. 2011). We also found a significant increase to 9.92 ± 1.79 cmH2O in collapsed PLN (P < 0.001 vs. expanding), consistent with an increase in cell density due to the B-in cell blockage of lymph node sinuses, which plays a pivotal role in cell and fluid lymph node egress (Li et al. 2010, 2013).
Figure 3.
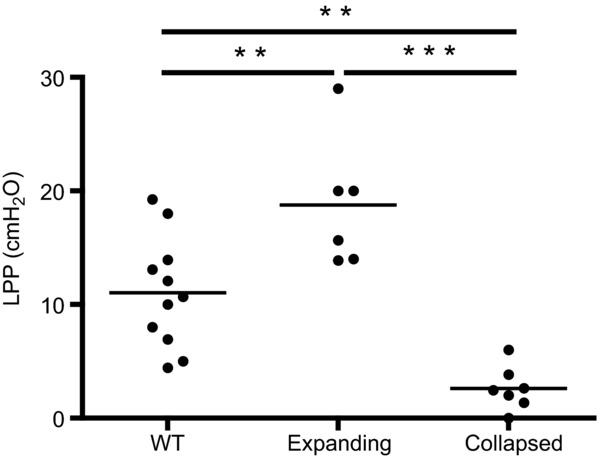
PLN in TNF-Tg mice were phenotyped as expanding or collapsed via CE-MRI, and then were assessed for LPP with their WT littermates (ages 4.5–10 months) as described in Fig. 1. The data were first tested for a Gaussian distribution by a K-S test, and then significance was tested for by a one-way ANOVA and Tukey's multiple comparison test (**P < 0.01, ***P < 0.001).
Figure 4.
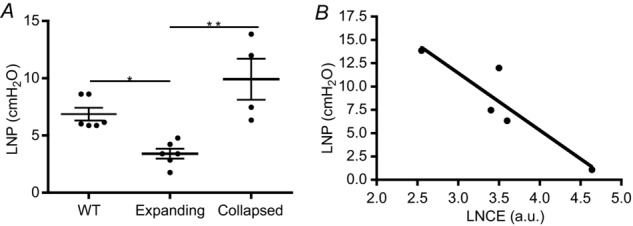
A, PLN in TNF-Tg mice were phenotyped as expanding or collapsed via CE-MRI, and their LNP was assessed along with their WT littermates (ages 4–10 months) as described in the Methods section (**P < 0.01, *P < 0.05 by Kruskal–Wallis ANOVA with a Dunn's post hoc test). B, a linear regression analysis was performed to demonstrate the significant correlation between LNP and LNCE (r2 = 0.83, P = 0.037).
Discussion
Over the last decade, the role of effector cells and cytokines in the initiation and perpetuation of chronic inflammation has emerged as the pre-eminent disease model in RA (Firestein, 2003). Indeed, the development of targeted biologic therapy, which has greatly improved clinical outcomes, can be directly linked to this model (Feldmann & Maini, 2008). Despite these advances, a sizeable fraction of RA patients do not respond to targeted therapies for reasons that are not well understood. This refractory RA population underscores the concept that critical pathways responsible for sustained inflammation have not been revealed. Recently, the contribution of lymphatic transport in chronic inflammation has garnered increasing attention across several fields (Cueni & Detmar, 2008; Chakraborty et al. 2010; Buckland, 2011; Aldrich & Sevick-Muraca, 2013). In particular, our studies in murine arthritis models confirm the importance of lymphatic dynamics in the evolution of disease flare (Guo et al. 2009; Li et al. 2010, 2011, 2013). However, to gain better insights into disease mechanisms, a more complete understanding of the characteristics of lymphatic fluid and flow is required. It is this thinking that has led to the recent emergence of lymphatic research, and efforts to identify novel biomarkers that can more accurately monitor disease remission and predict flare. To this end, we propose biomarkers of lymphatic drainage from diseased joints, which may provide insights for novel drug development, and present the first measurements of lymph viscosity, LNP and LPP in mice.
The first physiological parameter we studied in murine arthritis was lymph viscosity, which was based on its critical role involved in the modelling of lymphatic vessels (Reddy et al. 1977; Reddy & Patel, 1995; Venugopal et al. 2007), and its potential to increase with joint catabolism. Our rationale for MP-FRAP of FITC-BSA as the outcome measure of lymph viscosity was based on prior research (Brown et al. 1999; Sullivan et al. 2009). These authors used the recovery portion of the MP-FRAP curve to find the diffusion coefficient of FITC-BSA in the fluid of interest. Here we used the Stokes–Einstein equation to determine lymph viscosity by applying the 3.62 nm Stokes radius of FITC-BSA, which was previously determined by Ambati et al. (2000). With this method, we showed that the viscosity of lymph in WT mice is 0.0018 Pa s, or 1.8 times that of water. Note that published lymph viscosity measurements obtained in canine lymph were calculated to be 1.7 times that of water during absorption of fat (Burton-Optiz & Nemser, 1917), and that our finding is consistent with this study. However, we observed no Dlymph differences in lymphatic vessels afferent to WT, expanding and collapsed PLN (Fig. 2D), demonstrating that lymph viscosity is not a contributing factor to arthritic progression, nor a biomarker of arthritic flare. In contrast, the dramatic differences in lymph velocities (Fig. 2E) highlight the importance of lymphatic flow in the disease process. These findings corroborate published intravital microscopy studies that demonstrated a high velocity of CD11b+ monocyte/macrophages in lymphatic vessels afferent to expanding PLN of 186 μm s−1 (Li et al. 2013). Our results were markedly larger than lymph velocities measured in functional murine lymphatic capillaries of the tail, which averaged 4.2 μm s−1 via FRAP (Berk et al. 1996), demonstrating a large difference between the speed of initial versus collecting lymphatics. It also extends our understanding of lymphatic flow afferent to collapsed PLN, which could not be directly assessed via intravital microscopy, and documented the cellular velocity in these vessels to be 0 μm s−1 (Li et al. 2013).
To date, LNP has only been measured in sentinel LN of cancer patients (Nathanson & Mahan, 2011), where it was found to be 2.4-fold greater in tumour-laden LN compared to LN with no metastasis. Interestingly, these authors also determined the normal LNP in humans to be 12.1 ± 8.4 cmH2O (Nathanson & Mahan, 2011), which is roughly double our measurement of 6.7 ± 0.6 cmH2O in WT mice (Fig. 4). In support of its potential as a biomarker of joint inflammation, we found that LNP significantly decreased during PLN expansion, which is consistent with the known increase in lymphangiogenesis during this pre-arthritic phase (Guo et al. 2009; Li et al. 2010). However, we acknowledge that our assumption of B-in cell clogging of the LN sinuses (Li et al. 2010, 2011) as a causal event responsible for the dramatic increase in LNP observed in collapsed PLN is largely speculative, and represents a limitation of the present study that will require further investigation. Nevertheless, the strong correlation we observed between LNP and LNCE (Fig. 4), which is related to the degree of collapse and flow to this LN, formally demonstrates the translational potential of this biomarker for study with non-invasive imaging in RA.
While murine LPP has not been measured previously, it has been studied in healthy subjects and lymphoedema patients, where it was found to be 2.2-fold greater in the control group versus the patients (Unno et al. 2010). Other investigators have cannulated lymphatic vessels in rats and found the intraluminal pressure to be 7 ± 1 cmH2O (Scallan, 2010), which is similar to our murine WT value of 11.04 ± 1.468 cmH2O (Fig. 3). Moreover, in TNF-Tg mice we were able to demonstrate an initial increase in LPP, during PLN expansion when the afferent vessels must achieve greater lymphatic drainage capacity versus WT with a similar lymphatic contraction rate (1.4 pulses min−1 (Li et al. 2013)), and the subsequent decrease in LPP following PLN collapse and the loss of the lymphatic pulse (Li et al. 2013), suggesting that this is an important biomarker of disease pathogenesis.
Taken together with other pre-clinical and clinical studies of chronic inflammatory diseases that progress from normal physiology, to asymptomatic disease, to symptomatic hyperplasia and oedema, we propose a unifying model to explain the roles of LNP and LPP in establishing a lymphatic pressure gradient that mediates disease amelioration or exacerbation due to the direction of the lymphatic flow (Fig. 5). This theory posits that in normal tissue (i.e. joint synovium), lymphatic egress is achieved by a positive gradient towards the draining LN in which LPP exceeds LNP. However, at this stage, functional intraluminal lymphatic valves inhibit the fluid in the lymphatic vessels from ‘sensing’ the draining LNP. When stressed by inflammation in the afferent tissue, LPP increases as a compensatory mechanism to prevent oedema and synovitis. Concurrently, lymphangiogenesis in the draining LN occurs with a decrease in LNP to achieve a much greater pressure gradient that facilitates lymph and cellular egress from the inflamed tissue. At this point, dilatation of lymphatic vessels leads to non-functional lymphatic valves, a conclusion derived from previous studies where it was shown that cells move independently of the lymphatic pulse during the expanding phase (Li et al. 2013). However, after an extended period of chronic inflammation, a yet-to-be identified event triggers the loss of the lymphatic pulse, B-in cell translocation, and collapse of the draining LN (Li et al. 2010, 2011, 2013), which leads to a dramatic drop in LPP and increase in LNP. This loss of lymphatic pulse is associated with damage to the lymphatic vessel in our proposed model, leading to insufficient lymphatic function that produces a negative pressure gradient, which is further demonstrated by the decrease in lymphatic speed in vessels afferent to collapsed PLN (Fig. 2). This theory is also consistent with the standard clinical practice of injected dye studies to identify sentinel LN, and demonstrates that LNP can regulate lymphatic transport and possibly metastasis (Nathanson & Mahan, 2011).
Figure 5.
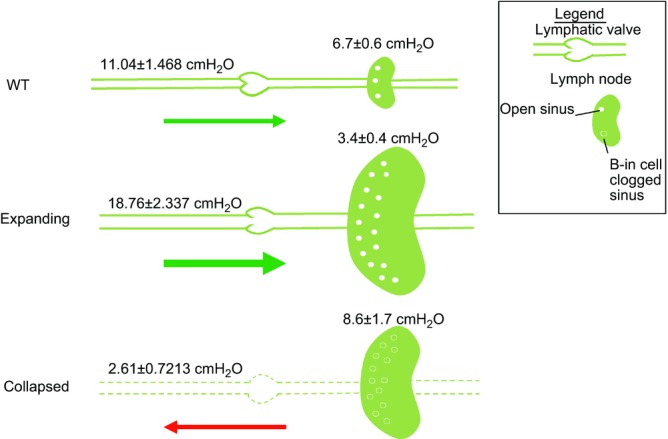
LPP (left) and LNP (right) are portrayed along with size and sinus changes in the PLN. In WT mice with no inflammation and TNF-Tg mice with expanding PLN, LNP is less than that of the LPP, which supports passive transport of cells and fluid from the afferent tissue (green arrows). At this point, the functional intraluminal valves prevent fluid communication between the lymphatic vessels and draining LN. During the expanding phase, vessels become dilated to the point where the valves are no longer functional. As the PLN collapses and B-in cells migrate into and clog the sinuses, the LNP becomes greater than that of the LPP. This establishes a retrograde gradient for passive lymphatic transport toward the inflamed tissue (red arrow), and would be expected to exacerbate oedema, synovitis and arthritic flare. Furthermore, vessels in the collapsed stage are damaged from prolonged inflammation, leading to leaky, less functional vessels. Thus, agents that can re-establish a positive gradient to support lymphatic egress from the joint to the draining LN are potential therapies for RA flare.
What is the clinical significance of the LPP and LNP biomarkers? Our work in this field has highlighted two distinct mechanisms of arthritic flare in mice and RA patients, which are likely to warrant different treatment strategies. Specifically, the initial synovitis in mice with inflammatory–erosive arthritis and early RA patients is largely associated with an increase in lymphatic transport from the affected joint (increased lymphatic pulse, increased LPP, decreased LNP from lymphangiogenesis in expanding PLN). Thus, this type of flare is probably caused by massive inflammation in the joint that overwhelms the lymphatics. For this condition Nonsteroidal anti-inflammatory drugs (NSAIDs) and more potent immunosuppressive Disease-modifying antirheumatic drugs (DMARDs) have proven effective in treating the flare by reducing the joint inflammation to levels that can be cleared by the lymphatics. However, as these treatments do not cure the underline aetiology, the chronic disease in these individuals can lead to joint flare caused by the loss of efferent lymphatic drainage of the joint (loss of the lymphatic pulse, decreased LPP, increased LNP in collapsed PLN), which is much harder to treat with anti-inflammatory medicines. Indeed we found that amelioration of knee flare in TNF-Tg mice with collapsed PLN following BCDT was due to restoration of lymphatic flow from the joint, and not due to alterations in B-cell activities. Thus, these novel biomarkers have potential to aid in the diagnosis of the type of joint flare, and may prove useful for the development of novel therapies that specifically target the efferent lymphatics of arthritic joints.
While the data on lymph speed, LPP and LNP presented here provide new information on collecting lymphatics and lymph nodes during chronic inflammation, much work still needs to be done to elucidate the molecular and cellular mechanism responsible for these changes. Most current hypotheses concerning the decrease in lymphatic contraction during inflammation are centred on nitric oxide (NO–) as a dominant regulator (Kajiya et al. 2008; Liao et al. 2011; Schmid-Schonbein, 2012; Aldrich & Sevick-Muraca, 2013; Mathias & von der Weid, 2013), and it is tantalizing to speculate on the interactions between NO– produced by adherent inflammatory cells within lymphatic vessels (Li et al. 2013) and the NO– produced by lymphatic endothelial cells, which could lead to decreased lymphatic contraction and loss of LPP. It is also unclear if the increased LNP could be driving this process in vivo by decreasing passive lymphatic transport, and therefore contributing to the slow speed of these inflammatory cells that continuously release NO–. As such, future studies aimed at answering these questions will be needed to advance the field and further validate lymphatics as diagnostic biomarkers and potential drug targets in RA and other chronic inflammatory diseases.
Key points
Previously, it was found that the popliteal lymph node (PLN) enlarges during the pre-arthritic ‘expanding’ phase, and then ‘collapses’ with adjacent knee flare and is associated with the loss of the intrinsic lymphatic pulse.
However, the mechanisms responsible are unknown and we therefore developed in vivo methods to measure lymph viscosity, lymphatic pumping pressure (LPP) in the lymphatic vessels afferent to the PLN, and lymph node pressure (LNP).
Multiphoton fluorescence recovery after photobleaching (MP-FRAP) was used to calculate lymph viscosity and speed; no difference was found among mice with wild-type (WT), expanding or collapsed PLN in lymph viscosity, but lymph speed was found to be decreased in mice with collapsed PLN compared to WT and expanding PLN mice.
LPP was measured indirectly by slowly releasing a pressurized cuff occluding ICG fluorescent dye; we found that mice with expanding PLN exhibit a higher LPP compared to WT and mice with collapsed PLN show an extremely low LPP.
Direct measurement of LNP demonstrated a decrease in expanding PLN versus WT pressure, which dramatically increased in collapsed PLN.
The decrease in lymphatic flow and loss of LPP during PLN collapse are consistent with decreased drainage from the joint during arthritic flare, and validate these biomarkers of rheumatoid arthritis progression and possibly other chronic inflammatory conditions
Acknowledgments
We thank Patricia Weber for technical assistance with the MRI.
Glossary
- B-in
B cells in inflamed nodes
- CE-MRI
contrast enhanced magnetic resonance imaging
- FITC-BSA
fluorescein isothiocyanate labelled bovine serum albumin
- Gd-DTPA
gadolinium-diethylenetriamine pentaacetic acid
- LNCE
lymph node contrast enhancement
- LNP
lymph node pressure
- LPP
lymphatic pumping pressure
- MP-FRAP
multiphoton fluorescence recovery after photobleaching
- NIR-ICG
near infrared-indocyanine green
- NO–
nitric oxide
- PD-US
power Doppler ultrasound
- PLN
popliteal lymph node
- RA
rheumatoid arthritis
- TNF-Tg
tumour necrosis factor alpha transgenic
- VEGF-C
vascular endothelial growth factor c
- WT
wild-type
Additional information
Competing interests
Dr Ronald Wood is an inventor of near infrared imaging methods for sentinel lymph nodes, some of which the University of Rochester licensed or sold to Novadaq Technologies, Inc.
Author contributions
E.M.B. designed and performed the experiments and collected and analysed the data. R.W.W., E.B.B. and E.M.S. helped design the experiments. E.M.B, R.W.W., E.B.B., H.R., C.T.R. and E.M.S. contributed to interpretation of the data and revising the draft for important intellectual content. All authors read and approved the final version of the manuscript.
Funding
This work was supported by research grants from the National Institutes of Health PHS awards (T32 AR053459; R01s AR048697, AR053586 and AR056702; P01 AI078907; DP2OD006501; P30 AR061307 and 1DP2OD006501-10).
References
- Aldrich MB, Sevick-Muraca EM. Cytokines are systemic effectors of lymphatic function in acute inflammation. Cytokine. 2013;64:362–369. doi: 10.1016/j.cyto.2013.05.015. [DOI] [PMC free article] [PubMed] [Google Scholar]
- Ambati J, Canakis CS, Miller JW, Gragoudas ES, Edwards A, Weissgold DJ, Kim I, Delori FC, Adamis AP. Diffusion of high molecular weight compounds through sclera. Invest Ophthalmol Vs Sci. 2000;41:1181–1185. [PubMed] [Google Scholar]
- Balazs EA, Watson D, Duff IF, Roseman S. Hyaluronic acid in synovial fluid. I. Molecular parameters of hyaluronic acid in normal and arthritis human fluids. Arthritis Rheum. 1967;10:357–376. doi: 10.1002/art.1780100407. [DOI] [PubMed] [Google Scholar]
- Berk DA, Swartz MA, Leu AJ, Jain RK. Transport in lymphatic capillaries. II. Microscopic velocity measurement with fluorescence photobleaching. Am J Physiol Heart Circ Physiol. 1996;270:H330–H337. doi: 10.1152/ajpheart.1996.270.1.H330. [DOI] [PubMed] [Google Scholar]
- Bouta EM, Ju Y, Rahimi H, de Mesy-Bentley KL, Wood RW, Xing L, Schwarz EM. Power Doppler ultrasound phenotyping of expanding versus collapsed popliteal lymph nodes in murine inflammatory arthritis. PLoS One. 2013;8:e73766. doi: 10.1371/journal.pone.0073766. [DOI] [PMC free article] [PubMed] [Google Scholar]
- Bouta EM, Wood RW, Perry SW, Brown EB, Ritchlin CT, Xing L, Schwarz EM. Measuring intranodal pressure and lymph viscosity to elucidate mechanisms of arthritic flare and therapeutic outcomes. Ann N Y Acad Sci. 2011;1240:47–52. doi: 10.1111/j.1749-6632.2011.06237.x. [DOI] [PMC free article] [PubMed] [Google Scholar]
- Brown EB, Wu S, Zipfel W, Webb WW. Measurement of molecular diffusion in solution by multiphoton fluorescence photobleaching recovery. Biophys J. 1999;77:2837–2849. doi: 10.1016/S0006-3495(99)77115-8. [DOI] [PMC free article] [PubMed] [Google Scholar]
- Buckland J. Experimental arthritis: Targeting joint lymphatic function. Nat Rev Rheumatol. 2011;7:376. doi: 10.1038/nrrheum.2011.74. [DOI] [PubMed] [Google Scholar]
- Burton-Optiz R, Nemser R. The viscosity of lymph. Am J Physiol. 1917;45:25–29. [Google Scholar]
- Chakraborty S, Zawieja S, Wang W, Zawieja DC, Muthuchamy M. Lymphatic system: a vital link between metabolic syndrome and inflammation. Ann N Y Acad Sci. 2010;1207(Suppl. 1):E94–E102. doi: 10.1111/j.1749-6632.2010.05752.x. [DOI] [PMC free article] [PubMed] [Google Scholar]
- Coull BM, Beamer N, de Garmo P, Sexton G, Nordt F, Knox R, Seaman GV. Chronic blood hyperviscosity in subjects with acute stroke, transient ischemic attack, and risk factors for stroke. Stroke. 1991;22:162–168. doi: 10.1161/01.str.22.2.162. [DOI] [PubMed] [Google Scholar]
- Cueni LN, Detmar M. The lymphatic system in health and disease. Lymphat Res Biol. 2008;6:109–122. doi: 10.1089/lrb.2008.1008. [DOI] [PMC free article] [PubMed] [Google Scholar]
- Davis MJ, Scallan JP, Wolpers JH, Muthuchamy M, Gashev AA, Zawieja DC. Intrinsic increase in lymphangion muscle contractility in response to elevated afterload. Am J Phsiol Heart Circ Physiol. 2012;303:H795–H808. doi: 10.1152/ajpheart.01097.2011. [DOI] [PMC free article] [PubMed] [Google Scholar]
- Feldmann M, Maini SR. Role of cytokines in rheumatoid arthritis: an education in pathophysiology and therapeutics. Immunol Rev. 2008;223:7–19. doi: 10.1111/j.1600-065X.2008.00626.x. [DOI] [PubMed] [Google Scholar]
- Firestein GS( Evolving concepts of rheumatoid arthritis. Nature. 2003;423:356–361. doi: 10.1038/nature01661. [DOI] [PubMed] [Google Scholar]
- Guo R, Zhou Q, Proulx ST, Wood R, Ji RC, Ritchlin CT, Pytowski B, Zhu Z, Wang YJ, Schwarz EM, Xing L. Inhibition of lymphangiogenesis and lymphatic drainage via vascular endothelial growth factor receptor 3 blockade increases the severity of inflammation in a mouse model of chronic inflammatory arthritis. Arthritis Rheum. 2009;60:2666–2676. doi: 10.1002/art.24764. [DOI] [PMC free article] [PubMed] [Google Scholar]
- Hargens AR, Zweifach BW. Contractile stimuli in collecting lymph vessels. Am J Physiol Heart Circ Physiol. 1977;233:H57–H65. doi: 10.1152/ajpheart.1977.233.1.H57. [DOI] [PubMed] [Google Scholar]
- Kajiya K, Huggenberger R, Drinnenberg I, Ma B, Detmar M. Nitric oxide mediates lymphatic vessel activation via soluble guanylate cyclase alpha1beta1-impact on inflammation. FASEB J. 2008;22:530–537. doi: 10.1096/fj.07-8873com. [DOI] [PubMed] [Google Scholar]
- Keffer J, Probert L, Cazlaris H, Georgopoulos S, Kaslaris E, Kioussis D, Kollias G. Transgenic mice expressing human tumour necrosis factor: a predictive genetic model of arthritis. EMBO J. 1991;10:4025–4031. doi: 10.1002/j.1460-2075.1991.tb04978.x. [DOI] [PMC free article] [PubMed] [Google Scholar]
- Kwon S, Sevick-Muraca EM. Noninvasive quantitative imaging of lymph function in mice. Lymphat Res Biol. 2007;5:219–231. doi: 10.1089/lrb.2007.1013. [DOI] [PubMed] [Google Scholar]
- Li J, Ju Y, Bouta EM, Xing L, Wood RW, Kuzin I, Bottaro A, Ritchlin CT, Schwarz EM. Efficacy of B cell depletion therapy for murine joint arthritis flare is associated with increased lymphatic flow. Arthritis Rheum. 2013;65:130–138. doi: 10.1002/art.37709. [DOI] [PMC free article] [PubMed] [Google Scholar]
- Li J, Kuzin I, Moshkani S, Proulx ST, Xing L, Skrombolas D, Dunn R, Sanz I, Schwarz EM, Bottaro A. Expanded CD23+/CD21hi B cells in inflamed lymph nodes are associated with the onset of inflammatory-erosive arthritis in TNF-transgenic mice and are targets of anti-CD20 therapy. J Immunol. 2010;184:6142–6150. doi: 10.4049/jimmunol.0903489. [DOI] [PMC free article] [PubMed] [Google Scholar]
- Li J, Zhou Q, Wood R, Kuzin I, Bottaro A, Ritchlin C, Xing L, Schwarz E. CD23+/CD21hi B cell translocation and ipsilateral lymph node collapse is associated with asymmetric arthritic flare in TNF-Tg mice. Arthritis Res Ther. 2011;13:R138. doi: 10.1186/ar3452. [DOI] [PMC free article] [PubMed] [Google Scholar]
- Liao S, Cheng G, Conner DA, Huang Y, Kucherlapati RS, Munn LL, Ruddle NH, Jain RK, Fukumura D, Padera TP. Impaired lymphatic contraction associated with immunosuppression. Proc Natl Acad Sci U S A. 2011;108:18784–18789. doi: 10.1073/pnas.1116152108. [DOI] [PMC free article] [PubMed] [Google Scholar]
- McHale NG, Roddie IC. The effect of transmural pressure on pumping activity in isolated bovine lymphatic vessels. J Physiol. 1976;261:255–269. doi: 10.1113/jphysiol.1976.sp011557. [DOI] [PMC free article] [PubMed] [Google Scholar]
- Manzo A, Caporali R, Vitolo B, Alessi S, Benaglio F, Todoerti M, Bugatti S, Calliada F, Montecucco C. Subclinical remodelling of draining lymph node structure in early and established rheumatoid arthritis assessed by power Doppler ultrasonography. Rheumatology (Oxford) 2011;50:1395–1400. doi: 10.1093/rheumatology/ker076. [DOI] [PubMed] [Google Scholar]
- Mathias R, von der Weid PY. Involvement of the NO-cGMP-KATP channel pathway in the mesenteric lymphatic pump dysfunction observed in the guinea pig model of TNBS-induced ileitis. Am J Physiol Gastrointest Liver Physiol. 2013;304:G623–G634. doi: 10.1152/ajpgi.00392.2012. [DOI] [PubMed] [Google Scholar]
- Mehta J, Singhal S. Hyperviscosity in plasma cell dyscrasias. Semin Thromb Hemost. 2003;29:467–471. doi: 10.1055/s-2003-44554. [DOI] [PubMed] [Google Scholar]
- Nathanson SD, Mahan M. Sentinel lymph node pressure in breast cancer. Ann Surg Oncol. 2011;18:3791–3796. doi: 10.1245/s10434-011-1796-y. [DOI] [PubMed] [Google Scholar]
- Proulx ST, Kwok E, You Z, Beck CA, Shealy DJ, Ritchlin CT, Boyce BF, Xing L, Schwarz EM. MRI and quantification of draining lymph node function in inflammatory arthritis. Ann N Y Acad Sci. 2007;1117:106–123. doi: 10.1196/annals.1402.016. [DOI] [PubMed] [Google Scholar]
- Proulx ST, Kwok E, You Z, Papuga MO, Beck CA, Shealy DJ, Calvi LM, Ritchlin CT, Awad HA, Boyce BF, Xing L, Schwarz EM. Elucidating bone marrow edema and myelopoiesis in murine arthritis using contrast-enhanced magnetic resonance imaging. Arthritis Rheum. 2008;58:2019–2029. doi: 10.1002/art.23546. [DOI] [PMC free article] [PubMed] [Google Scholar]
- Proulx ST, Kwok E, You Z, Papuga MO, Beck CA, Shealy DJ, Ritchlin CT, Awad HA, Boyce BF, Xing L, Schwarz EM. Longitudinal assessment of synovial, lymph node, and bone volumes in inflammatory arthritis in mice by in vivo magnetic resonance imaging and microfocal computed tomography. Arthritis Rheum. 2007b;56:4024–4037. doi: 10.1002/art.23128. [DOI] [PMC free article] [PubMed] [Google Scholar]
- Proulx ST, Luciani P, Derzsi S, Rinderknecht M, Mumprecht V, Leroux JC, Detmar M. Quantitative imaging of lymphatic function with liposomal indocyanine green. Cancer Res. 2010;70:7053–7062. doi: 10.1158/0008-5472.CAN-10-0271. [DOI] [PMC free article] [PubMed] [Google Scholar]
- Rasmussen JC, Tan IC, Marshall MV, Adams KE, Kwon S, Fife CE, Maus EA, Smith LA, Covington KR, Sevick-Muraca EM. Human lymphatic architecture and dynamic transport imaged using near-infrared fluorescence. Transl Oncol. 2010;3:362–372. doi: 10.1593/tlo.10190. [DOI] [PMC free article] [PubMed] [Google Scholar]
- Reddy NP, Krouskop TA, Newell PH., Jr A computer model of the lymphatic system. Comput Biol Med. 1977;7:181–197. doi: 10.1016/0010-4825(77)90023-3. [DOI] [PubMed] [Google Scholar]
- Reddy NP, Patel K. A mathematical model of flow through the terminal lymphatics. Med Eng Phys. 1995;17:134–140. doi: 10.1016/1350-4533(95)91885-k. [DOI] [PubMed] [Google Scholar]
- Reimann I. Pathological human synovial fluids. Viscosity and boundary lubricating properties. Clin Orthop Relat Res. 1976;119 [PubMed] [Google Scholar]
- Scallan JP, Huxley VH. In vivo determination of collecting lymphatic vessel permeability to albumin: a role for lymphatics in exchange. J Physiol. 2010;588:245–254. doi: 10.1113/jphysiol.2009.179622. [DOI] [PMC free article] [PubMed] [Google Scholar]
- Scallan JP, Wolpers JH, Muthuchamy M, Zawieja DC, Gashev AA, Davis MJ. Independent and interactive effects of preload and afterload on the pump function of the isolated lymphangion. Am J Physiol Heart Circ Physiol. 2012;303:H809–H824. doi: 10.1152/ajpheart.01098.2011. [DOI] [PMC free article] [PubMed] [Google Scholar]
- Schmid-Schonbein GW. Nitric oxide (NO) side of lymphatic flow and immune surveillance. Proc Natl Acad Sci U S A. 2012;109:3–4. doi: 10.1073/pnas.1117710109. [DOI] [PMC free article] [PubMed] [Google Scholar]
- Sullivan KD, Sipprell WH, 3rd, Brown EB, Jr, Brown EB., 3rd Improved model of fluorescence recovery expands the application of multiphoton fluorescence recovery after photobleaching in vivo. Biophys J. 2009;96:5082–5094. doi: 10.1016/j.bpj.2009.04.020. [DOI] [PMC free article] [PubMed] [Google Scholar]
- Swann DA, Radin EL, Nazimiec M, Weisser PA, Curran N, Lewinnek G. Role of hyaluronic acid in joint lubrication. Ann Rheum Dis. 1974;33:318–326. doi: 10.1136/ard.33.4.318. [DOI] [PMC free article] [PubMed] [Google Scholar]
- Unno N, Nishiyama M, Suzuki M, Tanaka H, Yamamoto N, Sagara D, Mano Y, Konno H. A novel method of measuring human lymphatic pumping using indocyanine green fluorescence lymphography. J Vasc Surg. 2010;52:946–952. doi: 10.1016/j.jvs.2010.04.067. [DOI] [PubMed] [Google Scholar]
- Venugopal AM, Stewart RH, Laine GA, Dongaonkar RM, Quick CM. Lymphangion coordination minimally affects mean flow in lymphatic vessels. Am J Physiol Heart Circ Physiol. 2007;293:H1183–H1189. doi: 10.1152/ajpheart.01340.2006. [DOI] [PubMed] [Google Scholar]
- Zhang J, Zhou SK, Xiang X, Bautista ML, Niccum BA, Dickinson GS, Tan IC, Chan W, Sevick-Muraca EM, Rasmussen JC. Automated analysis of investigational near-infrared fluorescence lymphatic imaging in humans. Biomed Opt Express. 2012;3:1713–1723. doi: 10.1364/BOE.3.001713. [DOI] [PMC free article] [PubMed] [Google Scholar]
- Zhang Q, Lu Y, Proulx S, Guo R, Yao Z, Schwarz EM, Boyce BF, Xing L. Increased lymphangiogenesis in joints of mice with inflammatory arthritis. Arthritis Res Ther. 2007;9:R118. doi: 10.1186/ar2326. [DOI] [PMC free article] [PubMed] [Google Scholar]
- Zhou Q, Guo R, Wood R, Boyce BF, Liang Q, Wang YJ, Schwarz EM, Xing L. Vascular endothelial growth factor C attenuates joint damage in chronic inflammatory arthritis by accelerating local lymphatic drainage in mice. Arthritis Rheum. 2011;63:2318–2328. doi: 10.1002/art.30421. [DOI] [PMC free article] [PubMed] [Google Scholar]
Associated Data
This section collects any data citations, data availability statements, or supplementary materials included in this article.