

Abstract
Myostatin, a member of the transforming growth factor β family, is a potent negative regulator of skeletal muscle growth, as myostatin-deficient mice show a great increase in muscle mass. Yet the physical performance of these animals is reduced. As an explanation for this, alterations in the steps in excitation–contraction coupling were hypothesized and tested for in mice with the 12 bp deletion in the propeptide region of the myostatin precursor (MstnCmpt-dl1Abc or Cmpt). In voluntary wheel running, control C57BL/6 mice performed better than the mutant animals in both maximal speed and total distance covered. Despite the previously described lower specific force of Cmpt animals, the pCa–force relationship, determined on chemically permeabilized fibre segments, did not show any significant difference between the two mouse strains. While resting intracellular Ca2+ concentration ([Ca2+]i) measured on single intact flexor digitorum brevis (FDB) muscle fibres using Fura-2 AM was similar to control (72.0 ± 1.7 vs. 78.1 ± 2.9 nm, n = 38 and 45), the amplitude of KCl-evoked calcium transients was smaller (360 ± 49 vs. 222 ± 45 nm, n = 22) in the mutant strain. Similar results were obtained using tetanic stimulation and Rhod-2 AM, which gave calcium transients that were smaller (2.42 ± 0.11 vs. 2.06 ± 0.10 ΔF/F0, n = 14 and 13, respectively) on Cmpt mice. Sarcoplasmic reticulum (SR) calcium release flux calculated from these transients showed a reduced peak (23.7 ± 3.0 vs. 15.8 ± 2.1 mMs−1) and steady level (5.7 ± 0.7 vs. 3.7 ± 0.5 mm s−1) with no change in the peak-to-steady ratio. The amplitude and spatial spread of calcium release events detected on permeabilized FDB fibres were also significantly smaller in mutant mice. These results suggest that reduced SR calcium release underlies the reduced muscle force in Cmpt animals.
Introduction
Myostatin – originally named growth and differentiation factor-8 (GDF-8) – a member of the transforming growth factor β (TGF-β) superfamily, has emerged as a potent negative regulator of skeletal muscle growth (McPherron et al. 1997). It plays a key role in skeletal muscle homeostasis and has been well described since its discovery. During embryogenesis, myostatin is exclusively expressed in skeletal muscle to control the differentiation and proliferation of myoblasts (Langley et al. 2002). It mediates the cell signalling cascade through activin receptors in the muscle, which interfere with the activity and expression of myoblast determination protein (MyoD; Langley et al. 2002). Recently, myostatin has also been shown to inhibit Akt, a kinase that regulates muscle growth (Bodine et al. 2001; Lai et al. 2004), in part through the activation of protein synthesis (e.g. Elkina et al. 2011).
Myostatin was first identified when null-mutant knock-out mice exhibited a huge increase in skeletal muscle mass due to hypertrophy and hyperplasia (McPherron et al. 1997). Mutations causing hypermuscularity in the double-muscled Belgian Blue and Piedmontese cattle breeds were described in the myostatin gene (Kambadur et al. 1997). Similarly, whippet dogs with excessive muscle growth were found to have a heterozygous naturally occurring mutation (Mosher et al. 2007).
Hypermuscular mice were also found by several groups in selection studies examining the genetic basis of protein accretion (Varga et al. 1997; Bünger et al. 2001). These include the so-called ‘Compact’ mice (Varga et al. 1997), in which sequencing of the myostatin gene revealed a 12 bp deletion – and thus the name MstnCmpt-dl1Abc (Szabo et al. 1998) – in the propeptide region of the myostatin precursor. In homozygous Cmpt/Cmpt mutants, mature myostatin is active (Szabó et al. 1998), enabling genes modifying the expression of myostatin or modulating downstream signalling to have a significant influence on the hypermuscular phenotype (Varga et al. 2003).
Amthor et al. (2007) showed that despite the larger muscle mass relative to age-matched wild-types, there was no increase in maximal tetanic force generation, but rather that when expressed as a function of muscle size (specific force) extensor digitorum longus (EDL) muscles of myostatin knock-out (Mstn−/−) and Cmpt mice were weaker than wild-type muscles. In addition, muscles from Mstn−/− animals had a marked increase in the number of type IIb fibres as compared to wild-type controls. They suggested that with myostatin deficiency, decreased force production is accompanied by a loss of oxidative characteristics of skeletal muscle.
On the other hand, while alterations in fibre type and oxidative characteristics of the muscles in Cmpt mice could explain a reduction in overall endurance, they fail to explain why specific force is decreased in these animals. Therefore, modifications in one or more of the events leading to shortening – i.e. in excitation–contraction coupling (ECC) – could be the underlying reason for the alterations in muscle force of Cmpt mice. Nevertheless, the steps in ECC have not yet been investigated in these animals.
In skeletal muscle ECC begins when depolarization of the transverse (T-)tubular membrane initiates the release of calcium from its intracellular store, the sarcoplasmic reticulum (SR), via specialized Ca2+ release channels known as ryanodine receptors (RyR; e.g. Franzini & Protasi, 1997). RyR activation is achieved by the depolarization-evoked conformational change of the dihydropyridine receptors (DHPRs) localized in the T-tubular membrane (e.g. Rios & Pizarro, 1991; Lamb, 2002). Calcium ions then bind to the regulatory sites on troponin-C to initiate a conformational change, which in turn enables the binding of myosin to actin and, ultimately, results in muscle contraction.
To understand the apparent discrepancy between increased muscle mass and reduced specific force reported in the literature for Cmpt mice, we hypothesized that ECC is also modified in these animals. To this end, we give an in-depth investigation of muscle function by comparing the physical endurance of control and Cmpt mutant mice as well as changes of ECC. For the latter, intracellular calcium concentration measurements were conducted using electrical stimulation or prolonged depolarization of enzymatically isolated fibres loaded with fluorescent calcium indicators while the contractile activation was studied on chemically skinned fibre segments. We demonstrate that reduced SR Ca2+ release underlies the suppression of specific force. Part of this work was presented to the European Muscle Society (Jenes et al. 2012).
Methods
Animal care
Animal experiments conformed to the guidelines of the European Community (86/609/EEC). The experimental protocol was approved by the institutional Animal Care Committee of the University of Debrecen (22/2011/DE MAB). The mice were housed in plastic cages with mesh covers, and fed with pelleted mouse chow and water ad libitum. Room illumination was an automated cycle of 12 h light and 12 h dark, and room temperature was maintained within the range 22–25°C. When necessary mice were killed by cervical dislocation.
Mating and genotyping of Cmpt mice
The Cmpt mice (see Supplementary Fig. S1A top, S1B) originated from G.M.'s lab (Varga et al. 2003). To monitor the Cmpt mutation, heterozygous mice were obtained by mating wild-type C57BL/6 (Mstn+/+; control; Fig. S1A bottom, S1C) and Cmpt mice. Tail-tip biopsy was performed for genotyping (see Fig. S2).
In vivo experiments
Voluntary activity wheel measurement
Twelve-to 16-week-old Cmpt (n = 8) and C57BL/6 (n = 8) mice were singly housed in a cage with a mouse running wheel (Campden Instruments Ltd, Loughborough, UK). Wheels were interfaced to a computer and revolutions were recorded at 20 min intervals, continuously for 14 days. The average and maximal speed, and the distance and duration of running were calculated for individual mice and then averaged by strains.
Forepaw grip test
Twelve-to 16-week-old Cmpt (n = 5) and C57BL/6 (n = 11) mice were held perpendicular to the bar connected to a capacitive force transducer, so that they did not reach at an angle during the trials. The hind limbs were not allowed to touch any surfaces. When the unrestrained forepaw was brought into contact with the bar of the grip test meter, the animals reliably grasped the bar, and the animal was then gently pulled away from the device. The grip test meter then measured the maximal force before the animal released the bar. We allowed the mouse to grip the bar fully. Force responses were digitized at 2 kHz and stored via an online connected computer.
In vitro experiments
Isolation of single skeletal muscle fibres
Experiments were carried out on skeletal muscle fibres from the flexor digitorum brevis (FDB), EDL and soleus muscles of the mice. Single muscle fibres were enzymatically dissociated in calcium-free modified Tyrode's solution (in mm: 137 NaCl, 5.4 KCl, 0.5 MgCl2, 11.8 Hepes, pH 7.4) containing 0.2% Type I collagenase (Sigma, St Louis, MO, USA) at 37°C for 50–55 min (Csernoch et al. 2008).
To release single fibres muscles were triturated gently in modified Tyrode's solution supplemented with 1.8 mm CaCl2. The fibres were then mounted on laminin-coated cover slip floors of culture dishes and kept at 4°C until use.
Resting membrane potential measurement
FDB muscle fibres were superfused with oxygenized Tyrode's solution (in mm: 137 NaCl, 5.4 KCl, 0.5 MgCl2, 1.8 CaCl2, 11.8 Hepes-NaOH, 1 g l−1 glucose, pH 7.4) at room temperature (22°C). Only cells with an intact surface membrane and clear cross striations were used. Membrane potentials were recorded using 3 m KCl filled sharp glass microelectrodes having tip resistances between 30 and 40 MΩ. The electrodes were connected to the input of a Multiclamp-700A amplifier (Axon Instruments, Foster City, CA, USA) under current clamp conditions. Membrane potentials were digitized at 100 kHz using a Digidata 1322 A/D card (Axon Instruments) under software control (pClamp 9.2, Axon Instruments, Foster City, CA, USA) and stored for later analysis.
Ca2+ sensitivity of the contractile proteins
Ca2+-dependent active isometric force and its Ca2+ sensitivity, and Ca2+-independent passive force of permeabilized EDL and soleus muscle fibres were determined by a mechanical measuring system at 15°C as previously described (Papp et al. 2002; for additional details see Supplementary Material). Briefly, Ca2+ contractures were evoked by transferring the fibres from Ca2+-free relaxing solution (in mm: 37.34 KCl, 10 BES, 6.24 MgCl2, 7 EGTA, 6.99 Na2ATP and 15 sodium creatinin-phosphate, pH 7.2) to activating solutions (relaxing solution supplemented with Ca) of gradually increasing [Ca2+]. During single Ca2+ contractures, when the force reached the maximal value, a quick release–re-stretch manoeuvre was performed in the activating solution. As a result of this intervention, the force dropped from peak level to zero, allowing determination of the total force level (Ftotal), and then started to redevelop. Force redevelopment was fitted to a single exponential function to estimate the rate constant of force redevelopment (ktr). The fibre was then returned to the relaxing solution, where a shortening to 80% of the original preparation length was performed to assess the passive force level (Fpassive). The active isometric force (Factive) was calculated by subtracting Fpassive from Ftotal. Factive and Fpassive were normalized for the fibre cross-sectional area calculated from the width and height of the fibres. Isometric force values were normalized for the maximal Ca2+-activated active force, and Ca2+–force relationships were plotted to determine the Ca2+ sensitivity of isometric force production.
The relationship between force and pCa was fitted with a modified Hill equation:
| (1) |
where FCa is the steady-state force, Fmax is the steady isometric force at saturating Ca2+ concentration (pCa = 4.75), the Hill coefficient (nH) is a measure of the steepness of the relationship, pCa50 is the midpoint of the relationship and Fmin is defined as the isometric force recorded at pCa = 9.
Whole-cell intracellular Ca2+ concentration measurement
Changes in intracellular Ca2+ concentration ([Ca2+]i) were monitored using Fura-2 as described previously (Fodor et al. 2008; for additional details see Supplementary Material). Briefly, isolated FDB fibres were mounted on laminin-coated cover slips and loaded with 5 μm Fura-2 AM for 60 min. Ca2+ transients were evoked by KCl depolarization. [Ca2+]i was calculated from the ratio of measured fluorescence intensities (F340/F380) using an in vivo calibration as described in our earlier report (Fodor et al. 2008).
Detection of the changes in [Ca2+]i using confocal microscopy
Individual action potentials were evoked by applying supra-threshold 2 ms square pulses (S88 Stimulator, Grass Technologies, Warwick, RI, USA) through a pair of platinum electrodes placed close to the fibre. Tetanic depolarizations were initiated using trains of supra-threshold 2 ms square pulses with a frequency of 100 Hz within the train. Each train lasted for 500 ms. Depolarization-evoked calcium transients were measured at 22°C using a confocal laser scanning microscope system (Zeiss 5 Live, Oberkochen, Germany) after loading the fibres with 20 μm Rhod-2 AM for 15 min at room temperature. Line-scan images (512 pixels per line) were used to monitor the fluorescence intensity changes at 1 ms per line and using a 40× water immersion objective. Rhod-2 was excited with a helium–neon ion laser at 543 nm, and emission was detected with a 550 nm long pass filter. To obtain the time course of Rhod-2 fluorescence change (Frhod), corresponding data points (usually 10–15) in the line-scan images were averaged in the spatial domain. Resting fluorescence was determined as the average fluorescence before the depolarization. Changes in [Ca2+]i were then calculated using the formula
| (2) |
where Frhod,max and Frhod,min were determined in our laboratory, while other parameters (koff,rhod and kon,rhod, backward and forward rate constants for the calcium-dye reaction, respectively, with Kdrhod = koff,rhod/kon,rhod) for Rhod-2 were taken from Escobar et al. (1997).
Detection of calcium release events
After enzymatic dissociation, FDB fibres were permeabilized using 0.01% saponin for a few seconds. Spontaneous calcium release events were visualized by 50 μm Fluo-3 using a confocal laser scanning microscope (Zeiss 5 META, Oberkochen, Germany) at 22°C (as described by Lukacs et al. 2008; for additional details see Supplementary Material).
Images containing spontaneous calcium release events were analysed using an automatic event detection program (Szentesi et al. 2004; Szabo et al. 2010), which calculated the amplitude (ΔF/F0), full width at half maximum (FWHM), rise time and duration of the identified events.
Calculation of calcium release from the SR
The Ca2+ release flux (Rrel) was defined as the sum of Ca2+ fluxes entering the myoplasmic space and that transported back into the calcium storage organelle:
| (3) |
where Catotal is the total Ca2+ in the myoplasm, and Catransp is the amount of Ca2+ transported by the removal processes. Catotal was estimated as the sum of free Ca2+ (Cafree) and the amount of Ca2+ bound to intracellular binding sites such as dye (Cadye), troponin-C (CatropC), parvalbumin (Caparv) and pump (Capump):
| (4) |
In eqn (3) Catransp is the calcium quantity carried by Ca2+ removal mechanisms (pumps), which was considered proportional to the relative saturation of the pumps ([Capump]/[pump]). The proportionality factor is the maximum speed of Ca2+ removal (PVmax):
| (5) |
Removal parameters were taken from the literature (Schuhmeier et al. 2003; Jacquemond 2012) and used as described in our earlier reports (Csernoch et al. 1990; Szappanos et al. 2004).
Chemicals and statistical analysis
Chemicals, unless otherwise stated, were purchased from Sigma and were of analytical grade. Pooled data were expressed as mean ± standard error of the mean (SEM). The differences between control and Cmpt animals were assessed using one-way analysis of variance (ANOVA) and all pair-wise multiple comparison procedures (Student–Newman–Keuls method). An F-test was used to test the significance and P < 0.05 was considered to indicate a statistically significant difference.
Results
In vivo experiments
Cmpt mice displayed great hypermuscularity and their weight was more than twice that of control animals (see Fig. S1, Table 1). To check the in vivo muscle performance of the adult animals, 12–16-week-old mice were used from both groups in grip tests. As expected, based on the increased muscle mass, Cmpt mice performed significantly better than the wild-type animals in these tests. That is, the maximal force that they could produce was significantly greater than that of control animals. However, after normalization to body weight – to compensate for the increased muscle mass – wild-type mice displayed significantly greater relative force as compared to the Cmpt animals (Table1).
Table 1.
Grip-strength test data
| Control (n = 11) | Cmpt (n = 5)# | |
|---|---|---|
| Body weight (g) | 20.7 ± 0.7 | 56.0 ± 3.3*** |
| Absolute force (mN) | 71.1 ± 1.4 | 126.7 ± 4.0*** |
| Force normalized to body weight (mN g−1) | 3.48 ± 0.07 | 2.36 ± 0.09*** |
Significant difference at P < 0.001 as compared to control.
Numbers in parentheses denote the number of animals.
Experiments with the voluntary wheel gave similar results. Control mice performed significantly better given both the average and maximal speed and the total distance covered. In addition, they spent more time in the wheel than Cmpt mice (Table 2). Overall, these experiments clearly indicated that although Cmpt mice were larger and stronger, their strength was less than would be expected from the increase in muscle mass. To clarify the mechanisms underlying this, the steps in ECC were investigated in detail.
Table 2.
Distance and speed in voluntary wheel running
| Control (n = 8) | Cmpt (n = 8)# | |
|---|---|---|
| Distance (m day−1) | 7145 ± 553 | 3387 ± 283** |
| Average speed (m min−1) | 13.3 ± 1.0 | 9.6 ± 0.8** |
| Maximal speed (m min−1) | 23.1 ± 1.0 | 18.6 ± 1.0** |
| Duration (min day−1) | 544 ± 31 | 356 ± 25** |
Significant difference at P < 0.01 as compared to control.
Numbers in parentheses denote the number of animals.
In vitro experiments
Resting membrane potential
To exclude the possibility that the electrical properties of the cell membrane were substantially altered, the resting membrane potential of FDB muscle fibres from four control and three Cmpt animals was determined. Although average resting membrane potential was slightly depolarized in Cmpt animals (−77.8 ± 0.2 mV, n = 18) as compared to control mice (−79.2 ± 0.3 mV, n = 13), we do not consider this difference to be physiologically relevant.
Calcium sensitivity of the contractile system
As the next step, the possible alterations in the contractile machinery were studied in both Cmpt and control mice. Force development during isometric contractions was measured in 31 fibre segments (segment length 80.7 ± 5.1 μm) dissected from soleus and EDL fibres of four wild-type and four Cmpt mice. Figure 1 displays six representative isometric contractions at low (pCa = 6.0), intermediate (pCa = 5.6) and saturating (pCa = 4.75) calcium concentrations. Table 3 presents the average maximal active and passive isometric tension (Tactive and Tpassive, respectively), which were obtained by normalizing the force values to the cross section of the fibre segments. There was no significant difference in these values between wild-type and Cmpt animals.
Figure 1.
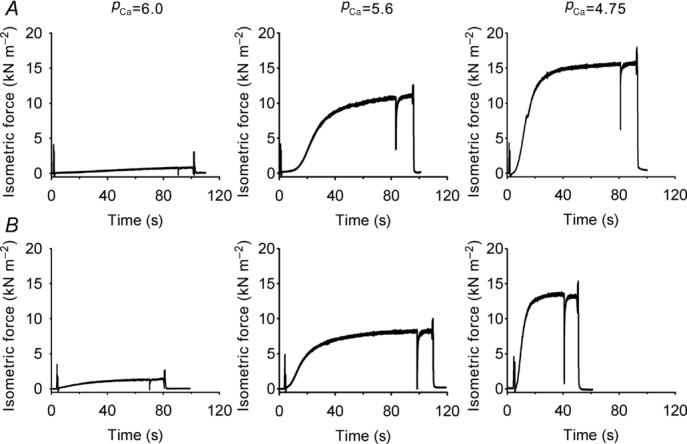
Isometric force was measured on chemically skinned (0.5% Triton-X 100) fibre segments isolated from the EDL muscle of control (A) and of Cmpt (B) mice at three different calcium concentrations (pCa = 6.0, 5.6 and 4.75). Fibres were rapidly transferred from a relaxing solution (pCa = 9) to the test solutions and the time-course of force development was recorded. In all cases a rapid release and re-stretch manoeuvre was also performed. Experimental conditions: fibre cross section area 1764 and 2074 μm2 in control and Cmpt mice, respectively; temperature 15°C.
Table 3.
Calcium sensitivity of isometric force
| Control |
Cmpt |
|||
|---|---|---|---|---|
| EDL (n = 8) | Soleus (n = 8) | EDL (n = 7) | Soleus (n = 8)# | |
| Cross section (μm2) | 1887 ± 343 | 1714 ± 235 | 2602 ± 380 | 3303 ± 386* |
| Tactive (kN m−2) | 26.14 ± 5.06 | 26.87 ± 3.98 | 25.25 ± 4.01 | 21.89 ± 2.18 |
| Tpassive (kN m−2) | 2.24 ± 0.58 | 2.07 ± 0.48 | 2.15 ± 0.47 | 2.86 ± 0.37 |
| kt (s−1) | 3.43 ± 0.39 | 1.98 ± 0.21 | 6.15 ± 0.65** | 1.84 ± 0.40 |
| pCa50 | 5.73 ± 0.02 | 5.73 ± 0.04 | 5.77 ± 0.03 | 5.78 ± 0.05 |
| nH | 3.21 ± 0.19 | 3.12 ± 0.29 | 3.15 ± 0.16 | 2.75 ± 0.20 |
Significant difference at P < 0.01 as compared to control.
Numbers in parentheses denote the number of fibres from four control and four Cmpt animals.
Tpassive: passive isometric tension; Tactive: active isometric tension; ktr: rate constant of force redevelopment; pCa50: midpoint of the force-calcium relationship; nH: Hill coefficient
To gain further insight into the effects of the Cmpt mutation on force generation, the Ca2+ sensitivities of the isometric force on EDL and soleus muscles of control and Cmpt mice were compared (Fig. 2). After fitting eqn (1) to the data points, no significant difference was observed in pCa50 or nH between the two groups of animals (Table 3). These results clearly suggest that the contractile machinery, including its calcium sensitivity, is not altered in the Cmpt strain.
Figure 2.
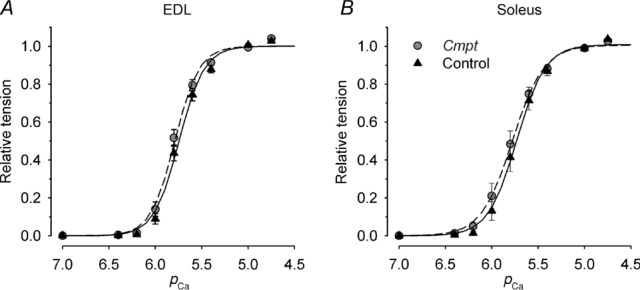
Maximal steady isometric force was determined for EDL (A) and soleus (B) muscles in control (black triangles) and in Cmpt mice (grey circles) at different calcium concentrations. These values were then normalized to those measured at pCa = 4.75, averaged over the individual fibres and plotted as a function of the calcium concentration of the activating solution. The lines indicate the Hill curves (eqn (1)) fitted to the data points (continuous line, control; dashed line, Cmpt). Parameters used to generate the fitted curves were: for EDL, nH = 3.21 and 3.32, pCa50 = 5.74 and 5.79; for soleus, nH = 2.82 and 2.59, pCa50 = 5.73 and 5.78 in control and Cmpt, respectively.
Changes in [Ca2+]i in Cmpt mice
Since the calcium sensitivity of the contractile proteins were similar in both groups of animals, the possible effects of the Cmpt mutation on calcium homeostasis was examined in isolated, single FDB skeletal muscle fibres of both types of mice. Twelve-to 16-week-old wild-type and Cmpt mice were used for functional experiments. Figure 3A presents calcium transients measured on these fibres evoked by depolarization using 120 mm KCl in the presence of a normal (1.8 mm) extracellular calcium concentration. The pooled data to confirm that the Cmpt mutation had little, if any, effects on the resting [Ca2+]i (Fig. 3B), suggesting that the calcium leak from and the extrusion into the extracellular environment was unaffected under these conditions. On the other hand, depolarization-evoked calcium transients were almost 50% higher in control than in Cmpt fibres (Fig. 3C).
Figure 3.
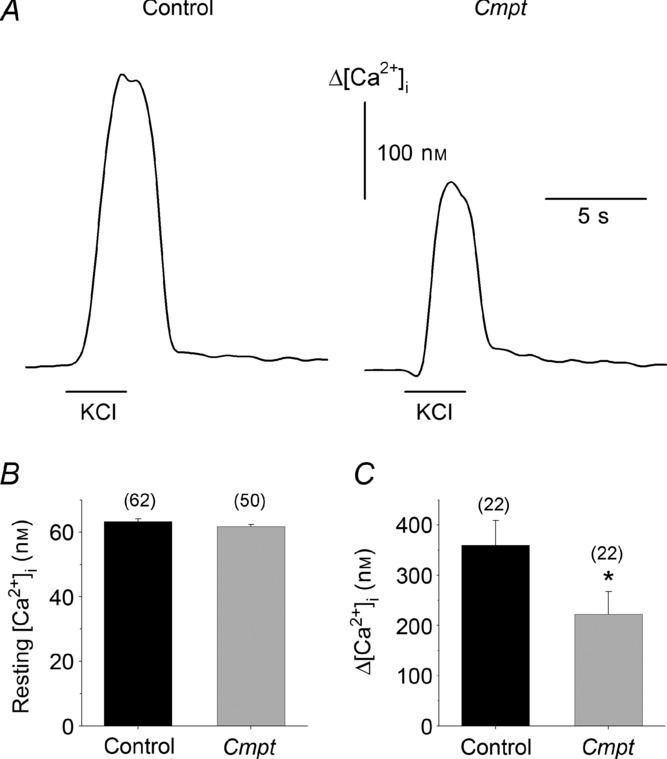
A, depolarization-evoked changes in intracellular calcium concentration on intact fibres isolated from the FDB muscles of control (left) and of Cmpt (right) mice. Depolarization was achieved by the local perfusion of 120 mm KCl for 3 s as indicated by the horizontal lines below the transients. B, pooled data from three control and three Cmpt animals. Averaged values of resting [Ca2+]i (B) and Δ[Ca2+]i (C). Numbers in parentheses are the number of fibres investigated. *Significant (P < 0.05) difference from control. Measurements were carried out at 22°C.
Action potential-evoked calcium transients in FDB fibres
Field stimulation-induced global calcium transients were also measured on FDB fibres. These calcium transients were visualized using laser scanning confocal microscopy in the line-scan mode. Figure 4 displays representative fluorescence intensity changes during single pulses (panels A and B) and during trains (panels C and D) of depolarizations. Note that the spatial profile of the transients was homogenous in both strains (see expanded images in Fig. 4A–D), indicating a normal propagation of the depolarization in the T-tubular system.
Figure 4.
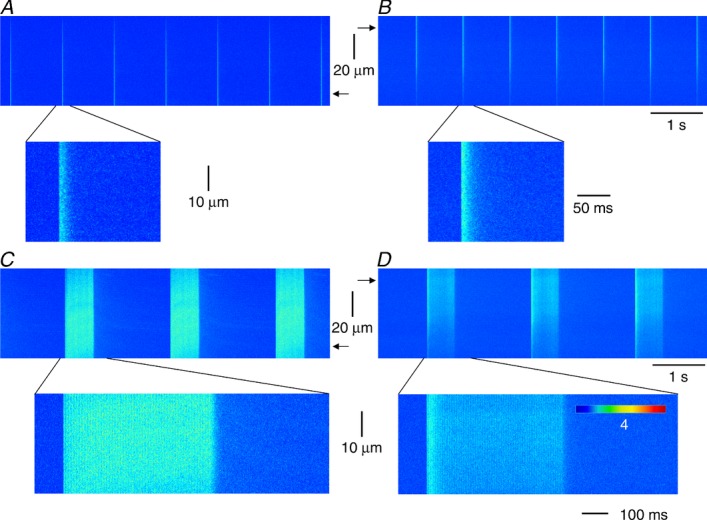
Intact fibres isolated from the FDB muscles were loaded with the calcium-sensitive fluorescent dye Rhod-2. Suprathreshold pulses were used to initiate action potentials, and the accompanying changes in Rhod-2 fluorescence were detected on a confocal microscope in the line-scan mode. Images of fluorescence intensity changes as evoked by single (A and B) and trains (C and D) of depolarizations in control (A and C) and in Cmpt (B and D) mice. Expanded images in all panels demonstrate the homogenous activation of the fibres. Arrows indicate the spatial point where the time courses presented in Fig. 5 were determined. Acquisition parameters: 4096 × 512 pixels, 1.53 ms line−1, 0.14 μm pixel−1; temperature 22°C.
To analyse the calcium transients, the line-scans were normalized and 10–15 points of the images in the space domain were averaged. Figure 5 presents representative fluorescence transients after normalization using single (top panel) and train (bottom panel) stimulation from control (left) and Cmpt (right) mice. Analysis of these transients revealed that the average amplitudes of the calcium transients in Cmpt fibres were almost identical during the single stimulation (2.37 ± 0.12 F/F0, n = 25 in control; 2.50 ± 0.15 F/F0, n = 26 in Cmpt, P > 0.4) but significantly reduced during the train stimulation as compared to controls (Table 4).
Figure 5.
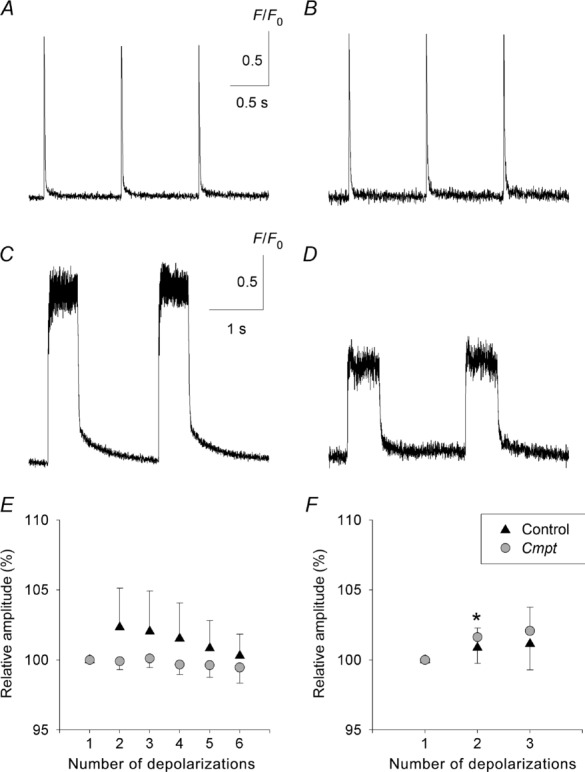
The traces (A–D) are spatially averaged time courses of Rhod-2 fluorescence of the line-scans in Fig. 4A–D, respectively, after normalizing to baseline fluorescence (F/F0). The average was calculated from 10 consecutive lines of the line-scans at the arrows in Fig. 4. Background was calculated from data points before the depolarization. Average of consecutive peaks of fluorescence intensities normalized to the first peak during the single (E) and train (F) depolarizations. Pooled data from three control (14 fibres) and three Cmpt (13 fibres) animals. *Significant (P < 0.05) difference from the first peak.
Table 4.
Parameters of the depolarization-evoked calcium transients and of the corresponding calcium release flux
| Control (n = 14) | Cmpt (n = 13)# | |
|---|---|---|
| ΔF/F0 | 2.42 ± 0.03 | 2.07 ± 0.10* |
| Δ[Ca2+]T (mm) | 3.06 ± 0.39 | 2.08 ± 0.23* |
| Rrel peak (μm ms−1) | 23.7 ± 3.0 | 15.8 ± 2.1* |
| Rrel steady level (μm ms−1) | 5.7 ± 0.7 | 3.7 ± 0.5* |
| Rrel peak/steady level | 4.3 ± 0.4 | 4.6 ± 0.6 |
| Time to peak of Rrel (ms) | 8.9 ± 0.3 | 8.9 ± 0.2 |
| Tau of inactivation (ms) | 6.7 ± 0.9 | 8.8 ± 1.3 |
Significant difference at P < 0.05 as compared to control.
Numbers in parentheses denote the number of fibres from three control and three Cmpt animals.
ΔF/F0: amplitude of calcium transient; [Ca2+]T: amount of calcium released from the SR; Rrel: Ca2+ release flux
During the measurements either six or three calcium transients were recorded for single or train stimulations, respectively. There was no significant decrease in the amplitude of the consecutive transients either in the single (Fig. 5E) or in the train (Fig. 5F) depolarizations in either animal group.
To further analyse calcium release from the SR, first the normalized fluorescence values of the train depolarisations were transformed to calcium concentration (eqn (2)), and then the total amount of calcium released ([Ca]T) and the calcium release flux (Rrel) through the RyRs was calculated (eqns (3)–(5). It is clear from Fig. 6 that the change in [Ca2+]i (top panel) as well as the total calcium released into the myoplasm (middle panel), and the corresponding calcium release flux (bottom panel) were reduced in Cmpt mice. Rrel reached its peak 9 ms after the onset of the depolarization and was significantly smaller in the Cmpt strain (Table 4). Furthermore, a significant difference was observed in the maintained steady level of Rrel. On the other hand, the ratio of peak-to-steady level and the time constant of the inactivation remained unchanged, i.e. they were essentially identical in the two animal groups. The amount of released calcium showed roughly a 30% decrease (Table 4) in the mutant animals. The data presented in Figs 6 and in Table 4 clearly demonstrate that depolarization-evoked calcium release from the SR was significantly reduced in Cmpt mice.
Figure 6.
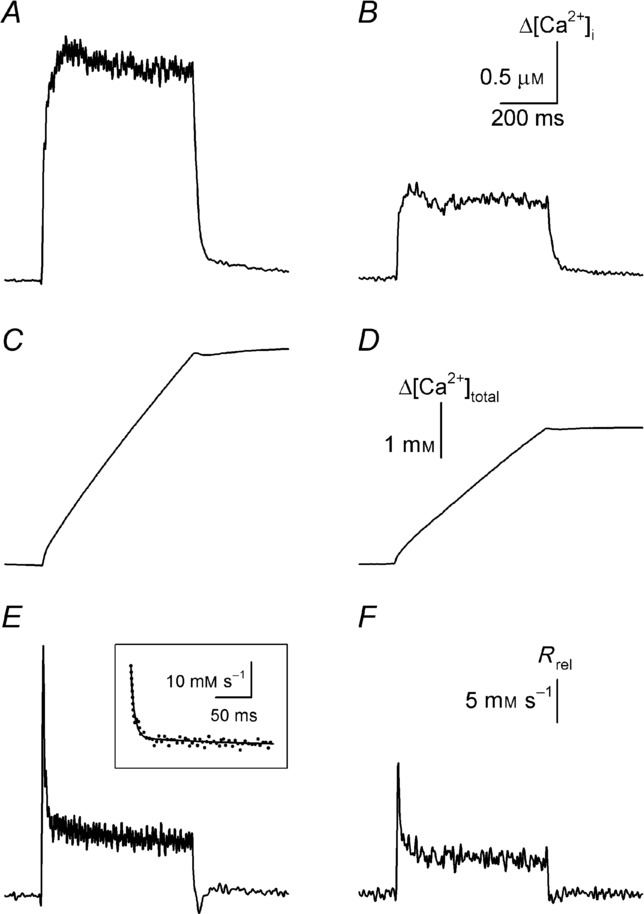
A and B, changes in intracellular calcium concentration calculated from the first transient shown in Fig. 5C and D, respectively, using eqn (2). C and D, the amount of calcium released ([Ca2+]T; eqn (3)) from the SR as determined from the transients shown in A and B. To calculate [Ca2+]T a removal model – with the following parameters: [dye] = 20 μm, koff,rhod = 130 s−1, kon,rhod = 82 μm−1 s−1, [parvalbumin] = 2 mm, Kdpump = 1 μm, [Ca2+]rest = 70 nm – was fitted to the declining phase of the transients following the depolarization (see Methods). E and F, the corresponding calcium release flux (FL) through the RyRs. The inset in E shows an enlarged portion of FL and the fitted exponential (τ = 5.1 ms), which was used to determine the time constant of inactivation.
Elementary calcium release events in Cmpt fibres
To understand the reasons underlying the suppressed SR calcium release, localized calcium release events were measured in control and in Cmpt fibres using high speed laser scanning confocal microscopy. The fibres displayed calcium sparks (calcium release events with large amplitude and short duration) and embers (events with small amplitude and long duration) (Fig. 7A). Note that the number of calcium sparks was far greater than that of embers. Although fibres from Cmpt mice generated calcium sparks and embers as for control cells (Fig. 7B), the characteristic parameters of these events were altered. Plotting the amplitude histograms of sparks (Fig. 8A) revealed that the Cmpt mutation was associated with an increase in the relative frequency of calcium sparks with smaller amplitudes. Pooled data show that on average the amplitude of the calcium sparks was significantly higher in control fibres than in Cmpt cells (0.165 ± 0.001 vs. 0.154 ± 0.002, respectively; P < 0.001). Similarly, we observed a relatively higher amount of faster evolving sparks in Cmpt than in control mice (Fig. 8B), the average rise time showed a significant (30%, P < 0.01) reduction (from 34.7 ± 0.9 to 24.3 ± 0.8 ms in control and Cmpt mice, respectively). Although the overall shape of FWHM histograms remained unaffected in Cmpt animals, the distribution was slightly shifted to the left (Fig. 8C). That is, the Cmpt mutation decreased the average FWHM significantly (P < 0.01) from the control 1.92 ± 0.01 to 1.87 ± 0.01 μm. The distribution of event duration was also altered by the mutation (Fig. 8D), showing a relatively high frequency of shorter events in Cmpt mice. In addition, and in accordance with the above, the frequency of the spontaneous calcium release events was also significantly (P < 0.001) reduced in fibres from Cmpt mice (6.2 ± 0.5 Hz) as compared to the control group (33.0 ± 2.7 Hz).
Figure 7.
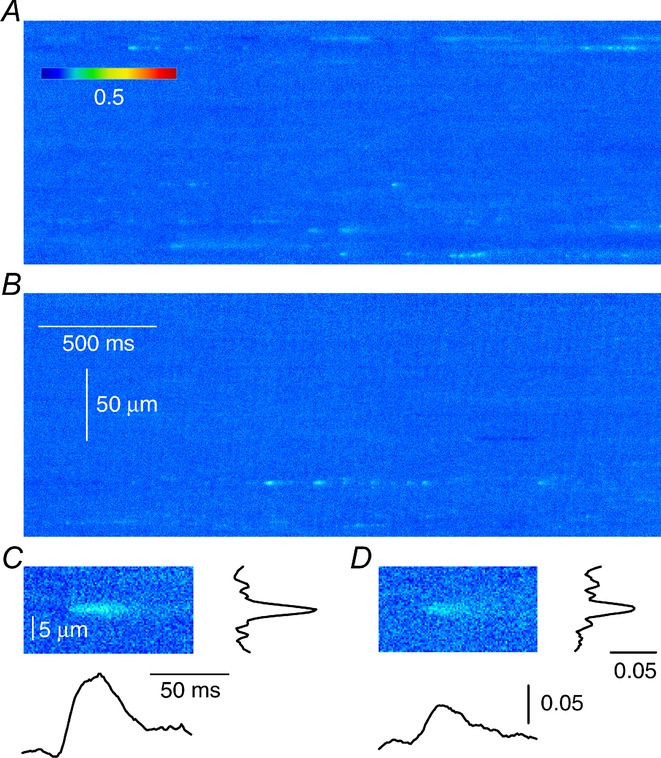
A and B, line-scan images from fibres of FDB muscles taken from control (A) and from Cmpt (B) mice. Enzymatically isolated fibres were permeabilized with a brief exposure to 0.01% Saponin and loaded with Fluo-3. C and D, representative sparks with their spatial profiles and time courses detected in control (C) and in Cmpt (D) mice. Spatial and temporal profiles were calculated from the average of five consecutive rows or columns at the maximum of the event. Acquisition parameters: 4096 × 512 pixels, 1 ms line−1, 0.33 μm pixel−1; temperature 22°C.
Figure 8.
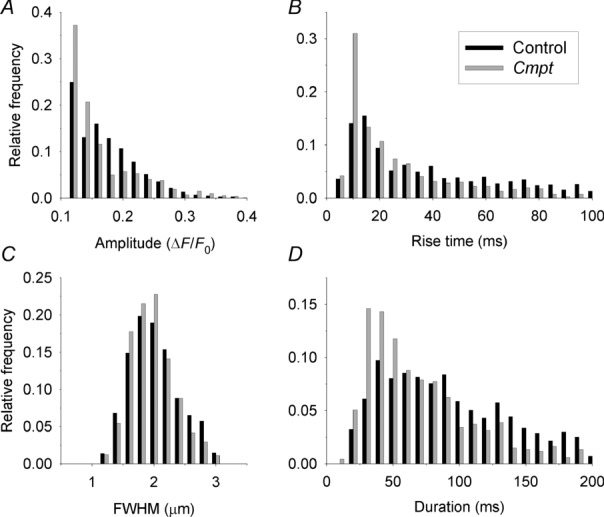
Amplitude (A), rise time (B), FWHM (C) and duration (D) histograms of calcium release events from control (black bars, eight animals) and from Cmpt (grey bars, six animals) mice. Events were identified in the line-scan images with an automated detection routine based on wavelet transformation (see Methods). Values of the selected parameters were binned and plotted as relative frequencies to present their distributions. Events with amplitudes smaller than 0.1 ΔF/F0 and with FWHM smaller than 0.3 μm were not included in the analysis.
Discussion
Myostatin knock-out as well as Cmpt mice – despite their increased muscle weight – were found to have reduced specific force as compared to control animals (Amthor et al. 2007). Despite the fact that changes in fibre composition and consequently altered metabolic status of the muscles from these mice have been reported (e.g. Girgenrath et al. 2005), a clear explanation for the altered contractile function is not yet available. Here, on the one hand, we complement the observations previously made in vivo and, on the other, provide evidence that alterations in calcium signalling but not in the activation of the contractile machinery underlie the reduced force production.
Our results from in vivo measurements are in agreement with those published earlier for both Mstn−/− (Amthor et al. 2007; Savage & McPherron, 2010) and Cmpt mice (Amthor et al. 2007) showing a reduced physical performance, as Cmpt animals were less agile in voluntary wheel running. Furthermore, the observation that the normalized force – force normalized to body weight – was reduced in the grip-strength tests in Cmpt mice is consistent with the idea that the increased muscle mass was not accompanied by a parallel and proportional increase in overall force. Although it is likely that alterations in cardiovascular and/or respiratory functions also contributed to the reduced physical performance in the activity wheel for these animals, based on previous reports as well as on our own findings mentioned above, changes in the events that couple electrical excitation to contraction are also part of the pathology.
Based on the previously reported changes in fibre metabolism associated with the myostatin mutation, including shifts in the oxidative state of the muscle (Girgenrath et al. 2005; Baan et al. 2013) as well as a large increase in the ATP cost of contraction (Giannesini et al. 2013), it was tempting to assume that an altered acto-myosin interaction would be responsible for the reduced specific force since the former can be accompanied by modifications in myosin expression. In contrast to this expectation we were unable to demonstrate any modification in the pCa dependence of force production as studied in chemically skinned fibre segments. Neither fast nor slow muscles displayed any change in their pCa–tension curves. In addition, the maximal attainable tension was also similar in control and Cmpt animals.
On the other hand, action potential-evoked calcium transients were significantly reduced in mutant as compared to control animals. This reduction in the increase in [Ca2+]i during a train of action potentials that is the physiological stimulus during in vivo contractions – taken together with the unaltered pCa–tension relationship – readily explains the reduced overall tension. Note, however, that the reduction in [Ca2+]i and the consequently anticipated reduced force, based on the measured pCa–tension relationship, was proportionally less than the increase in muscle diameter (2.35 ± 0.19 vs. 6.93 ± 0.32 mm2 in the control (n = 13) and Cmpt (n = 19) strains, respectively, for EDL, P < 0.001) not accounting fully for the observed greater strength in grip tests.
SR calcium release flux was determined from the global calcium transients and a 33% reduction was observed in both the peak and the maintained steady flux. Since the peak-to-steady ratio was unaltered in Cmpt mice, i.e. the waveform of the SR calcium release flux was essentially the same in the mutant and the control animals, the kinetics of activation and inactivation of the calcium release channels was probably not affected. This was further strengthened by the findings that the time-to-peak of SR calcium release flux as well as the rate constant of inactivation, calculated by fitting an exponential function to the declining phase, were essentially unchanged. Note at this point that a slight (but statistically not significant) increase in the time constant was indeed observed, which is in line with previous reports that a reduced SR calcium release would initiate a slower inactivation (see e.g. Sárközi et al. 1996). Furthermore, in accordance with the above, a clear reduction in the amount of calcium released from the SR during a train of action potentials was also detected.
These observations leave three possibilities, or their combination, to explain the reported findings. First, there is a reduction in SR calcium content; second, there is a reduction in RyR permeability/conductance; and third, the number of activated RyRs is reduced. It should be stressed, however, that the magnitude of these modifications should not be too extensive or changes in the kinetics of inactivation would accompany the reduced SR calcium release. Indeed, the reduction in SR calcium release flux observed here was within these limits and was comparable to earlier studies in which the effect of SR depletion on the SR calcium release waveform was investigated (Klein et al. 1988). Reduced RyR permeability or SR calcium content could be the result of an altered metabolic state of the muscle since the redox sensitivity of RyRs has been demonstrated in a number of publications (e.g. Liu et al. 1994; Bull et al. 2007; Petrotchenko et al. 2011). These reports concluded that reducing conditions transform the channel to a low-open probability state, while oxidative conditions transform it to a high-open probability state (Marengo et al. 1998). Therefore, shifts in the redox state of the myoplasm from the control to more reducing would result in a reduced activation, while shifts to a more oxidative state would result in an increased resting SR leak and a consequent reduction in SR calcium content (e.g. Oba et al. 2002), both in line with the observations seen here. To determine whether the RyR channels per se were affected in the mutant strain, direct measurements of the channel activity would be needed. At present, there are no data available in the literature on RyRs isolated from Cmpt or Mstn−/− mice. Here we attempted to gain insight into channel function using Saponin-skinned fibres and determining the characteristics of calcium release events. Although these events should be regarded with caution since they do not appear with appreciable frequency in non-skinned fibres, their study appear the only way to tackle channel behaviour in the native environment (Klein & Schneider 2006). Due to the above mentioned clear limitations, only the simplest properties were investigated in detail in this study. It is clear from the results that calcium release events occur with a lower frequency in Cmpt animals than they do in control mice (Fig. 7). In addition, these events have a smaller amplitude and FWHM than their control counterparts. These observations are consistent with the idea that channels open less readily and release less calcium once they are opened in the mutant as compared to control mice. Although we cannot exclude the possibility that fibres from Cmpt animals respond differently to Saponin treatment, it is more likely that the observed changes are indeed due to alterations in calcium release. This is strengthened by the fact that the observed changes in the parameters of the calcium release events are clearly in line with the alterations seen for global calcium transients in intact fibres. In particular, the reduced number of events and the amount of calcium released per event would readily explain why global calcium transients were smaller in the mutant animals. These findings would then suggest that the alterations that explain the Cmpt phenotype – with regard to the reduced force – reside, at least in part, in the calcium release process.
Considering the above, the most likely explanation for the reduced calcium release is a reduction in SR content. This would then influence the release process through at least two routes. The activation of RyRs depends on the calcium concentration inside the SR, namely a lower intraluminar calcium concentration results in a lower activation level of the channels (Laver, 2005). In addition, due to the lower SR calcium, the current through the channels is also reduced. These effects combined would then explain the lower frequency as well as the lower amplitude of the calcium release events and, finally, the reduced calcium transients. Although, at present, we have no clear explanation for how the mutation leads to the reduction in SR calcium content, all the data are consistent with the idea that the reduced specific force of these mice is the consequence of this alteration.
Key points
Hypermuscularity associated with naturally occurring mutations in the myostatin gene as found in Compact mice results in increased muscle mass but reduced specific force.
The calcium sensitivity of the contractile apparatus as assessed on chemically skinned skeletal muscle fibres under isometric conditions is not altered in these animals.
While the resting calcium concentration remains unaffected, depolarization-evoked increases in intracellular calcium concentration are suppressed.
Spontaneous calcium release events from sarcoplasmic reticulum are also decreased in frequency, amplitude and spatial spread.
Our results suggest that mutations in the myostatin gene are accompanied by alterations in excitation contraction coupling, which manifest as a reduction in sarcoplasmic calcium release.
Acknowledgments
None declared.
Glossary
- ECC
excitation–contraction coupling
- EDL
extensor digitorum longus
- FDB
flexor digitorum brevis
- FWHM
full width at half maximum
- RyR
ryanodine receptor
- SR
sarcoplasmic reticulum
- T-tubular
transverse-tubular
Additional information
Competing interests
None.
Author contributions
D.B., N.G., O.R., T.O., B.H, M.Sz., J.F., B.D., Á.B., L.Sz. and P.Sz. performed experiments, and collected, analysed and interpreted data. Z.P., G.M., L.Cs. and P.Sz. designed and supervised the study, analysed and interpreted data and wrote the paper. This work is part of the PhD thesis of D.B. under the supervision of P.Sz. All authors approved the final version of the manuscript. All experiments were performed at the University of Debrecen.
Funding
This work was supported by grants from the Hungarian Scientific Research Found (OTKA NN-107765), from the Hungarian Ministry of Human Resources (TÁMOP-4.2.1/B-09/1/KONV-2010-0007, TÁMOP-4.2.2/B-10/1-2010-0024 and TÁMOP-4.2.2.A-11/1/KONV-2012-0025). This paper was supported by the János Bólyai Research Scholarship of the Hungarian Academy of Sciences to J.F. and the Bridging Fund of UD Faculty of Medicine.
References
- Amthor H, Macharia R, Navarrete R, Schuelke M, Brown SC, Otto A, Voit T, Muntoni F, Vrbóva G, Partridge T, Zammit P, Bunger L, Patel K. Lack of myostatin results in excessive muscle growth but impaired force generation. Proc Natl Acad Sci U S A. 2007;104:1835–1840. doi: 10.1073/pnas.0604893104. [DOI] [PMC free article] [PubMed] [Google Scholar]
- Baán JA, Kocsis T, Keller-Pintér A, Müller G, Zádor E, Dux L, Mendler L. The compact mutation of myostatin causes a glycolytic shift in the phenotype of fast skeletal muscles. J Histochem Cytochem. 2013;61:889–900. doi: 10.1369/0022155413503661. [DOI] [PMC free article] [PubMed] [Google Scholar]
- Bodine SC, Stitt TN, Gonzalez M, Kline WO, Stover GL, Bauerlein R, Zlotchenko E, Scrimgeour A, Lawrence JC, Glass DJ, Yancopoulos GD. Akt/mTOR pathway is a crucial regulator of skeletal muscle hypertrophy and can prevent muscle atrophy in vivo. Nat Cell Biol. 2001;3:1014–1019. doi: 10.1038/ncb1101-1014. [DOI] [PubMed] [Google Scholar]
- Bull R, Finkelstein JP, Humeres A, Behrens MI, Hidalgo C. Effects of ATP, Mg2+, and redox agents on the Ca2+ dependence of RyR channels from rat brain cortex. Am J Physiol Cell Physiol. 2007;293:C162–C171. doi: 10.1152/ajpcell.00518.2006. [DOI] [PubMed] [Google Scholar]
- Bünger L, Laidlaw AH, Bulfield G, Eisen EJ, Medrano JF, Bradford GE, Prichner F, Renne U, Schlote W, Hill WG. Inbred lines of mice derived from long-term on growth selected lines: unique resources for mapping growth genes. Mamm Genome. 2001;12:678–686. doi: 10.1007/s00335001-3018-6. [DOI] [PubMed] [Google Scholar]
- Csernoch L, Kovács L, Nilius B, Szücs G. Caffeine and the myoplasmic calcium removal mechanisms in cut frog skeletal muscle fibres. Gen Physiol Biophys. 1990;9:251–266. [PubMed] [Google Scholar]
- Csernoch L, Pouvreau S, Ronjat M, Jacquemond V. Voltage-activated elementary calcium release events in isolated mouse skeletal muscle fibers. J Membr Biol. 2008;226:43–55. doi: 10.1007/s00232-008-9138-0. [DOI] [PMC free article] [PubMed] [Google Scholar]
- Elkina Y, von Haehling S, Anker SD, Springer J. The role of myostatin in muscle wasting: an overview. J Cachexia Sarcopenia Muscle. 2011;2:143–151. doi: 10.1007/s13539-011-0035-5. [DOI] [PMC free article] [PubMed] [Google Scholar]
- Escobar AL, Velez P, Kim AM, Cifuentes F, Fill M, Vergara JL. Kinetic properties of DM-nitrophen and calcium indicators: rapid transient response to flash photolysis. Pflugers Arch. 1997;434:615–631. doi: 10.1007/s004240050444. [DOI] [PubMed] [Google Scholar]
- Fodor J, Gönczi M, Sztretye M, Dienes B, Oláh T, Szabó L, Csoma E, Szentesi P, Szigeti GP, Marty I, Csernoch L. Altered expression of triadin 95 causes parallel changes in localized Ca2+ release events and global Ca2+ signals in skeletal muscle cells in culture. J Physiol. 2008;586:5803–5818. doi: 10.1113/jphysiol.2008.160457. [DOI] [PMC free article] [PubMed] [Google Scholar]
- Franzini-Armstrong C, Protasi F. Ryanodine receptors of striated muscles: a complex channel capable of multiple interactions. Physiol Rev. 1997;77:699–729. doi: 10.1152/physrev.1997.77.3.699. [DOI] [PubMed] [Google Scholar]
- Giannesini B, Vilmen C, Amthor H, Bernard M, Bendahan D. Lack of myostatin impairs mechanical performance and ATP cost of contraction in exercising mouse gastrocnemius muscle in vivo. Am J Physiol Endocrinol Metab. 2013;305:E33–E40. doi: 10.1152/ajpendo.00651.2012. [DOI] [PubMed] [Google Scholar]
- Girgenrath S, Song K, Whittemore LA. Loss of myostatin expression alters fiber-type distribution and expression of myosin heavy chain isoforms in slow-and fast-type skeletal muscle. Muscle Nerve. 2005;31:34–40. doi: 10.1002/mus.20175. [DOI] [PubMed] [Google Scholar]
- Jacquemond V. Waveless mammalian muscle. J Physiol. 2012;590:1783. doi: 10.1113/jphysiol.2012.230672. [DOI] [PMC free article] [PubMed] [Google Scholar]
- Jenes A, Bodnár D, Ruzsnavszky O, Geyer N, Dienes B, Balogh A, Papp Z, Szentesi P, Csernoch L. Modified EC coupling in myostatin deficient (MSTN−/−) mice. J Muscle Res Cell Motil. 2012;33:242–243. [Google Scholar]
- Kambadur R, Sharma M, Smith TP, Bass JJ. Mutations in myostatin (GDF8) in double-muscled Belgian Blue and Piedmontese cattle. Genome Res. 1997;7:910–916. doi: 10.1101/gr.7.9.910. [DOI] [PubMed] [Google Scholar]
- Klein MG, Simon BJ, Szucs G, Schneider MF. Simultaneous recording of calcium transients in skeletal muscle using high-and low-affinity calcium indicators. Biophys J. 1988;53:971–988. doi: 10.1016/S0006-3495(88)83178-3. [DOI] [PMC free article] [PubMed] [Google Scholar]
- Klein MG, Schneider MF. Ca2+sparks in skeletal muscle. Progr Biophys Mol Biol. 2006;92:308–332. doi: 10.1016/j.pbiomolbio.2005.05.016. [DOI] [PubMed] [Google Scholar]
- Lai KV, Gonzalez M, Poueymirou WT, Kline WO, Na E, Zlotchenko E, Stitt TN, Economides AN, Yancopoulos GD, Glass DJ. Conditional activation of Akt in adult skeletal muscle induces rapid hypertrophy. Mol Cell Biol. 2004;24:9295–9304. doi: 10.1128/MCB.24.21.9295-9304.2004. [DOI] [PMC free article] [PubMed] [Google Scholar]
- Lamb G. Voltage-sensor control of Ca2+ release in skeletal muscle: insights from skinned fibers. Front Biosci. 2002;7:834–842. doi: 10.2741/A815. [DOI] [PubMed] [Google Scholar]
- Langley B, Thomas M, Bishop A, Sharma M, Gilmour S, Kambadur R. Myostatin inhibits myoblast differentiation by down-regulating MyoD expression. J Biol Chem. 2002;277:49831–49840. doi: 10.1074/jbc.M204291200. [DOI] [PubMed] [Google Scholar]
- Laver DR. Coupled calcium release channels and their regulation by luminal and cytosolic ions. Eur Biophys J. 2005;34:359–368. doi: 10.1007/s00249-005-0483-y. [DOI] [PubMed] [Google Scholar]
- Liu G, Abramson JJ, Zable AC, Pessah IN. Direct evidence for the existence and functional role of hyperreactive sulfhydryls on the ryanodine receptor-triadin complex selectively labeled by the coumarin maleimide 7-diethylamino-3-(4′-maleimidylphenyl)-4-methylcoumarin. Mol Pharmacol. 1994;45:189–200. [PubMed] [Google Scholar]
- Lukács B, Sztretye M, Almássy J, Sárközi S, Dienes B, Mabrouk K, Simut C, Szabó L, Szentesi P, De Waard M, Ronjat M, Jóna I, Csernoch L. Charged surface area of maurocalcine determines its interaction with the skeletal ryanodine receptor. Biophys J. 2008;95:3497–3509. doi: 10.1529/biophysj.107.120840. [DOI] [PMC free article] [PubMed] [Google Scholar]
- Marengo JJ, Hidalgo C, Bull R. Sulfhydryl oxidation modifies the calcium dependence of ryanodine-sensitive calcium channels of excitable cells. Biophys J. 1998;74:1263–1277. doi: 10.1016/S0006-3495(98)77840-3. [DOI] [PMC free article] [PubMed] [Google Scholar]
- McPherron AC, Lawler AM, Lee SJ. Regulation of skeletal muscle mass in mice by a new TGF-β superfamily member. Nature. 1997;387:83–90. doi: 10.1038/387083a0. [DOI] [PubMed] [Google Scholar]
- Mosher DS, Quignon P, Bustamante CD, Sutter NB, Mellersh CS, Parker HG, Ostrander EA. A mutation in the myostatin gene increases muscle mass and enhances racing performance in heterozygote dogs. PLoS Genet. 2007;3:e79. doi: 10.1371/journal.pgen.0030079. [DOI] [PMC free article] [PubMed] [Google Scholar]
- Oba T, Murayama T, Ogawa Y. Redox states of type 1 ryanodine receptor alter Ca2+ release channel response to modulators. Am J Physiol Cell Physiol. 2002;282:C684–C692. doi: 10.1152/ajpcell.01273.2000. [DOI] [PubMed] [Google Scholar]
- Papp Z, Szabo A, Barends JP, Stienen GJM. The mechanism of the force enhancement by Mg-ADP under simulated ischaemic conditions in rat cardiac myocytes. J Physiol. 2002;543:177–189. doi: 10.1113/jphysiol.2002.022145. [DOI] [PMC free article] [PubMed] [Google Scholar]
- Petrotchenko EV, Yamaguchi N, Pasek DA, Borchers CH, Meissner G. Mass spectrometric analysis and mutagenesis predict involvement of multiple cysteines in redox regulation of the skeletal muscle ryanodine receptor ion channel complex. Res Rep Biol. 2011;2011:13–21. doi: 10.2147/RRB.S15776. [DOI] [PMC free article] [PubMed] [Google Scholar]
- Ríos E, Pizarro G. Voltage sensor of excitation–contraction coupling in skeletal muscle. Physiol Rev. 1991;71:849–908. doi: 10.1152/physrev.1991.71.3.849. [DOI] [PubMed] [Google Scholar]
- Savage KJ, McPherron AC. Endurance exercise training in myostatin null mice. Muscle Nerve. 2010;42:355–362. doi: 10.1002/mus.21688. [DOI] [PMC free article] [PubMed] [Google Scholar]
- Sárközi S, Szentesi P, Jona I, Csernoch L. Effects of cardiac glycosides on excitation–contraction coupling in frog skeletal muscle fibres. J Physiol. 1996;495:611–626. doi: 10.1113/jphysiol.1996.sp021620. [DOI] [PMC free article] [PubMed] [Google Scholar]
- Schuhmeier RP, Dietze B, Ursu D, Lehmann-Horn F, Melzer W. Voltage-activated calcium signals in myotubes loaded with high concentrations of EGTA. Biophys J. 2003;84:1065–1078. doi: 10.1016/S0006-3495(03)74923-6. [DOI] [PMC free article] [PubMed] [Google Scholar]
- Szabó G, Dallmann G, Müller G, Patthy L, Soller M, Varga L. A deletion in the myostatin gene causes the compact (Cmpt) hypermuscular mutation in mice. Mamm Genome. 1998;9:671–672. doi: 10.1007/s003359900843. [DOI] [PubMed] [Google Scholar]
- Szabó LZ, Vincze J, Csernoch L, Szentesi P. Improved spark and ember detection using stationary wavelet transforms. J Theor Biol. 2010;264:1279–1292. doi: 10.1016/j.jtbi.2010.04.005. [DOI] [PubMed] [Google Scholar]
- Szappanos H, Cseri J, Deli T, Kovács L, Csernoch L. Determination of depolarisation-and agonist-evoked calcium fluxes on skeletal muscle cells in primary culture. J Biochem Biophys Methods. 2004;59:89–101. doi: 10.1016/j.jbbm.2003.12.002. [DOI] [PubMed] [Google Scholar]
- Szentesi P, Szappanos H, Szegedi C, Gönczi M, Jona I, Cseri J, Kovács L, Csernoch L. Altered elementary calcium release events and enhanced calcium release by thymol in rat skeletal muscle. Biophys J. 2004;86:1436–1453. doi: 10.1016/S0006-3495(04)74213-7. [DOI] [PMC free article] [PubMed] [Google Scholar]
- Varga L, Szabó G, Darvasi A, Müller G, Sass M, Soller M. Inheritance and mapping of CompactCmpt), a new mutation causing hypermuscularity in mice. Genetics. 1997;147:755–764. doi: 10.1093/genetics/147.2.755. [DOI] [PMC free article] [PubMed] [Google Scholar]
- Varga L, Müller G, Szabó G, Pinke O, Korom E, Kovács B, Patthy L, Soller M. Mapping modifiers affecting muscularity of the myostatin mutant (MstnCmpt-dl1Abc) compact mouse. Genetics. 2003;165:257–267. doi: 10.1093/genetics/165.1.257. [DOI] [PMC free article] [PubMed] [Google Scholar]
Associated Data
This section collects any data citations, data availability statements, or supplementary materials included in this article.