Abstract
Photoacoustic (PA) imaging techniques have recently attracted much attention and can be used for noninvasive imaging of biological tissues. Most PA imaging systems in research laboratories use the time domain method with expensive nanosecond pulsed lasers that are not affordable for most educational laboratories. Using an intensity modulated light source to excite PA signals is an alternative technique, known as the frequency domain method, with a much lower cost. In this paper, we describe a simple frequency domain PA system and demonstrate its imaging capability. The system provides opportunities not only to observe PA signals in tissue phantoms, but also to acquire hands-on skills in PA signal detection. It also provides opportunities to explore the underlying mechanisms of the PA effect.
Keywords: Photoacoustic effect, Lock-in Amplifier, Frequency-domain
I. INTRODUCTION
Optical imaging of cancer has been intensively studied in recent years due to its unique and high sensitivity to endogenous and exogenous tumor contrast.(1, 2) These optical techniques are usually limited either in penetration depth, e.g. a few hundred of microns for optical microscopy, or in spatial resolution, e.g. a few millimeters for optical diffuse optical tomography (DOT).(1-3) Obviously, a tradeoff exists between the imaging depth and spatial resolution.(4) To overcome this limitation, ultrasound techniques have been combined with optical approaches, yielding various diagnostic techniques such as photoacoustic (PA) imaging.(4) Using PA techniques, the ratio of imaging depth to spatial resolution can reach values up to about 100, which is ~10 times higher than what can be achieved with conventional DOT. PA techniques can potentially be used for imaging cancers in human breast, prostate, skin, thyroid, neck, head, and others areas.(4) PA techniques provide optical contrast, which is usually much more sensitive to functional and molecular information of the tissue than ultrasound techniques, making it possible to measure the concentrations of total hemoglobin, oxy- and deoxy-hemoglobin, and specific molecules regulating tumor growth and metastasis.(4, 5) Compared with pure optical imaging methods, such as DOT, PA techniques have much higher spatial resolution and similar imaging depth.(4, 5) The basic mechanism of the PA effect can be briefly explained as follows: (1) tissue absorbs the energy of light illumination; (2) the absorbed energy leads to a local temperature rise in the tissue; and (3) a pressure or sound wave, called the PA signal, is generated due to the thermoelastic effect.(4)
Most PA imaging systems in large research laboratories use a nanosecond pulsed laser with high pulse energy. A short light pulse avoids energy loss due to thermal energy diffusion before the generation of PA signals, which is known as thermal confinement.(6) A nanosecond pulsed laser with high pulse energy typically costs tens of thousands of dollars and is usually positioned on a large optical table. Low cost and compact PA imaging techniques that do not rely on nanosecond pulsed laser systems are useful for educational and research laboratories with limited resources, and for global healthcare.(7-11) In this study, we have developed a frequency-domain PA (FD-PA) imaging system by using an inexpensive laser diode, a conventional single element ultrasound transducer, and a lock-in amplifier to improve the signal-to-noise ratio.(12-16) The theory and the experimental implementation of FD-PA have been extensively described in the literature.(8, 10, 11, 17) A simple, compact and cost efficient FD-PA imaging system is an excellent teaching and research tool for educators and researchers. It allows students and the general public to understand the underlying mechanisms of the PA effect and its applications, such as cancer imaging.
II. FUNDAMENTAL THEORY OF FREQUENCY-DOMAIN PHOTOACOUSTICS
The wave equation used to quantify photoacoustic pressure is usually expressed as follows:
| (1) |
where P represents the photoacoustic signal, H is the laser heating function, v is the speed of sound, β is the thermal expansion coefficient, and CP is the heat capacity per unit mass at constant pressure of the irradiated medium. In the frequency domain, the laser intensity is usually modulated as a sinusoidal function with frequency f . Assuming the amplitude of the modulated intensity is I0, the heating function can be expressed as:
| (2) |
where ω = 2π f and μa is the absorption coefficient of the medium, which is usually proportional to the absorber concentration in the sample. When considering an infinitely long and optically thin planar or cylindrical absorber, the generated PA waves in the frequency-domain can be represented by
| (3) |
| (4) |
where l is the thickness of the slab, a is the radius of the cylinder, and r̂ is the radial coordinate. J0 and J1 are the zeroth- and first-order Bessel functions, respectively. and represent the zeroth- and first-order Hankel functions, respectively. q̂ is the dimensionless frequency and t̂ is the dimensionless time. For a slab, q̂ = ωl/2v and . For a cylinder, q̂ = ωa/v and t̂ = vt/a. and v̂ = vin/vout are the dimensionless density and speed-of-sound parameters, respectively. The subscripts “in” refers to inside the absorber and “out” refers to outside the absorber. For a small spherical absorber with radius a, the PA wave can be expressed as
| (5) |
where q̂ = ωa/v and .
Using Eqs. (3) - (5) the following can be concluded about the strength of the FD-PA signal: (1) it is a sinusoidal function of time with the same frequency ω as that of the modulated light; (2) it is proportional to the optical absorption coefficient μa of the medium; (3) it is proportional to the amplitude of the modulated intensity I0; and (4) it depends on the modulation frequency ω via q̂.(18, 19) In this study, the sample setup can be assumed to be a cylindrical absorber, described by Eq. (4).
III. MEASUREMENT SYSTEM AND DATA PROCESSING
A. Measurement system
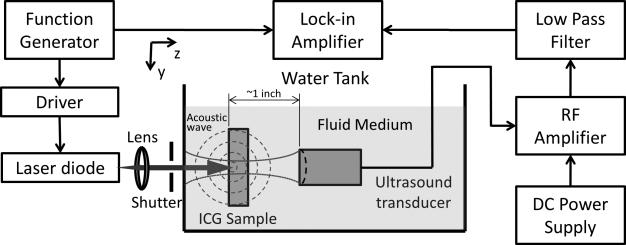
Figure 1 shows the experimental setup. A function generator (FG, Agilent 33120A, Agilent Tech) generates a sinusoidal voltage signal of frequency f and a synchronized TTL (Transistor-Transistor Logic) signal with the same frequency and a fixed phase shift. The sinusoidal signal is sent to a homemade circuit, shown in Fig. 2, to drive the laser diode (L785P100, Thorlabs). Thus, the laser intensity is modulated with the frequency f. The laser diode has a central wavelength of 785 nm and a power of ~100 mW when operating in DC mode. A lens is used to collimate the laser beam and a mechanical shutter is used to manually block the laser illumination to measure the background signal. The synchronized TTL signal from the FG is sent to a lock-in amplifier (LIA, SR844, Stanford Research Systems) and used as a reference signal. The sample and ultrasound transducer (UST, Olympus NDT, one inch focal length) are submerged into a transparent 10-gallon tank (20 cm wide, 40 cm long, 24 cm high), filled with either water or an intralipid solution. The sample used is an indocyanine green (ICG) aqueous solution, which is injected into a partially optically and acoustically transparent tube (MRE-095, Braintree Scientific) that is vertically positioned in the tank. The outer and inner diameters of the tube are 2.5 and 1.7 mm, respectively. The UST is focused on the sample. Both the lateral and axial sizes of the focal zone, normally measured in terms of the full width at half maximum (FWHM), depend on the central frequency of the UST. When the intensity-modulated laser reaches the optically absorbing sample, a PA wave is generated. The PA wave is detected and converted into a voltage signal by the UST and further amplified (ZFL-1000LN, Mini Circuits) and filtered (SLP-5+, Mini Circuits). A total gain of 40 dB is applied by using two identical amplifiers in series, driven by a DC power supply (BK Precision 1506). The low pass filter (SLP-5+, Mini Circuits) is not required because the LIA has a very narrow bandwidth. The processed PA signal is delivered to the LIA and the amplitude of the PA signal and the phase difference between the PA signal and the reference signal are displayed on the screen of the LIA.
Fig. 1.
The experimental setup used for PA imaging. The tank with the ICG sample is filled with either water or an intralipid solution. The function generator provides a sinusoidal voltage signal to the driver of the laser diode. A synchronized TTL signal is sent to the lock-in amplifier and serves as the reference signal. The laser diode emits a modulated light beam that is focused on the sample. A shutter is used to block the laser in order to measure the background noise. The modulated light is absorbed by the sample, causing the emission of PA waves, which are detected by the ultrasound transducer. The output voltage signal from the transducer is amplified, filtered, and sent to the lock-in amplifier.
Fig. 2.
Schematic of the modulation circuit used in our setup. The function generator provides DC and AC power to the circuit. The resistor and the potentiometer are chosen to provide a modulated current within the current range of the laser diode. The photodiode detector and oscilloscope are used to verify the modulation.
Figure 2 shows the principle of the modulation circuit. By generating an AC signal with a DC offset, the FG can serve as a DC and AC power source. A resistor (R1) and a potentiometer are used to limit and control the current flowing into the laser diode, respectively. The laser diode has a typical threshold current of 35 mA. The DC offset of the FG is VDC = 2 V and the AC peak-to-peak is VAC = 4 V. The total resistance of R1 and the potentiometer is about 11 Ω. A photodiode (EOT, ET-2030A) is used to verify the modulation of the laser intensity via an oscilloscope (2530B Digital Storage Oscilloscope, BK Precision).
B. Data processing
It is common that the LIA shows a background signal even when the laser is turned off or blocked. This background signal is mainly caused by electronic interference from the driving signal generated by the FG. Fortunately, this background signal is independent of the location of the UST or the sample. A simple way to eliminate the effect of this background signal is to mathematically subtract it from the measured PA signal. Figure 3 schematically shows the relationship between the three signals, based on the amplitude and the phase measured with the LIA: (1) the measured signal, (2) the background signal, and (3) the PA signal. The angle between the vector representing each signal and the horizontal axis is the phase. The PA signal, vector (3) in Fig. 3, is the difference between the measured signal and the background signal. The magnitude of the PA signal is correlated with the optical absorption coefficient of the sample. All the calculations, image processing, and plotting were carried out using MATLAB (Mathworks), which is commonly used in engineering laboratories. Other software packages, such as MathCAD, can be used as alternatives.
Fig. 3.
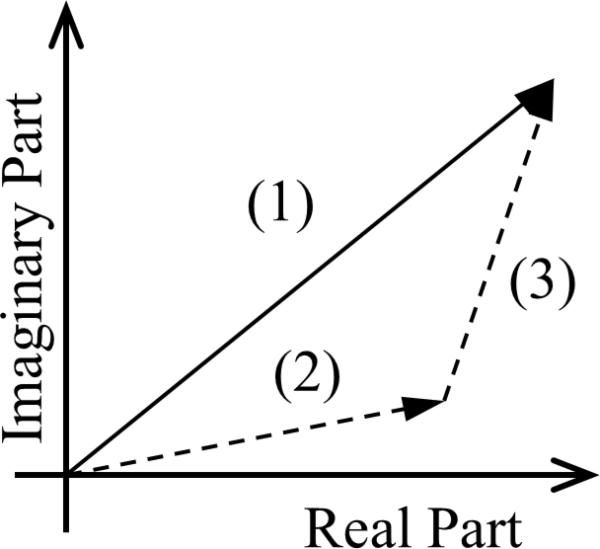
The relation between the measured signal (vector 1), the background (vector 2), and PA (vector 3) signals.
IV. RESULTS AND DISCUSSIONS
Before the PA measurements, the laser beam was positioned to be coaxial with the UST. The tank was filled with a 1% intralipid solution to simulate biological tissues. The absorption and scattering coefficients of the intralipid solution are 0.04 cm−1 and 8.4 cm−1, respectively, as measured with an ISS Oximeter. The tube was filled with an ICG aqueous solution, with a concentration of 0.5 grams/liter, to simulate an absorbing target. ICG is a relatively weak fluorophore in the near infrared range with a quantum yield of <~1% in aqueous media(20) and has been used as an optical absorber for PA imaging.(21) The laser diode and the UST were mounted on the same translation stage and their relative position was thus fixed. By moving the translation stage, the PA signal distributions along the x axis and in the x-y plane were acquired. Although the co-axial setup between the laser beam and the UST is not required, it improves the signal-to-noise ratio.
Figure 4 shows the strength of measured PA signal as a function of the horizontal position of the tube relative to the axis of the laser beam and the UST. The dashed and solid vertical lines represent the inner and outer diameter of the tube, respectively. Clearly, the strength of the PA signals rise when the laser beam gradually moves into the tube region and fall when the laser beam moves away from the tube region. These results indicate that the highly absorbing ICG tube generates significant PA signals compared to the surrounding intralipid solution that has a much lower absorption coefficient. The FWHM of the PA data using the 1 MHz UST, shown in Fig. 4, is about 2.2 mm. It is larger than the inner diameter of the tube (1.7 mm) and the UST lateral size (1.3 mm) since the FWHM is mainly determined by the convolution of the profiles of the cross section of the tube and the lateral focal zone of the UST.
Fig. 4.
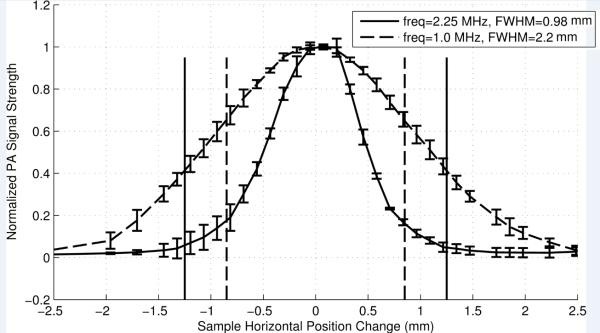
The normalized PA signal strength as a function of the horizontal position of the sample relative to the co-axis of the laser beam and the UST. The data were obtained with a 1 MHz (dashed curve) and a 2.25 MHz (solid curve) UST. The dashed vertical lines show the inner diameters and the solid vertical lines show the outer diameters of the phantom tube that is filled with 0.5 g/L ICG solution at a depth of 1.9 mm in a 1% intralipid solution. The diameter of the collimated laser beam is ~1.0 mm. The error bars represent the standard deviation of 4 measurements.
When the frequency of the UST is increased from 1 to 2.25 MHz, the FWHM of the UST's lateral focal zone is reduced from ~1.3 to ~0.72 mm. The PA spatial resolution can be thus improved by using a higher frequency UST. Figure 4 shows that the FWHM of the PA signal measured with the 2.25 MHz UST is 0.98 mm which is smaller than the 2.2 mm width measured with the 1 MHz UST. However, the width is smaller than the tube size and the reason is unclear. One possible reason may be that the PA signal generated from regions close to the edge of the tube is too weak to be detected. Higher frequencies provide smaller focal sizes and higher spatial resolution. A UST with a central frequency between 1 and 10 MHz achieves an acceptable spatial resolution. At frequencies below 1 MHz, the resolution will be degraded. Frequencies above 10 MHz will also work but increases the cost and the complexity of the system.
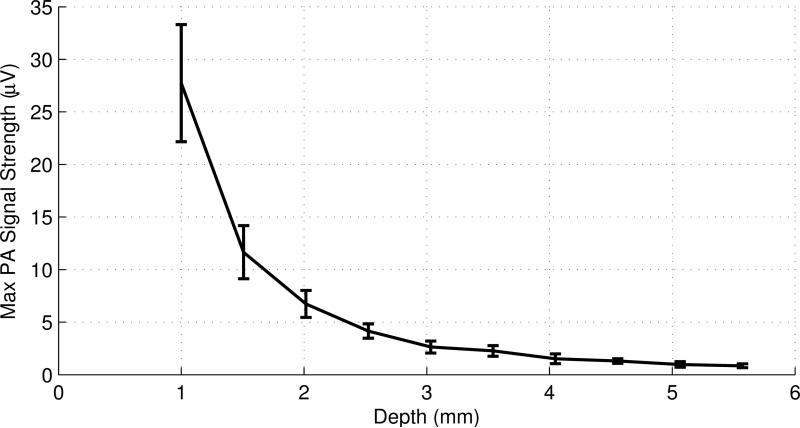
When the distance between the left-side of the tank wall and the left outer surface of the tube, defined as the depth of the tube, increases, the strength of the PA signal decreases. This is a consequence of the reduction in the light intensity reaching the sample due to the scattering in the medium. The dependence of the strength of the PA signal on the thickness or depth of the medium is shown in Fig. 5.
Fig. 5.
The maximum PA signal strength as a function of the tube depth acquired with a 2.25 MHz UST in a 1% intralipid solution. The diameter of the laser beam is ~1.0 mm and the ICG concentration is 0.5 g/L. The error bars represent the standard deviation of 4 measurements.
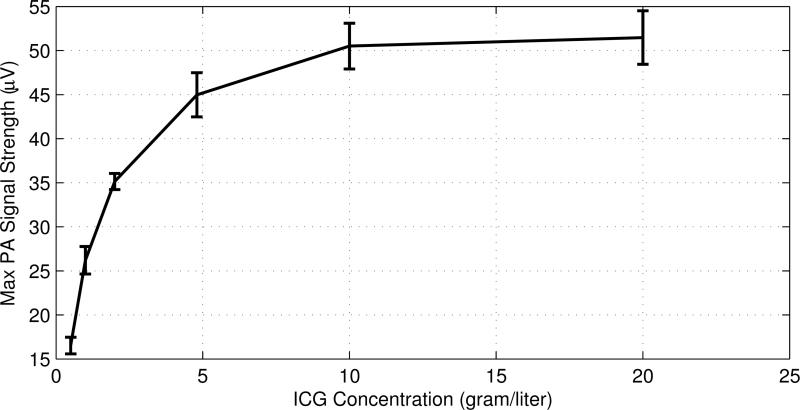
Increasing the ICG concentration increases the absorption coefficient of the tube, which raises the PA signal strength. Figure 6 shows the peak strength of the PA signal as a function of the ICG concentration. The PA signal strength increases when the concentration is increased but appears to saturate at high ICG concentrations. This may indicate that the light cannot penetrate into a highly concentrated ICG solution due to the large absorption coefficient, suggesting that the light absorption is confined to a limited region of the ICG solution.
Fig. 6.
The maximum PA signal strength as a function of the ICG concentration acquired with a 2.25 MHz UST in a 1% intralipid solution at a depth of 1.9 mm. The diameter of the collimated laser beam is ~1.0 mm. The error bars represent the standard deviation of 5 measurements.
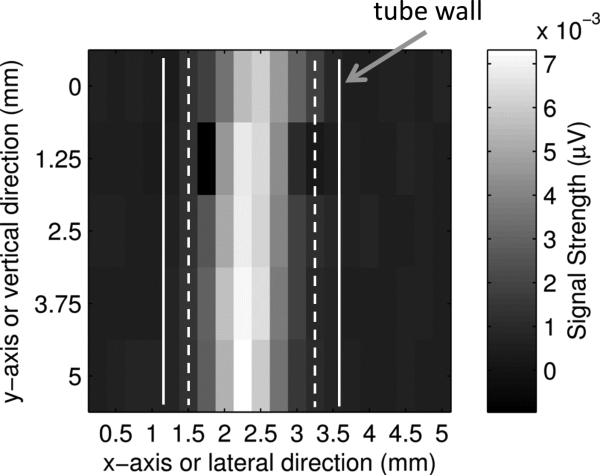
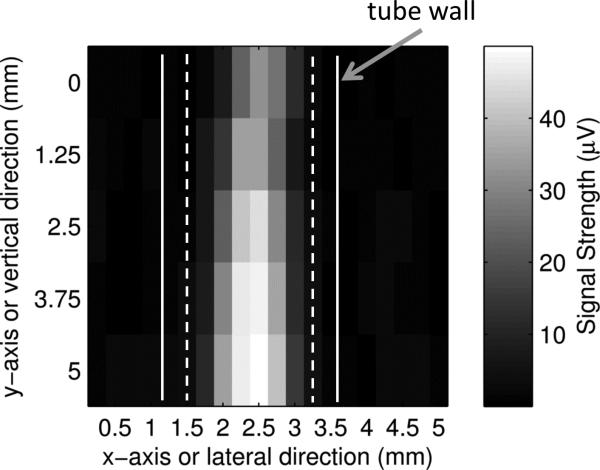
Figures 7(a) and (b) show two-dimensional (2D) ultrasound and PA images of the tube in the x-y plane (C-mode, see Fig. 7(d) for the coordinates and the imaging plane). The ultrasound image was obtained with the same UST using the conventional pulse-echo method. The UST was connected to a pulse-generator-receiver (5073PR pulser/receiver, Olympus) and the reflected ultrasound data was acquired with the oscilloscope. The UST was raster scanned in the x-y plane. The laser was turned off because it is not used in ultrasound imaging. The reflected ultrasound echo signal at each location, also called the A-line, included the acoustic information along the z direction. After scanning the x-y plane, all A-lines can be used to construct a 3D image of the tube. Fig. 7(a) shows a 2D image in the x-y plane, the so-called a C-mode ultrasound image, at a depth indicated by the white line in Fig. 7(c). Fig. 7(c) shows a 2D image in the x-z plane, the so-called a B-mode ultrasound image, representing the cross section of the tube. The PA image shown in Fig. 7(b) was obtained with the system described in Fig. 1. This system does not have the capability to resolve the PA signal along z direction because the laser diode is continuously modulated. This is one disadvantage of the PA technique compared with the time-domain method. Therefore, only a 2D image in the x-y plane is shown in Fig. 7(b).
Fig. 7.
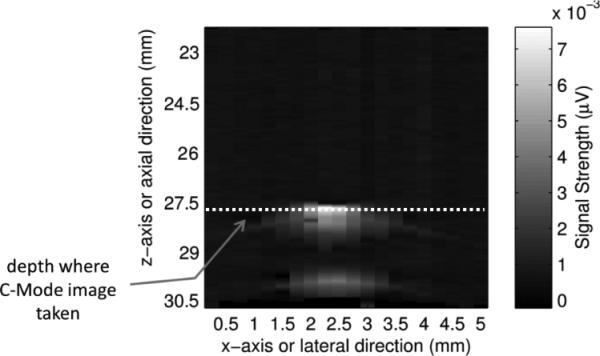
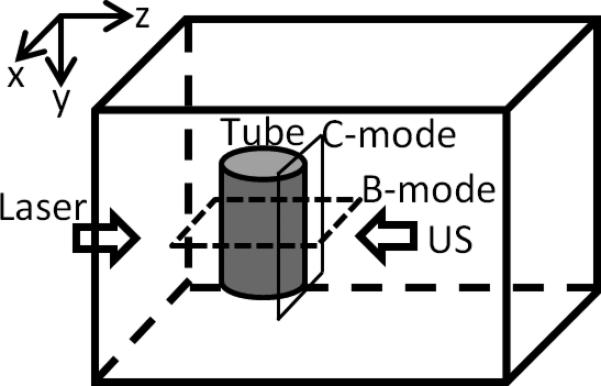
(a). A C-mode ultrasound image and (b) a C-mode PA image of the ICG filled tube. The UST frequency is 2.25 MHz, the ICG concentration is 2 g/L, and the intralipid concentration is 1%. (c). An ultrasound B-mode image showing the cross section of the same ICG filled tube. The white dotted line indicates the depth of the C-mode images in (a) and (b). Note that the depth of zero in this Figure is the surface of the UST, which is different from the definition of the tube depth). (d) A diagram to show the B-mode and C-mode imaging planes. The B-mode image is parallel to the x-z plane and the C-mode is parallel to the x-y plane (close to the right-side edge of the tube).
The data points shown in Figs. 7(a) and 7(b) were obtained by raster scanning the UST/laser system in the x-y plane. The step sizes in the lateral (x) direction and in the vertical (z) direction were 0.5 mm and 1.25 mm, respectively. Each rectangle represents the intensity of a single measurement. The two solid and dashed white vertical lines represent the outer and inner diameter of the tube, respectively. The average FWHM of the ultrasound image shown in Fig. 7(a) is about 0.98 mm, which is smaller than the inner diameter of the tube. Figure 7(b) shows the corresponding PA image in the x-y plane. The image clearly shows the tube with optical (absorption) contrast. The average FWHM is about 0.88 mm, which is also smaller than the inner diameter of the tube for reasons that are not clear.
Figure 7(c) shows the ultrasound image of the cross-section of the tube. To be consistent with conventional ultrasound imaging rules, zero depth in Fig. 7(c) is defined as the surface of the UST because that is the location where the ultrasound pulses are generated; note that this is different from the definition of the tube depth. The two bright areas show the two boundaries of the tube. Note that the inner boundaries of the tube cannot be resolved from this image due to the limited resolution of the UST (2.25 MHz). The dotted horizontal line in Fig. 7(c) indicates the depth of the ultrasound C-mode image shown in Fig. 7(a). Clearly, the ultrasound image shows the boundaries between the tube and the surrounding medium.
V. COST AND COMPACTNESS ANALYSES
Table 1 shows the general costs, features, and possible substitutes of the major components of the current PA system. The cost of the system is dominated by the cost of the LIA and the FG although lower cost LIAs and FGs could be adopted. Clearly, the cost of a FD-PA imaging system is much less expensive than that of a time-domain imaging system. The cost of the MATLAB software is not included in Table 1. A student version of MATLAB is relatively cheap but other free or relatively inexpensive software packages can be used as alternatives. All components of the FD-PA system are compact. Although we have not attempted to reduce the overall size of our setup in the current study, it is possible to integrate the entire system into a small and portable box by replacing the FG and LIA with a small, customized circuit board. It will be extremely difficult for a time-domain PA system to achieve the same compactness.
Table 1.
The major components of the PA system and their features, costs, and possible substitutes. The listed prices are for guidance only.
| Item | Model | Feature | Cost (USD) | Substitutes |
|---|---|---|---|---|
| Lock-in Amplifier | SRS 844 | Broadband 200 MHz | ~$8,000 | Regular LIA, <$2,000 |
| Function Generator | Agilent 33120A | Multiple function and 20 MHz bandwidth | ~$1600 | Regular FG, <$1,000 |
| Focused ultrasound transducer | Olympus-NDT V314-SU-F | Point focused, NA=0.375 | ~$350 | Other focused USTs with a central frequency between 1 and 10 MHz and reasonable sensitivity |
| Laser diode | Thorlabs L785P100 | 785 nm and 100 mw CW | ~$40 | Other laser diodes with power ~100 mw |
| RF amplifiers (2×) | Minicircuits ZFL-1000LN | Wideband, 0.1-1000 MHz | ~$178 (2× at $89 each) | Other RF amplifiers with a gain ~40 dB |
| Low pass filter (not required) | Minicircuits SLP-5+ | Cutoff at 5 MHz | ~$35 | Other Low pass filters with an appropriate cutoff frequency |
VI. CONCLUSIONS
A FD-PA imaging system was designed and its imaging capability was demonstrated with tissue-like phantoms. The imaging principle and data processing method were discussed. The measured PA signal strength depends on the absorption coefficient, the depth of the target, and the modulated light intensity of the laser diode. Appropriate processing of the measured PA data and background interference is an important key to correctly display the PA images. The lateral spatial resolution of PA images is dependent on the ultrasound frequencies and focal sizes of the ultrasound transducers. Although the current system has a low axial resolution due to the adopted ultrasound transducer, it can be significantly improved by using a high numerical aperture ultrasound transducer or by adopting a frequency-swept technique.(9) The FD-PA imaging system is cost effective compared to a time-domain imaging system.
ACKNOWLEDGEMENTS
We acknowledge the funding support from DOD (W81XH-11-1-0231) and partially from NIH (7R15EB012312-02), CPRIT (RP120052), NSF (CBET-1253199) and seed grant of Research Enhancement Program from the University of Texas at Arlington.
References
- 1.Corlu A, Choe R, Durduran T, Rosen MA, Schweiger M, Arridge SR, Schnall MD, Yodh AG. Three-dimensional in vivo fluorescence diffuse optical tomography of breast cancer in humans. Opt. Express. 2007;15:6696–6716. doi: 10.1364/oe.15.006696. [DOI] [PubMed] [Google Scholar]
- 2.Culver J, Akers W, Achilefu S. Multimodality molecular imaging with combined optical and SPECT/PET modalities. J Nucl Med. 2008;49:169–172. doi: 10.2967/jnumed.107.043331. [DOI] [PubMed] [Google Scholar]
- 3.McDonald DM, Choyke PL. Imaging of angiogenesis: from microscope to clinic. Nature Medicine. 2003;9:713–725. doi: 10.1038/nm0603-713. [DOI] [PubMed] [Google Scholar]
- 4.Wang LV. Multiscale photoacoustic microscopy and computed tomography. Nature Photonics. 2009;3:503–509. doi: 10.1038/nphoton.2009.157. [DOI] [PMC free article] [PubMed] [Google Scholar]
- 5.Wang LHV. Ultrasound-mediated biophotonic imaging: A review of acousto-optical tomography and photo-acoustic tomography. Disease Markers. 2003;19:123–138. doi: 10.1155/2004/478079. [DOI] [PMC free article] [PubMed] [Google Scholar]
- 6.Xu M, Wang L. Photoacoustic imaging in biomedicine. Review of Scientific Instruments. 2006;77:041101. [Google Scholar]
- 7.Maslov K, Wang LV. Photoacoustic imaging of biological tissue with intensity-modulated continuous-wave laser. J Biomed Opt. 2008;13 doi: 10.1117/1.2904965. [DOI] [PubMed] [Google Scholar]
- 8.Euler M. Hands-on resonance-enhanced photoacoustic detection. The Physics Teacher. 2001;39:406–409. [Google Scholar]
- 9.Telenkov S, Mandelis A, Lashkari B, Forcht M. Frequency-domain photothermoacoustics: Alternative imaging modality of biological tissues. Journal of Applied Physics. 2009;105 [Google Scholar]
- 10.Rush WF, Heubler j. E. Photoacoustic effect demonstration. American Journal of Physics. 1982;50:669–669. [Google Scholar]
- 11.Euler M, Niemann K, Muller A. Hearing Light. The Physics Teacher. 2000;38:356–358. [Google Scholar]
- 12.Temple PA. An introduction to phase sensitive amplifiers: An inexpensive student instrument. American Journal of Physics. 1975;43:801–807. [Google Scholar]
- 13.Wolfson R. The lock-in amplifier: A student experiment. American Journal of Physics. 1991;59:569–572. [Google Scholar]
- 14.Scofield JH. Frequency-domain description of a lock-in amplifier. American Journal of Physics. 1994;62:129–133. [Google Scholar]
- 15.Sengupta SK, Farnham JM, Whitten JE. A simple low-cost lock-in amplifier for the laboratory. Journal of Chemical Education. 2005;82:1399–1401. [Google Scholar]
- 16.Edmondson K, Agoston S, Ranganathan R. Impurity level lifetime measurements using a lock-in amplifier. American Journal of Physics. 1996;64:787–791. [Google Scholar]
- 17.McDonald FA. Photoacoustic effect and the physics of waves. American Journal of Physics. 1980;48:41–47. [Google Scholar]
- 18.Khan MI, Sun T, Diebold GJ. Photoacoustic waves generated by absorption of laser radiation in optically thin cylinders. Journal of the Acoustical Society of America. 1993;94:931–940. [Google Scholar]
- 19.Wang L. In Photoacoustic Imaging and Spectroscopy. CRC Press; 2009. [Google Scholar]
- 20.Russin TJ, Altinoglu EI, Adair JH, Eklund PC. Measuring the fluorescent quantum efficiency of indocyanine green encapsulated in nanocomposite particulates. Journal of Physics- Condensed Matter. 2010;22 doi: 10.1088/0953-8984/22/33/334217. [DOI] [PubMed] [Google Scholar]
- 21.Kim C, Favazza C, Wang LHV. In Vivo Photoacoustic Tomography of Chemicals: High-Resolution Functional and Molecular Optical Imaging at New Depths. Chem. Rev. 2010;110:2756–2782. doi: 10.1021/cr900266s. [DOI] [PMC free article] [PubMed] [Google Scholar]


