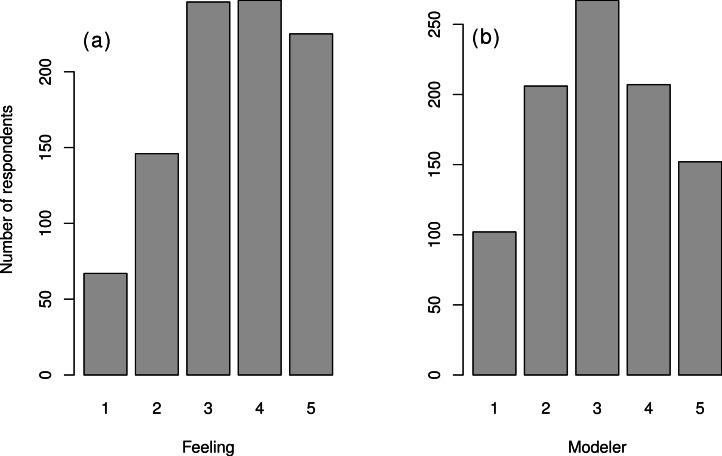
Figure 2. Distribution of variables quantifying attitudes towards mathematics.
(A) Distribution of “Feeling” variable (from 1: “really dislike” mathematics to 5: “really like”) and (B) Distribution of “Modeler” variable (1: “do not model” to 5: “specialist modeler”). See Fig. S2 for correlation between these two variables.

