

Abstract
Single nucleotide polymorphisms (SNPs) have become the marker of choice for genome-wide association studies in many species. High-throughput sequencing of RNA was developed primarily to analyze global gene expression, while it is an efficient way to discover SNPs from the expressed genes. In this study, we conducted transcriptome sequencing of the swimbladder of Takifugu rubripes using Illumina HiSeq2000 platform to identify gene-associated SNPs in the swimbladder. A total of 30,312,181 unique-mapped-reads were obtained from 44,736,850 raw reads. A total of 62,270 putative SNPs were discovered, which were located in 11,306 expressed genes and 2,246 scaffolds. The average minor allele frequency (MAF) of the SNPs was 0.26. GO and KEGG pathway analysis were conducted to analyze the genes containing SNPs. Validation of selected SNPs revealed that 54% of SNPs (26/48) were true SNPs. The results suggest that RNA-Seq is an efficient and cost-effective approach to discover gene-associated SNPs. In this study, a large number of SNPs were identified and these data will be useful resources for population genetic study, evolution analysis, resource assessment, genetic linkage analysis and genome-wide association studies.
Introduction
Next-generation sequencing-based RNA-Seq analyses have dramatically changed the way to investigate the functional complexity of transcriptome in many organisms [1], [2]. RNA-Seq approach is powerful for unraveling transcriptome complexity, identification of genes, gene-associated markers, regulatory non-coding RNAs and for alternative splicing analysis and expression profiling [3]–[5]. Transcriptome analysis using the next generation sequencing technologies have been widely reported in many species, including several aquaculture species such as catfish [6]–[8], Atlantic cod [9], silver carp [10], pearl oyster [11], carp [12], and Amur ide [13].
Recently, RNA-Seq has also been used as an efficient and cost-effective method to comprehensively identify SNPs from transcribed regions in the genomes of several fish species. By sequencing of the pooled RNA samples from multiple individuals of channel catfish and blue catfish, a set of quality SNPs were identified including 342,104 intra-specific SNPs for channel catfish, 366,269 intra-specific SNPs for blue catfish, and 420,727 inter-specific SNPs between channel catfish and blue catfish [6]. Similarly in carp, a total of 712,042 intra-stain SNPs were discovered in four strains, including mirror carp (483,276 SNPs), purse red carp (486, 629SNPs), Xingguo red carp (478,028 SNPs), and Yellow River carp (488,281 SNPs) [14]. Large sets of SNPs have also been reported in some other aquaculture species, such as the Eastern oyster [15], Atlantic salmon [16], Atlantic cod [9] and rainbow trout [17].
Takifugu rubripes, widely distributed in the Asia, is one of the most important aquaculture species in China. In our laboratory, some SNPs makers associated with growth traits have been identified from the growth-related genes including Leptin, Melanocortin 4 Receptor (MC4R), Insulin-like growth factor (IGF), Myogenic factor 5 (Myf5), Growth hormone releasing hormone (GHRH), Myogenic factor 6 (Myf6) [18]. Other genetic and genomic studies were also conducted with the focus on identification and characterization of microsatellite markers [19], [20], construction of bacterial artificial chromosome (BAC) and expressed sequence tag (EST) library [21]. In addition to its importance in aquaculture, T. rubripes is also widely used as a model system in many scientific fields, especially in the evolutionary studies. The fugu genome has been completed, which is among the smallest vertebrate genomes. It has proven to be a useful ‘reference’ genome for identifying genes and other functional elements in human and other vertebrate genomes, and for understanding the structure and evolution of vertebrate genomes [22]–[24].
The swimbladder in teleost fish is a specialized organ that regulates buoyancy. The homology of the fish swimbladder and mammalian lung has been well recognized based on morphological and embryological evidence. However, the molecular evidence of homology of swimbladder and the mammalian lung was not sufficient [25]–[27]. A large set of SNPs from the swimbladder transcriptome of T. rubripes should provide valuable resources for swimbladder research, lung research and evolution studies of fish swimbladder and mammalian lung.
In this study, we sequenced the transcriptome of the swimbladder of T. rubripes using Illumina HisSeq2000 platform to identify gene-associated SNPs. A total of 62,270 putative SNPs were discovered, which were located in 11,430 genes and 1,612 scaffolds, and the average minor allele frequency (MAF) was 0.26. These SNPs should provide useful resources for evolution, population genetic study, resource assessment, genetic linkage analysis and genome-wide association studies.
Results and Discussion
Transcriptome sequencing
Illumina sequencing was conducted to generate short sequence reads from the swimbladder of T. rubripes. A total of 30,312,181 unique-mapped-reads were obtained from 44,736,850 raw reads after being mapped to the fugu T. rubripes fifth genome assembly from Ensembl database. The genome distribution of the uniquely mapped reads was assessed based on the RefSeq-defined gene models. As expected, the majority of reads (60%) were mapped onto exonic regions, while a large propotion of reads were mapped onto intergenic regions (Table 1). Similar observations have been reported in the studies of mouse and Caenorhabditis elegans [28], [29]. The RNA-Seq data in this study has been deposited in the NCBI SRA database with the accession number of SRR1022677.
Table 1. The genome distribution of the mapped reads.
| Read distribution | Number of reads | Percentage |
| Exonic region | 18,120,867 | 59.78% |
| Intergenic region | 9,776,865 | 32.25% |
| Intronic region | 1,435,258 | 4.73% |
| Exon-intron junction | 176,167 | 0.58% |
SNP identification
Compared with the fugu genome, a total of 62,270 putative SNPs were identified. The detailed SNP information was provided in Table S1. Of which, the number of homozygotes was 9,518 and the number of heterozygotes was 52,752. In these heterozygotes, the C/T and A/G were the most common types. In contrast, G/T, A/C, G/C and A/T were the lease common types (Table 2).
Table 2. Summary of SNP types identified from the T. rubirpes swimbladder.
| SNP type | Number |
| Homozygote | |
| A | 1,887 |
| C | 2,914 |
| G | 2,887 |
| T | 1,830 |
| Heterozygote | |
| G/T | 4,730 |
| A/C | 4,725 |
| A/G | 16,972 |
| G/C | 4,665 |
| A/T | 4,586 |
| C/T | 17,074 |
| Total | 62,270 |
The SNPs were classified into several categories based on their locations in the genome, including inter-genic, down_stream (+1k), exon, intron, and up_stream (−1 k). As shown in Table 3, of the 62,270 putative SNPs, 24,525 SNPs (39.38%) were identified in exons, which were highly represented, while 4,210 SNPs (6.76%) were identified in the introns, which were lowly represented.
Table 3. Classification of putative SNPs.
| SNP classification | Number of putative SNPs |
| Inter-genic | 12,903 |
| Down_stream(+1 k) | 12,303 |
| Exon | 24,525 |
| Intron | 4,210 |
| Up_stream(−1 k) | 8,329 |
| Total | 62,270 |
Inter-genic SNPs were identified from regions between genes, while Down_stream(+1 k) and Up_stream(−1 k) represents SNPs identified from regions of 1 kb downstream and upstream of the genes.
Minor allele frequency distribution
Minor allele frequency (MAF) is an important factor for SNP locus evaluation. MAFs of SNPs were calculated from the sequence data. As shown in Figure 1, the majority of SNPs have sequence derived minor allele frequencies ranging from 21% to 25%, and the average MAF was 26% in putative SNPs identified from the swimbladder of T. rubripes.
Figure 1. Distribution of minor allele frequencies (MAFs) of SNPs identified from the T. rubirpes swimbladder.
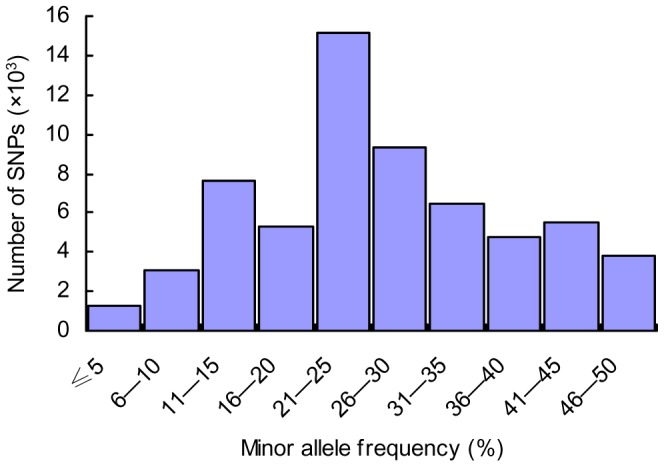
The X-axis represents the SNP minor allele frequency in percentage, while the Y-axis represents the number of SNPs with given minor allele frequency
SNP distribution among genes and scaffolds
SNPs distribution is important for consideration of coverage when using SNP makers. The distribution of SNPs in the genes was analyzed. Expressed short reads were mapped to a total of 17,249 genes based on the fifth fugu T. rubripes genome assembly from Ensembl database. On average, 3.6 SNPs per gene were identified. A total of 11,306 expressed genes containing SNPs were identified in the swimbladder with the cutoff values of PRKM setting as 0.08. As shown in Figure 2, of these genes, 56.73% had fewer than 5 SNPs per gene. The number of genes with 26–30 SNPs per gene is 40 and there are 30 genes harboring more than 30 SNPs per gene. For instance, the dystonin (ENSTRUG00000015507) and annexin A5 (ENSTRUG00000015464) have relatively large numbers of SNPs per gene, 73 and 63 SNPs, respectively. The fugu genome assembly (version 5.0) is composed of 7,119 scaffolds. The SNPs identified in the present study were found on the 2,246 scaffolds, about 27.7 SNPs per scaffold. As shown in Figure 3, a large number of scaffolds had fewer than 10 SNPs per scaffold. The scaffold_1 and scaffold_6 had the largest number of SNPs, 1,631 and 1,293 SNPs, respectively.
Figure 2. SNP distribution among genes.
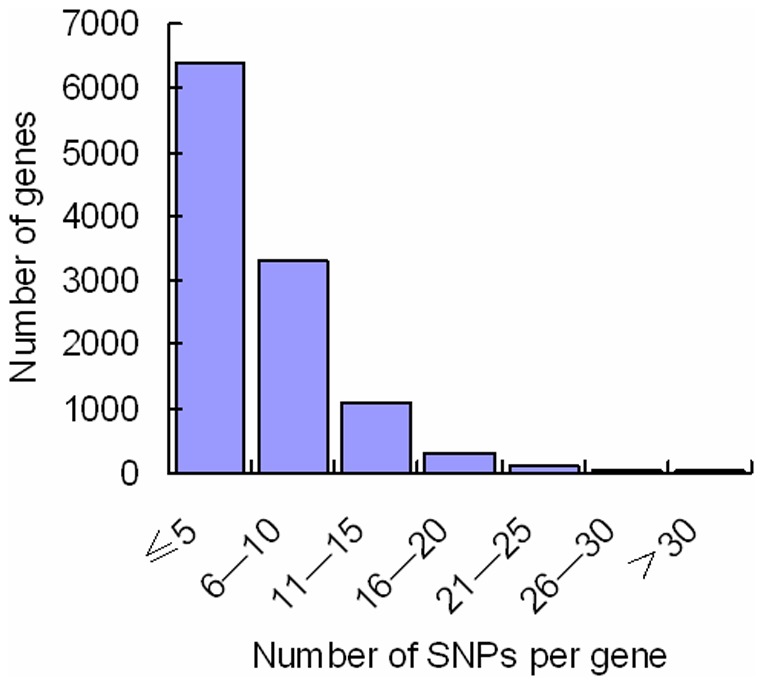
The X-axis represents gene size (number of SNPs per gene)
Figure 3. SNP distribution among scaffolds.
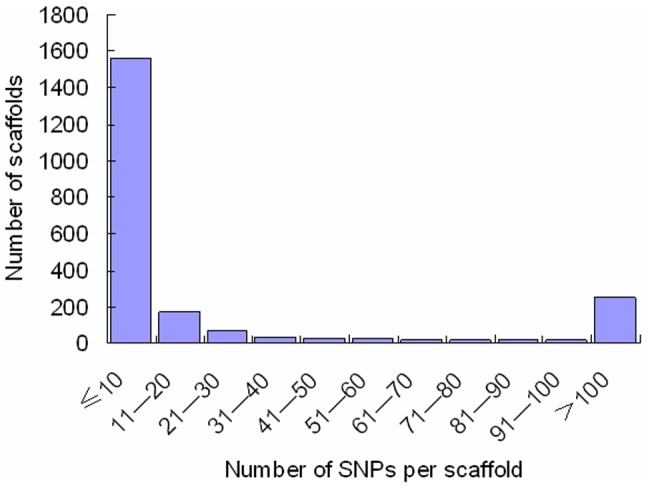
The X-axis represents scaffold size (number of SNPs per scaffold)
Gene Ontology and KEGG pathway analysis
Gene Ontology (GO) annotation was further performed for the annotated genes in terms of biological process, molecular function and cellular component. Distribution of the genes in different GO categories at level 2 is shown in Figure 4. In the swimbladder, 8,922 expressed genes containing SNPs were assigned with one or more GO terms for biological process, molecular function and cellular component. For biological process, genes involved in the metabolic process and cellular process were highly represented. For molecular function, binding was the most represented GO term, followed by catalytic activity. Regarding to the cellular component, the major categories were cell and cell part. The GO categories of expressed genes containing SNPs were in the same proportion to the GO categories of all the expressed genes (Figure 4).
Figure 4. Gene Ontology of genes containing putative SNPs.

Besides GO analysis, KEGG pathway analysis was also carried out for the annotated genes, which is an alternative approach to categorize gene functions with the focus on biochemical pathways. A total of 3,808 expressed genes were assigned with one or more KEGG annotation and were mapped to KEGG pathways (Table 4). Of these annotated genes, 28.06% were classified into the Organismal Systems with the majority of which involved in immune system. Metabolism pathways including carbohydrate metabolism, amino acid metabolism and lipid metabolism represented 25.66%. Environmental information processing represented 19.41%. The signal transduction was one of the well-represented sub-pathways. In addition, 9.15% and 17.72% were classified into the Genetic information processing and Cellular Processes, respectively.
Table 4. KEGG biochemical mappings for genes containing SNPs.
| KEGG categories | Number of genes |
| Metabolism | |
| Amino Acid Metabolism | 344 |
| Biosynthesis of Polyketides and Nonribosomal Peptides | 4 |
| Biosynthesis of Secondary Metabolites | 69 |
| Carbohydrate Metabolism | 422 |
| Energy Metabolism | 162 |
| Glycan Biosynthesis and Metabolism | 150 |
| Lipid Metabolism | 331 |
| Metabolism of Cofactors and Vitamins | 130 |
| Metabolism of Other Amino Acids | 103 |
| Nucleotide Metabolism | 239 |
| Xenobiotics Biodegradation and Metabolism | 118 |
| Genetic Information Processing | |
| Folding, Sorting and Degradation | 266 |
| Replication and Repair | 161 |
| Transcription | 196 |
| Translation | 116 |
| Environmental Information Processing | |
| Membrane Transport | 39 |
| Signal Transduction | 1142 |
| Signaling Molecules and Interaction | 386 |
| Cellular Processes | |
| Behavior | 28 |
| Cell Communication | 522 |
| Cell Growth and Death | 365 |
| Cell Motility | 200 |
| Transport and Catabolism | 316 |
| Organismal System | |
| Circulatory System | 138 |
| Development | 187 |
| Endocrine System | 544 |
| Immune System | 1116 |
| Nervous System | 246 |
| Sensory System | 35 |
Homologous genes containing SNPs between fugu swimbladder and human lung
In this study, our KEGG pathway analysis indicated the tight junction existed, including 141 expressed genes containing SNPs. Tight junction is essential for epithelial morphology and function of swimbladder. Tight junctions serve to form seals among epithelial cells, creating a selectively permeable barrier to intercellular diffusion [27]. Claudins are transmembrane proteins which act in concert with other transmembrane and peripheral proteins to form the physical basis for tight junction [27], [30]. In previous studies, claudin 4/5/6/7/9 genes were identified in the swimbladder of zebrafish [27] and 46 claudin genes in the fugu genome were identified and their phylogenetic relationships to those counterparts in mammals was determined [31]. In this study, 16 members of claudin family were identified (Table 5). Three of the 16 claudin genes were highly expressed, including claudin 5a, 5b and 7d. In the human airway, claudin 1, 3, 4, 5 and 7 are expressed in both bronchi and bronchioles. Claudin 5 is localized exclusively in the apical-most region of the tight junctions. Altered Claudin expression pattern can change the paracellular permeability characteristics of the epithelium. Claudin 5 overexpression increases the solute permeability [32], [33]. Genome wide association studies showed the polymorphisms rs9290927, rs893051 and rs17501010 from clandin 1 were associated with nickel contact sensitization in individuals without ear piercings, contact sensitization to fragrances, and with both organic compounds and nickel contact dermatitis in human, respectively [34]. The genetic variants in regulatory regions of clandin 1 can alter susceptibility to HCV infection [35].
Table 5. Identification of expressed Claudin genes containing SNPs.
| Ensembl Gene ID | Gene name | RPKM value | Number of SNPs |
| ENSTRUG00000018609 | Claudin 5b | 234.65 | 5 |
| ENSTRUG00000016497 | Claudin 5a | 75.65 | 5 |
| ENSTRUG00000007521 | Claudin 7a | 43.24 | 6 |
| ENSTRUG00000010140 | Claudin 30c | 14.33 | 3 |
| ENSTRUG00000004991 | Claudin 12 | 8.98 | 6 |
| ENSTRUG00000011829 | Claudin 11a | 6.15 | 4 |
| ENSTRUG00000015308 | Claudin 15a | 3.81 | 1 |
| ENSTRUG00000003031 | Claudin 25 | 2.89 | 2 |
| ENSTRUG00000010901 | Claudin 23 | 1.83 | 4 |
| ENSTRUG00000001287 | Claudin 19 | 1.63 | 4 |
| ENSTRUG00000013204 | Claudin 18 | 1.21 | 2 |
| ENSTRUG00000007366 | Claudin 32a | 0.78 | 3 |
| ENSTRUG00000011741 | Claudin 31 | 0.76 | 2 |
| ENSTRUG00000009832 | Claudin 28b | 0.31 | 1 |
| ENSTRUG00000016459 | Claudin 15b | 0.21 | 2 |
| ENSTRUG00000010378 | Claudin 23b | 0.14 | 1 |
In this study, 8 Wnt genes containing SNPs were identified and the expression levels of wnt 7b, wnt 5a and wnt 11 are higher (Table 6). Wnt signaling pathway has been reported to play important roles in mammalian lung development [36]–[38]. In previous studies, the down-regulation of Wnt signaling leading to defective swimbladder development in zebrafish was observed [39]. Wnt7b is expressed in the distal airway epithelium of lungs and plays critical roles in lung development such as distal epithelial cell fate decision, lung mesenchymal proliferation and smooth muscle differentiation [38], [40]–[43]. It was found that wnt5a is expressed in lung epithelium [38], [44]. Wnt11 plays important roles in mouse lung development [38], [45], [46]. In chicken, 124 SNPs from 31 genes of Wnt signaling pathway were selected to genotype in 764 individuals resulted in 102 polymorphic SNPs [47]. In human, 14 SNPs from six Wnt pathway-related genes were genotyped in 210 individuals (145 men and 65 women), including Dickkopf 2 (DKK2) (rs17037102, rs419558, and rs447372), DKK3 (rs3206824, rs11022095, rs1472189, rs7396187, and rs2291599), DKK4 (rs2073664), sFRP4 (rs1802073 and rs1802074), SMAD7 (rs12953717), and DAAM2 (rs6937133 and rs2504106) [48]. Six common SNPs of Wnt10b were identified in a sample of 1,029 Korean female subjects, which were in almost complete linkage disequilibrium [49].
Table 6. Identification of expressed Wnt genes containing SNPs.
| Ensembl Gene ID | Gene name | RPKM value | Number of SNPs |
| ENSTRUG00000016453 | Wnt 7b | 48.59 | 1 |
| ENSTRUG00000001530 | Wnt 11 | 29.03 | 8 |
| ENSTRUG00000008614 | Wnt 5a | 28.52 | 7 |
| ENSTRUG00000000172 | Wnt 4 | 16.51 | 4 |
| ENSTRUG00000003640 | Wnt 6 | 11.5 | 14 |
| ENSTRUG00000016522 | Wnt 5b | 1.71 | 2 |
| ENSTRUG00000014284 | Wnt 9b | 1.38 | 3 |
| ENSTRUG00000012568 | Wnt 2b | 0.33 | 1 |
We observed the expression of two homologues of Ihh (ENSTRUG00000012233 and ENSTRUG00000013525) and Ptc1 (ENSTRUG00000014514) containing SNPs from the swimbladder transcriptome. The role of Hh (Hedgehog) signaling pathway in lung development is very crucial in human, mouse, chicken and Xenopus laevis [38], [50]–[53]. Some development-related genes in lung had been identified in zebrafish, such as Sonic Hedgehog (Shh)-related gene, Indian Hedgehog (Ihh)-related gene and their receptors, Patched 1(Ptc 1) and Ptc2 [54]-[61]. The human sonic hedgehog (SHH) gene is located in the 7q36 region, which is known to play an important role in embryo patterning, lung development and connection with sexual orientation. A SNP site (rs9333613) was found to be associated with male sexual orientation [62]. Ihh is a good candidate gene for association study of developmental disorders mainly affecting skeleton development. The previous study showed that the SNP sites of Ihh were associated with equine bone developmental disorders [63].
SNP validation
As the SNPs reported in the present study were identified through bioinformatic analysis, the results were needed to evaluate for the validation rate. A total of 48 SNPs were randomly selected for validation by PCR amplification and Sanger sequencing [64]. Of the 48 SNPs, 26 SNPs (54%) were validated and 22 SNPs were not found by PCR amplification and direct sequencing (Table 7).
Table 7. Summary of SNP validation.
| Ensembl Gene ID | Gene Name | Number of SNPs tested | Number of SNPs validated |
| ENSTRUG00000011255 | Translocase of outer mitochondrial membrane 20 homolog | 5 | 2 |
| ENSTRUG00000008698 | RAB9A, member RAS oncogene family | 7 | 4 |
| ENSTRUG00000014751 | Family with sequence similarity 46, member A | 5 | 3 |
| ENSTRUG00000009192 | Coiled-coil domain containing 47 | 5 | 2 |
| ENSTRUG00000006299 | Mitochondrial ribosomal protein L21 | 8 | 5 |
| ENSTRUG00000006704 | Calpain small subunit 1 | 5 | 3 |
| ENSTRUG00000004026 | C-type lectin domain family 11, member A | 6 | 3 |
| ENSTRUG00000014304 | Proliferating cell nuclear antigen | 7 | 4 |
Materials and Methods
Ethics statement
This study was approved by the Animal Care and Use committee of Key Laboratory of Mariculture & Stock Enhancement in North China's Sea at Dalian Ocean University. All surgery was performed under sodium pentobarbital anesthesia, and all efforts were made to minimize suffering.
Sample collection and RNA isolation
A total of 45 Takifugu rubripes (length 20cm) were sampled from Dalian Tianzheng Industrial Co., Ltd (Dalian China). The swimbladders of these fish were collected and pooled. Tissues were placed into RNAlater (Ambion), stored at room temperature for 24 h, and then moved to −80°C for storage until RNA isolation. Total RNA was extracted from the pooled swimbladder using the TRIzol R Reagent (Invitrogen, CA, USA) by following the manufacturer's protocol. The quantity and quality of total RNA was measured using an Agilent 2100 Bioanalyzer.
cDNA library construction and sequencing
Total RNA was sent out for next generation sequencing provided by Beijing Institute of Genomics, Chinese Academy of Sciences. cDNA libraries were constructed from mRNA from swimbladder. cDNA libraries were prepared using the Illumina TruSeq RNA Sample Preparetion Kit (Illumina) according to the TruSeq protocol. After KAPA quantitation and dilution, the libraries were clustered 3 per lane and sequenced on an Illumina HiSeq 2000 instrument with 100 bp paired-end reads.
Reads mapping
The reads were mapping to the fugu T. rubripes fifth genome assembly by BWA program. During the mapping phase, up to five mismatches were allowed. The expression levels (RPKM, Reads Per Kilobase of exon model per Million mapped reads) for each gene were calculated using uniquely mapped reads by in-house Perl script according to the equation:
The cutoff value of gene expression was calculated for each sequencing sample, genes with RPKM greater than cutoff value were defined as expressed genes [65].
SNP identification
BWA and SAMtools (Tools for alignments in the SAM format) software were used to align reads to the fugu genome assembly (version 5.0) for detecting SNPs [66], [67]. Filtering thresholds were set as: consensus quality is no less than 20 and coverage is no less than 10.
Gene Ontology and KEGG pathway analysis
Gene Ontology (GO) and KEGG pathway analyses were conducted to the genes containing SNPs. GO annotation analysis was performed using Blast2GO, an automated tool for the assignment of GO terms. The annotation result was categorized with respect to Biological Process, Molecular Function, and Cellular Component at level 2. In order to gain an overview of gene pathway networks, KEGG analysis was performed using the online KEGG Automatic Annotation Server (KAAS) (http://www.genome.jp/kegg/kass/). The bi-directional best hit (BBH) method was used to obtain KEGG orthology assignments.
SNP validation
To evaluate the validation rate of the SNPs identified by bioinformatic analysis, we randomly selected 48 SNPs and validated by PCR amplification and direct sequencing. PCR primers were designed according to the assembled transcript sequences and were listed in the Table S2. Ten individuals were used for the SNP validation.
Conclusions
In this study, a large number of SNPs were identified by the transcriptome sequencing of the T. rubirpes swimbladder using Illumina HiSeq2000 platform. A large proportion of randomly selected SNPs were verified using the Sanger sequencing, suggesting the high validation rate. The SNPs should provide valuable resources for genomic studies, evolution analysis, population genetic study, resource assessment, genetic linkage analysis and genome-wide association studies.
Supporting Information
The SNPs identified from the transcriptome of the swimbladder of Takifugu rubripes .
(TXT)
Primers used for SNP validation in the study.
(DOC)
Funding Statement
This project was supported by the Program for Liaoning Excellent Talents in University (LR201010) and the grant of Dalian Ocean University (2012HYDX07). The funders had no role in study design, data collection and analysis, decision to publish, or preparation of the manuscript.
References
- 1. Wang Z, Gerstein M, Snyder M (2009) RNA-Seq: a revolutionary tool fortranscriptomics. Nat Rev Genet 10: 57–63. [DOI] [PMC free article] [PubMed] [Google Scholar]
- 2. Anisimov SV (2008) Serial Analysis of Gene Expression (SAGE): 13 years of application in research. Curr Pharm Biotechnol 9: 338–350. [DOI] [PubMed] [Google Scholar]
- 3. Liu S, Wang X, Sun F, Zhang J, Feng J, et al. (2013) RNA-Seq reveals expression signatures of genes involved in oxygen transport, protein synthesis, folding and degradation in response to heat stress in catfish. Physiol Genomics 45(12): 462–76. [DOI] [PubMed] [Google Scholar]
- 4. Liu S, Zhang Y, Zhou Z, Waldbieser G, Sun F, et al. (2012) Efficient assembly and annotation of the transcriptome of catfish by RNA-Seq analysis of a doubled haploid homozygote. BMC Genomics 13: 595. [DOI] [PMC free article] [PubMed] [Google Scholar]
- 5. Liu S, Zhou Z, Lu J, Sun F, Wang S, et al. (2011) Generation of genome-scale gene-associated SNPs in catfish for the construction of a high-density SNP array. BMC Genomics 12: 533. [DOI] [PMC free article] [PubMed] [Google Scholar]
- 6. Liu S, Zhou Z, Lu J, Sun F, Wang S, et al. (2011) Generation of genome-scale gene-associated SNPs in catfish for the construction of a high-density SNP array. BMC Genomics 12: 53. [DOI] [PMC free article] [PubMed] [Google Scholar]
- 7. Sun F, Peatman E, Li C, Liu S, Jiang Y, et al. (2012) Transcriptomic signatures of attachment, NF-kappaB suppression and IFN stimulation in the catfish gill following columnaris bacterial infection. Dev Comp Immunol 38(1): 169–180. [DOI] [PubMed] [Google Scholar]
- 8. Li C, Zhang Y, Wang R, Lu J, Nandi S, et al. (2012) RNA-seq analysis of mucosal immune responses reveals signatures of intestinal barrier disruption and pathogen entry following Edwardsiella ictaluri infection in channel catfish, Ictalurus punctatus. Fish Shellfish Immunol 32: 816–827. [DOI] [PubMed] [Google Scholar]
- 9. Hubert S, Higgins B, Borza T, Bowman S (2010) Development of a SNP resource and a genetic linkage map for Atlantic cod (Gadus morhua). BMC Genomics 11: 191. [DOI] [PMC free article] [PubMed] [Google Scholar]
- 10. Zheng XH, Kuang YY, Lu CY, Wang XP, Li WS, et al. (2011) Quantitative trait locus analysis of standard length, body depth and body thickness in mirror carp (Cyprinus carpio L.). Yi Chuan 33: 1366–1373. [DOI] [PubMed] [Google Scholar]
- 11. Zhao X, Wang Q, Jiao Y, Huang R, Deng Y, et al. (2012) Identification of Genes Potentially Related to Biomineralization and Immunity by Transcriptome Analysis of Pearl Sac in Pearl Oyster Pinctada martensii. Mar Biotechnol (NY). 14: 730–739. [DOI] [PubMed] [Google Scholar]
- 12. Ji P, Liu G, Xu J, Wang X, Li J, et al. (2012) Characterization of common carp transcriptome: sequencing, de novo assembly, annotation and comparative genomics. PLoS One. 7(4): e35152. [DOI] [PMC free article] [PubMed] [Google Scholar]
- 13. Xu J, Ji P, Wang B, Zhao L, Wang J, et al. (2013) Transcriptome sequencing and analysis of wild Amur Ide (Leuciscus waleckii) inhabiting an extreme alkaline-saline lake reveals insights into stress adaptation. PLoS One. 8(4): e59703. [DOI] [PMC free article] [PubMed] [Google Scholar]
- 14. Xu J, Ji P, Zhao Z, Zhang Y, Feng J, et al. (2012) Genome-Wide SNP Discovery from Transcriptome of Four Common Carp Strains. PLoS ONE 7: e48140. [DOI] [PMC free article] [PubMed] [Google Scholar]
- 15. Quilang J, Wang S, Li P, Abernathy J, Peatman E, et al. (2007) Generation and analysis of ESTs from the eastern oyster, Crassostrea virginica Gmelin and identification of microsatellite and SNP markers. BMC Genomics 8: 157. [DOI] [PMC free article] [PubMed] [Google Scholar]
- 16. Moen T, Hayes B, Baranski M, Berg PR, Kjøglum S, et al. (2008) A linkage map of the Atlantic salmon (Salmo salar) based on EST-derived SNP markers. BMC Genomics 9: 223. [DOI] [PMC free article] [PubMed] [Google Scholar]
- 17. Salem M, Vallejo RL, Leeds TD, Palti Y, Liu S, et al. (2012) RNA-Seq identifies SNP marker for growth traits in rainbow trout. PLoS ONE 7: e36264. [DOI] [PMC free article] [PubMed] [Google Scholar]
- 18. Zhang L, Qiu X, Wang J, Jiang Z, Liu Y, et al. (2012) Polymorphism analysis on Melanocortin-4 Receptor (MC4R) gene in Takifugu rubripes. Biotechnology Bulletin 7: 97–102. [Google Scholar]
- 19. Gu J, Zhu Y, Meng X, Sun X (2010) Utilization of microsatellite markers in breeding and genetic analysis in redifin puffer Fugu rubripes. Fisheries science 29(7): 527–531. [Google Scholar]
- 20. Hao J, Sun X, Meng X (2006) Analyzing the polymorphisms of Takifugu rubripes with microsatellite. Journal of Shanghai fisheries university 15(1): 21–24. [Google Scholar]
- 21. Hao J, Sun X, Meng X, Feng J (2007) Identification and application of microsatellite makers from BAC and ESTs sequence in redfin puffer (Takifugu rubripes). Journal of Dalian fisheries university 22(2): 97–101. [Google Scholar]
- 22. Brenner S, Elqar G, Sandford R, Macrae A, Venkatesh B, et al. (1993) Characterization of the pufferfish (Fugu) genome as a compact model vertebrate genome. Nature 366: 265–268. [DOI] [PubMed] [Google Scholar]
- 23. Aparicio S, Chapman J, Stupka E, Putnam N, Chia JM, et al. (2002) Whole-genome shotgun assembly and analysis of the genome of Fugu rubripes. Science 297: 1301–1310. [DOI] [PubMed] [Google Scholar]
- 24. Kai W, Kikuchi K, Tohari S, Chew AK, Tay A, et al. (2011) Integration of the genetic map and genome assembly of fugu facilitates insights into distinct features of genome evolution in teleosts and mammals. Genome Biol Evol 3: 424–442. [DOI] [PMC free article] [PubMed] [Google Scholar]
- 25. Perry SF, Sander M (2004) Reconstructing the evolution of the respiratory apparatus in tetrapods. Respir Physiol Neurobiol 144: 125–139. [DOI] [PubMed] [Google Scholar]
- 26. Perry SF, Wilson RJ, Straus C, Harris MB, Remmers JE (2011) Which came first, the lung or the breath? Comp Biochem Physiol A Mol Integr Physiol 129: 37–47. [DOI] [PubMed] [Google Scholar]
- 27. Zheng W, Wang Z, Collins JE, Andrews RM, Stemple D, et al. (2011) Comparative transcriptome analyses indicate molecular homology of zebrafish swimbladder and mammalian lung. PLoS One 6(8): e24019. [DOI] [PMC free article] [PubMed] [Google Scholar]
- 28. Cui P, Lin Q, Ding F, Xin C, Gong W, et al. (2010) A comparison between ribo-minus RNA-sequencing and polyA-selected RNA-sequencing. Genomics 96(5): 259–265. [DOI] [PubMed] [Google Scholar]
- 29. Shin H, Hirst M, Bainbridge MN, Magrini V, Mardis E, et al. (2008) Transcriptome analysis for Caenorhabditis elegans based on novel expressed sequence tags. BMC Bio 6: 30. [DOI] [PMC free article] [PubMed] [Google Scholar]
- 30. Wang F, Daugherty B, Keise LL, Wei Z, Foley JP, et al. (2003) Heterogeneity of claudin expression by alveolar epithelial cells. Am J Respir Cell Mol Biol 29: 62–70. [DOI] [PubMed] [Google Scholar]
- 31. Loh YH, Christoffels A, Brenner S, Hunziker W, Venkatesh B (2004) Extensive expansion of the claudin gene family in the teleost fish, Fugu rubripes. Genome Res 14: 1248–1257. [DOI] [PMC free article] [PubMed] [Google Scholar]
- 32. Van Itallie C, Rahner C, Anderson JM (2001) Regulated expression of claudin-4 decreases paracellular conductance through a selective decrease in sodium permeability. J Clin Invest 107: 1319–1327. [DOI] [PMC free article] [PubMed] [Google Scholar]
- 33. Coyne CB, Gambling TM, Boucher RC, Carson JL, Johnson LG (2003) Role of claudin interactions in airway tight junctional permeability. Am J Physiol Lung Cell Mol Physiol 285: L1166–1178. [DOI] [PubMed] [Google Scholar]
- 34. Ross-Hansen K, Linneberg A, Johansen JD, Hersoug LG, Brasch-Andersen C, et al. (2013) The role of glutathione S-transferase and claudin-1 gene polymorphisms in contact sensitization: a cross-sectional study. Br J Dermatol 168: 762–670. [DOI] [PubMed] [Google Scholar]
- 35. Bekker V, Chanock SJ, Yeager M, Hutchinson AA, von Hahn T, et al. (2010) Genetic variation in CLDN1 and susceptibility to hepatitis C virus infection. J Viral Hepat 17: 192–200. [DOI] [PMC free article] [PubMed] [Google Scholar]
- 36. MacDonald BT, Tamai K, He X (2009) Wnt/beta-catenin signaling: components, mechanisms, and diseases. Dev Cell 17(1): 9–26. [DOI] [PMC free article] [PubMed] [Google Scholar]
- 37. Cardoso WV, Lu J (2006) Regulation of early lung morphogenesis: questions, facts and controversies. Development 133: 1611–1624. [DOI] [PubMed] [Google Scholar]
- 38. Yin A, Winata CL, Korzh S, Korzh V, Gong Z (2010) Expression of components of Wnt and Hedgehog pathways in different tissue layers during lung development in Xenopus laevis. Gene Expr Patterns 10(7-8): 338–344. [DOI] [PubMed] [Google Scholar]
- 39. Yin A, Korzh V, Gong Z (2012) Perturbation of zebrafish swimbladder development by enhancing Wnt signaling in Wif1 morphants. Biochim Biophys Acta 1823(2): 236–244. [DOI] [PubMed] [Google Scholar]
- 40. Mucenski ML, Wert SE, Nation JM, Loudy DE, Huelsken J, et al. (2003) Beta-catenin is required for specification of proximal/distal cell fate during lung morphogenesis. J. Biol. Chem 278: 40231–40238. [DOI] [PubMed] [Google Scholar]
- 41. Shu W, Guttentag S, Wang Z, Andl T, Ballard P, et al. (2005) Wnt/beta-catenin signaling acts upstream of N-myc, BMP4, and FGF signaling to regulate proximal–distal patterning in the lung. Dev. Biol 283: 226–239. [DOI] [PubMed] [Google Scholar]
- 42. Rajagopal J, Carroll TJ, Guseh JS, Bores SA, Blank LJ, et al. (2008) Wnt7b stimulates embryonic lung growth by coordinately increasing the replication of epithelium and mesenchyme. Development 135: 1625–1634. [DOI] [PMC free article] [PubMed] [Google Scholar]
- 43. Shu W, Jiang YQ, Lu MM, Morrisey EE (2002) Wnt7b regulates mesenchymal proliferation and vascular development in the lung. Development 129: 4831–4842. [DOI] [PubMed] [Google Scholar]
- 44. Li C, Xiao J, Hormi K, Borok Z, Minoo P (2002) Wnt5a participates in distal lung morphogenesis. Dev. Biol 248: 68–81. [DOI] [PubMed] [Google Scholar]
- 45. Lako M, Strachan T, Bullen P, Wilson DI, Robson SC, et al. (1998) Isolation, characterisation and embryonic expression of WNT11, a gene which maps to 11q13.5 and has possible roles in the development of skeleton, kidney and lung. Gene 219: 101–110. [DOI] [PubMed] [Google Scholar]
- 46. Goss AM, Tian Y, Tsukiyama T, Cohen ED, Zhou D, et al. (2009) Wnt2/2b and beta-catenin signaling are necessary and sufficient to specify lung progenitors in the foregut. Dev. Cell 17: 290–298. [DOI] [PMC free article] [PubMed] [Google Scholar]
- 47. Lu Y, Chen SR, Liu WB, Hou ZC, Xu GY, et al. (2012) Polymorphisms in Wnt signaling pathway genes are significantly associated with chicken carcass traits. Poult Sci 91(6): 1299–1307. [DOI] [PubMed] [Google Scholar]
- 48. Hirata H, Hinoda Y, Nakajima K, Kikuno N, Yamamura S, et al. (2009) Wnt antagonist gene polymorphisms and renal cancer. Cancer 115(19): 4488–4503. [DOI] [PMC free article] [PubMed] [Google Scholar]
- 49. Kim IC, Cha MH, Kim DM, Lee H, Moon JS, et al. (2011) A functional promoter polymorphism -607G>C of WNT10B is associated with abdominal fat in Korean female subjects. J Nutr Biochem. 22(3): 252–258. [DOI] [PubMed] [Google Scholar]
- 50. Bellusci S, Furuta Y, Rush MG, Henderson R, Winnier G, et al. (1997) Involvement of sonic hedgehog (Shh) in mouse embryonic lung growth and morphogenesis. Development 124: 53–63. [DOI] [PubMed] [Google Scholar]
- 51. Pepicelli CV, Lewis PM, McMahon AP (1998) Sonic hedgehog regulates branching morphogenesis in the mammalian lung. Curr. Biol 8: 1083–1086. [DOI] [PubMed] [Google Scholar]
- 52. Litingtung Y, Lei L, Westphal H, Chiang C (1998) Sonic hedgehog is essential to foregut development. Nat. Genet 20: 58–61. [DOI] [PubMed] [Google Scholar]
- 53. Motoyama J, Liu J, Mo R, Ding Q, Post M, et al. (1998) Essential function of Gli2 and Gli3 in the formation of lung, trachea and oesophagus. Nat. Genet 20: 54–57. [DOI] [PubMed] [Google Scholar]
- 54. Winata CL, Korzh S, Kondrychyn I, Zheng W, Korzh V, et al. (2009) Development of zebrafish swimbladder: The requirement of Hedgehog signaling in specification and organizationof the three tissue layers. Dev Biol 331(2): 222–236. [DOI] [PubMed] [Google Scholar]
- 55. Avaron F, Hoffman L, Guay D, Akimenko MA (2006) Characterization of two new zebrafish members of the hedgehog family: atypical expression of a zebrafish Indian hedgehog gene in skeletal elements of both endochondral and dermal origins. Dev. Dyn 235: 478–489. [DOI] [PubMed] [Google Scholar]
- 56. Currie PD, Ingham PW (1996) Induction of a specific muscle cell type by a novel hedgehog gene family member. Nature 382: 452–455. [DOI] [PubMed] [Google Scholar]
- 57. Ekker S, Ungar A, Greenstein P, von Kessler D, Porter J, et al. (1995) Patterning activities of vertebrate hedgehog proteins in the developing eye and brain. Curr. Biol 5: 944–955. [DOI] [PubMed] [Google Scholar]
- 58. Krauss S, Concordet JP, Ingham PW (1993) A functionally conserved homolog of the Drosophila segment polarity gene hh is expressed in tissues with polarizing activity in zebrafish embryos. Cell 75: 1431–1444. [DOI] [PubMed] [Google Scholar]
- 59. Roelink H, Augsburger A, Heemskerk J, Korzh V, Norlin S, et al. (1994) Floor plate and motor neuron induction by vhh-1, a vertebrate homolog of hedgehog expressed by the notochord. Cell 76: 761–775. [DOI] [PubMed] [Google Scholar]
- 60. Concordet JP, Lewis KE, Moore JW, Goodrich LV, Johnson RL, et al. (1996) Spatial regulation of a zebrafish patched homologue reflects the roles of sonic hedgehog and protein kinase A in neural tube and somite patterning. Development 122: 2835–2846. [DOI] [PubMed] [Google Scholar]
- 61. Lewis KE, Concordet JP, Ingham PW (1999) Characterization of a second patched gene in the zebrafish Danio rerio and the differential response of patched genes to Hedgehog signaling. Dev. Biol 208: 14–29. [DOI] [PubMed] [Google Scholar]
- 62. Wang B, Zhou S, Hong F, Wang J, Liu X, et al. (2012) Association analysis between the tag SNP for sonic hedgehog rs9333613 polymorphism and male sexual orientation. J Androl 33(5): 951–954. [DOI] [PubMed] [Google Scholar]
- 63. Zabek T, Golonka P, Fornal A, Semik E (2013) IHH gene polymorphism among three horse breeds and its application for association test in horses with osteochondrosis. Hereditas 150(2-3): 38–43. [DOI] [PubMed] [Google Scholar]
- 64. Yang A, Sun D, Liu S, Dong Y, Chen Z (2012) Characterization of fifteen SNP markers by mining EST in sea cucumber, Apostichopus japonicus. J Genet 91(1): e49–53. [PubMed] [Google Scholar]
- 65. Mortazavi A, Williams BA, McCue K, Schaeffer L, Wold B (2008) Mapping and quantifying mammalian transcriptomes by RNA-Seq. Nat Methods 5(7): 621–628. [DOI] [PubMed] [Google Scholar]
- 66. Li H, Durbin R (2009) Fast and accurate short read alignment with Burrows-Wheeler transform. Bioinformatics 25(14): 1754–1760. [DOI] [PMC free article] [PubMed] [Google Scholar]
- 67. Li H, Durbin R (2010) Fast and accurate long-read alignment with Burrows-Wheeler transform. Bioinformatics 26(5): 589–595. [DOI] [PMC free article] [PubMed] [Google Scholar]
Associated Data
This section collects any data citations, data availability statements, or supplementary materials included in this article.
Supplementary Materials
The SNPs identified from the transcriptome of the swimbladder of Takifugu rubripes .
(TXT)
Primers used for SNP validation in the study.
(DOC)