Abstract
Purpose
To develop a technique that accurately detects the QRS complex in 1.5T, 3T and 7T MRI scanners.”
Theory and Methods
During early systole, blood is rapidly ejected into the aortic arch, traveling perpendicular to the MRI’s main field, which produces a strong voltage (VMHD) that eclipses the QRS complex. Greater complexity arises in arrhythmia patients, since VMHD can vary between sinus-rhythm and arrhythmic beats. The 3DQRS method uses a kernel consisting of 6 ECG precordial leads, compiled from a 12-lead ECG performed outside the magnet. The kernel is cross-correlated with signals acquired inside the MRI in order to identify the QRS complex in real time.
The 3DQRS method was evaluated against a Vectorcardiogram-based (VCG) approach in 2 Premature Ventricular Contraction (PVC) and 2 Atrial Fibrillation (AF) patients, a healthy exercising athlete and 8 healthy volunteers, within 1.5T and 3T MRIs, using a prototype MRI-conditional 12 lead ECG system. 2 volunteers were recorded at 7T using a Holter recorder.
Results
For QRS complex detection, 3DQRS subject-averaged sensitivity levels, relative to VCG were: 1.5T (100% vs. 96.7%), 3T (98.9% vs. 92.2%), 7T (96.2% vs. 77.7%).
Conclusions
The 3DQRS method was shown to be more effective in cardiac gating than a conventional VCG-based method.
Keywords: 12-Lead Electrocardiogram, MRI-guided interventions, Cardiac MRI, High-field MRI, Arrhythmia
Introduction
The Electrocardiogram (ECG) is a clinical standard for monitoring patient heart activity. Several issues in obtaining high-fidelity ECG have been studied that arise when the patient is in the presence of a high field MRI scanner (1). In this work we address the issue of the distortion of ECG signals by the Magneto-hydrodynamic (MHD) effect, which is the result of the interaction of the static magnetic field (B0) with rapidly moving blood plasma electrolytes during the early systolic phase of the cardiac cycle. As blood is rapidly ejected from the left ventricle and into the aortic arch during this period, an MHD-induced voltage (VMHD) is produced (2–5). The strongest source of VMHD is due to flow within the aortic arch, which is perpendicular to B0, and its amplitude exceeds the real ECG QRS complex in high field MRIs (6). VMHD can be severely irregular in patients with cardiac arrhythmias, since arrhythmic beats produce irregular mechanical contractions, such as those during Premature Ventricular Contractions (PVC) and Atrial Fibrillation (AF). The VMHD overlay of the ECG signal traces can result in intermittent QRS detection, leading to motion-based image artifacts in cardiac MRI, longer scan times, and repeat scans. Accurate detection of the QRS complex, in the presence of VMHD, is therefore essential for successful cardiac imaging.
To avoid MHD related interferences and perform robust cardiac synchronization, use of a phonocardiogram, a device that measures sounds in the heart that result from mechanical motion, has been explored (7,8). The delay in myocardial mechanical response relative to the electrical impulse, mechanical noise from the MRI scanner gradient changes, as well as the complexity of mechanical motion during cardiac arrhythmias, such as PVCs, may limit the applicability of this method in patients (9).
Independent component analysis (ICA) has been proposed for MHD extraction in healthy patients, assuming that ECG signals and VMHD are generated from two independent sources (10,11). A number of ICA faults lead to diagnostic errors when tested with real and simulated datasets (12).
Single-lead ECG gating approaches have also been explored, which utilize a combination of pre-processing and thresholding procedures (13–17).
In 12-lead ECG acquisition, each of the 12 ECG channels provide position-dependent estimates of cardiac electrical information, and as such, the use of multiple channels provide an increased level of cardiac information, relative to the use of only 4 ECG channels which are presently available in commercial MRI-compatible ECG systems.
Processing of multichannel ECG data can currently be performed with Vectorcardiogram (VCG) techniques (18), although these have been shown to have limitations in arrhythmic patients as well as in very high field MRI (19), especially when 2 or 3 leads are used for VCG gating.
A new method of QRS detection using multi-channel ECG leads is hereby proposed for MRI synchronization in high field MRI, which should succeed in the presence of arrhythmic beats, since these are commonly found in patients with ischemic histories, or during stress perfusions studies (20).
Methods
The 3D-QRS principle
Commercial MRI-conditional ECG recording systems utilize four closely-spaced (5 cm) electrodes. With smaller inter-electrode distances than those found in conventional 12-lead ECG systems (30–40cm), the voltages detected by these electrodes are smaller, and do not possess the wealth of information offered by 12-lead systems. Recently, the use of 12-lead ECG systems inside MRIs has been explored, using systems specifically engineered to work in the MRI field during imaging (21) or conventional 12-lead systems that were used in the absence of imaging (12).
Using 12-lead ECG (21) acquisition, selected ECG channels can be grouped together to form a (3D) representation based on signal amplitude, channel location, and temporal evolution.
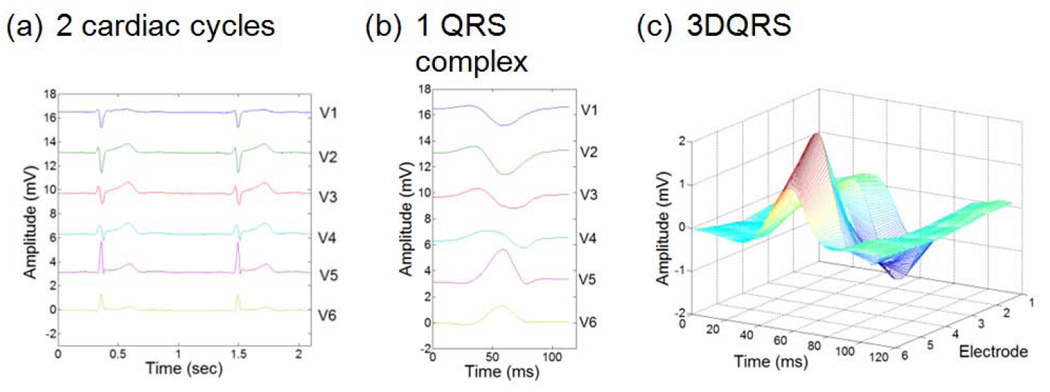
For the 3DQRS method, the precordial electrode signals (V1–V6) were chosen, due to the electrode proximity to the heart, which commonly provides higher amplitude ECG signals, relative to the limb leads. The traces acquired by these leads, relative to time, were used to create a characteristic 3-D geometry (22,23). A cross-correlation algorithm was then applied between (i) the 3D surface of a QRS complex computed from V1–V6 acquired inside the MRI and (ii) a 3DQRS template taken outside the MRI (Figure 1). The normalized correlation algorithm returned a one-dimensional trace containing coefficients which indicated the differences between (i) the intra-MRI ECG dataset and (ii) the template at a given time point. These coefficients ranged from 0 to 1, with 1 denoting an exact match and 0 a total lack of correlation.
Fig. 1.
Characteristic ECG data acquired in a healthy patient outside the MRI bore at 1.5 T; (a) traces acquired over 2 cycles, (b) 120ms clip of (a) at QRS complex, and (c) QRS complex surface (3D) rendering.
Cross-correlation processing techniques were used, since they allowed for the reliance on pattern matching instead of a comparison of ECG signal amplitudes, which may be advantageous when the peak ECG signal does not coincide with the R-wave peak, such as that occurs with PVCs or in the presence of the strong VMHD voltages observed in high field MRIs.
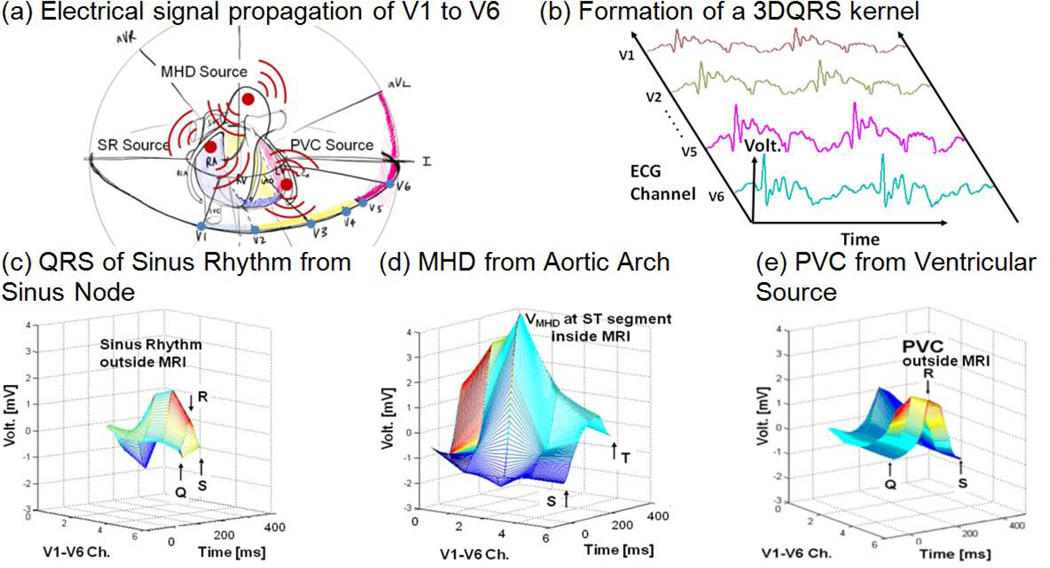
The detection principle of the 3DQRS surface lies in the 3rd axis (the channel axis) that is generated from the spatial expansion of the ECG signal by the inclusion of precordial electrodes (V1–V6). Since, the QRS complex and VMHD originate from the sinus node and the aortic arch, respectively, signal source and propagation information from these cardiac sources is carried in a varying fashion to each of the surface leads (Figure 2a–b), which are positioned differently, relative to these sources. The 3-D representation of the QRS complex and VMHD therefore contain geometric information in this channel axis (Figure 2c–d). Some cardiac arrhythmias, such as PVCs, have also been shown to contain a unique 3-D representation (Figure 2e).
Fig. 2.
The 3DQRS detection principle; (a) geometric representation of cardiac voltage sources observed within the MRI bore relative to the position of the surface leads V1–V6, (b) formation of a typical 3DQRS complex, (c) QRS of sinus rhythm outside the MRI in an Idiopathic Outflow Tract (IOT) PVC patient, (d) VMHD at 3T, (e) PVC outside the MRI in an IOT PVC patient.
Implementation
Executing the 3DQRS algorithm (Figure 3) in “real-time” (i.e. with minimal lag time after trace acquisition) required three signal processing stages: (i) pre-processing (steps 1–3), conditioning of the raw traces, (ii) cross-correlation operations (steps 4–5), and (iii) post-processing, the marking of the R-wave peak for MRI-scanner synchronization (steps 6–7).
Fig. 3.
3DQRS algorithm flow diagram, showing steps 1–7 separated into three sections.
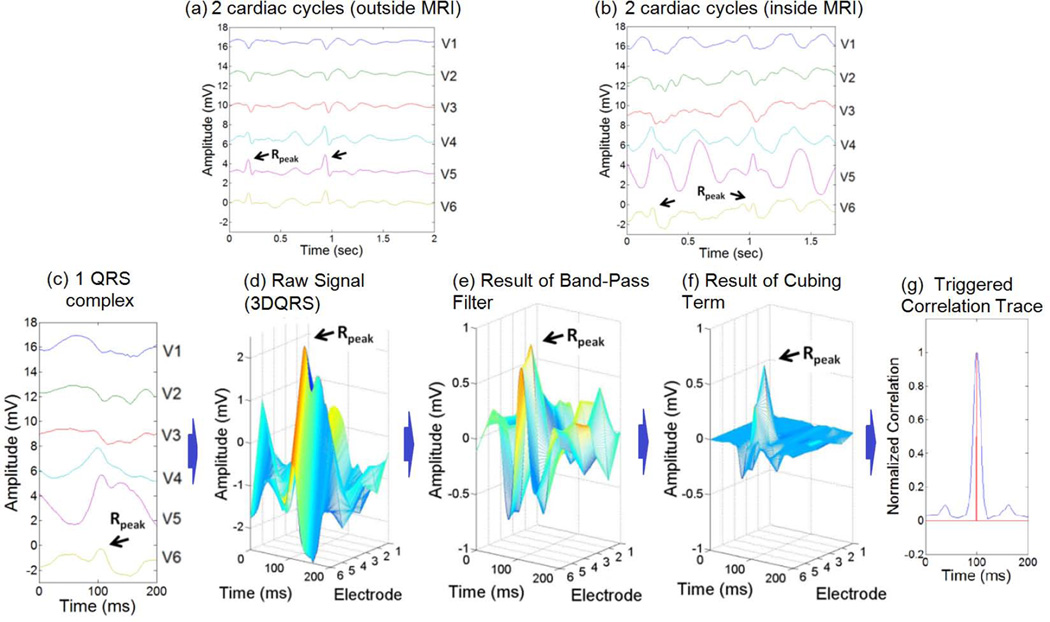
The pre-processing of the ECG waveform, which conditioned the precordial leads V1–V6 to increase the efficacy of the cross-correlation (steps 1–3), began with application of a 10 to 25 Hz Band-Pass Filter (steps 1–2), a standard filter used to detect the QRS complex (14). This step attenuated signal components of lesser interest (Figure 4a–d). In step 3, a cubic term was applied, which increased the signal amplitude while preserving the positive/negative sign of the signal (Figure 4f). The increased signal amplitude proved to be essential in order for the cross-correlation routine to successfully differentiate between similar patterns.
Fig. 4.
Stages of the 3DQRS procedure, as applied to a volunteer inside a 3T MRI scanner; (a) cardiac traces acquired outside the MRI, used to construct the template, (b) traces acquired within the MRI, showing the large MHD peaks, relative to the small R-wave peaks (black arrows), (c) 200ms clip of QRS complex acquired at 3T, (d) formation of 3DQRS complex at 3T, (e) application of band-pass filter, (f) application of cubic term, (g) result of cross-correlation routine, showing the maximal correlation time (red vertical line).
A patient-specific clean ECG template was acquired outside the MRI scanner during breath-holds, in order to observe the ECG traces without VMHD and construct the 3D kernel. Once this kernel was acquired, the 2-D cross-correlation operation (steps 4–5) was performed continuously during the course of data acquisition. Pre-processing steps were applied to the 3D kernel acquired outside the MRI scanner, as this resulted in a stronger cross-correlation metric. The effect of the band-pass filtering function and the cubing function has been illustrated in Figure 4c–g. A line-following algorithm was implemented to detect peaks in the correlation signal in order to mark the R-wave peak for synchronization of the MRI scanner (steps 6–7).
Figure 4 is an example of the 3DQRS processing. The normalized 2-D cross-correlation was computed in Matlab (Mathworks, Natick, MA) using a cross-correlation template matching algorithm (24). A patient-specific QRS complex recorded outside the MRI was used as the kernel (Figure 4a). The cross-correlation routine produced a correlation trace (Figure 4g) after band-pass filtering (Figure 4e) and cubing (Figure 4f) of the raw signal (Figure 4d). The QRS complex kernel and the intra-MRI ECG data traces produced the maximal correlation when QRS complexes in the intra-MRI ECG data were found and matched with the kernel (Figure 4g), indicating the timing of the R-wave peaks, as needed for cardiac gating.
R-wave detection was performed through triggering of the correlation signal by a threshold-activated line-following algorithm (25). A cross-correlation value of 0.5 was used as the threshold level, corresponding to a 50% correlation. Current conditions in the line-following algorithm, including total algorithm computational time, allowed for scanner triggering in less than 20ms after the R-peak using a 64-bit quad-core computer (Lenovo T430). An exclusion period of 200ms was applied after each detected peak, which avoided (false) triggering immediately after the peak was detected, which was particularly important in arrhythmic patients with a strong and irregular VMHD. The length of the exclusion period was based on a conservative estimate of the maximal human heart rate (26).
VCG Algorithm Comparison
The gating result of the 3DQRS algorithm was compared to the triggers of the QRS complex computed from a conventional VCG-based routine (18). The VCG algorithm employed an inverse Dower transform (27) to synthesize the VCG from the 12-lead ECG data traces (V1–V6 and limb leads I and II). The principle of operation of the VCG algorithm was based on the comparison between (i) a VCG reference vector, at R-peak, recorded using data from outside the MRI and (ii) a VCG vector taken from a time series (18). The R-wave peak was detected using the VCG method when the difference between vectors (i) and (ii) in terms of angle and magnitude was minimized (18).
Subject Evaluation at 1.5, 3 & 7T
The robustness of the 3DQRS algorithm to variations in kernel size, field strength and subject pathology was assessed. Dependence on the kernel temporal length was assessed by recording the level of the correlation coefficient at the time of R-wave peak when different segments of the QRS complex were used as the template. The MRI field strength dependence was assessed by recording the correlation coefficient, using a full-length (100ms) kernel as B0 was varied from 0 to 7T.
The 3DQRS method was evaluated against a conventional VCG-based approach (18) in 2 patients with PVCs at 1.5T, 2 with AF at 3T, a healthy exercising athlete at 3T, 8 healthy volunteers at 3T, and 2 healthy volunteer subjects at 7T. The 1.5T and 3T ECG data was obtained with institutional IRB approval at Brigham and Women’s Hospital using a GE digital-IT 12-lead ECG recording system (28), and the 7T ECG data was obtained with institutional IRB approval at the Otto-von-Guericke University of Magdeburg, using a 12-lead Holter ECG recording system (12).
As methods for filtering of MRI gradient induced noise occurred in intra-MRI ECG have been studied and published in literature (21,29–31), this study focuses on the comparison of accuracy in QRS complex detection in the presence of a strong magnetic field, and therefore only data acquired in the absence of MRI gradient field pulses was utilized.
The computational time recorded for the 3DQRS method ranged from 15ms to 20ms. The data streams were processed using both the 3DQRS and the VCG algorithms, and the resulting false positive and false negative counts from each routine were recorded. These metrics were compared to the total number of actual beats in each data series, establishing the percentage of error for each count. Data was processed from a cumulative total of 1,897 beats from all the subjects.
Results
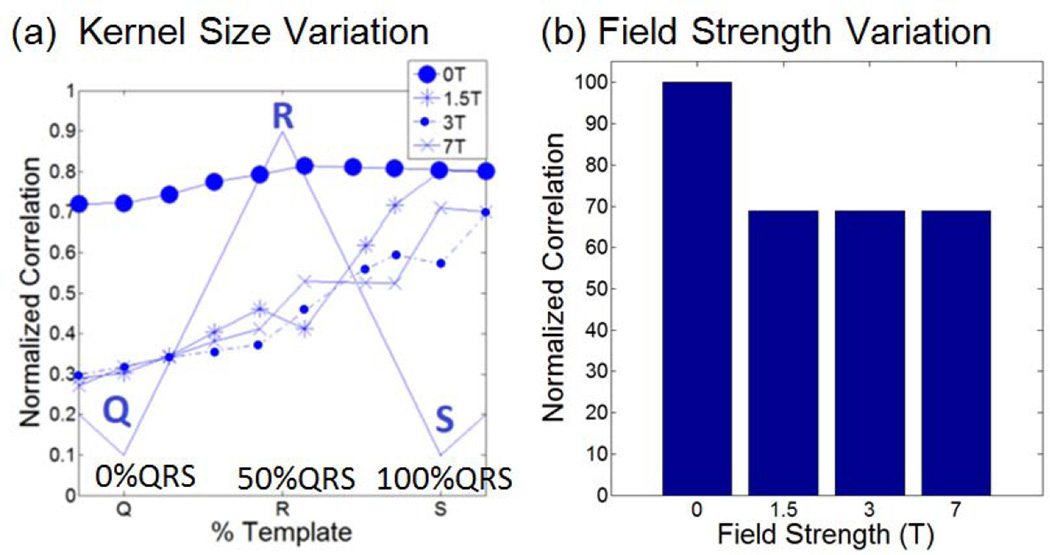
The correlation dependence on 3DQRS kernel size (Figure 5a) and field strength (Figure 5b) were assessed using both patient and volunteer data. The correlation index at 1.5, 3 and 7T approached 60% of a perfect match (Figure 5a) when the kernel length was 75% of the full QRS kernel (Q-R segment, plus half of the R-S segment). This allowed for R-peak detection to be completed 20ms after the R-peak, on average, resulting in an overall triggering delay of around 40ms, which includes a 20ms computer processing time. A small variation in the correlation index was observed even for increasing field strengths from 0, 1.5T, 3T to 7T (Figure 5b).
Fig. 5.
(a) Dependence of Cross-Correlation on field strength (0 T designates measures obtained relative to other traces outside MRI) and correlation kernel temporal length, relative to the QRS segment length (plotted with thin lines). (b) Variability of cross correlation with different magnetic field strengths at a set (75%) kernel length, normalized with the cross correlation at 0T.
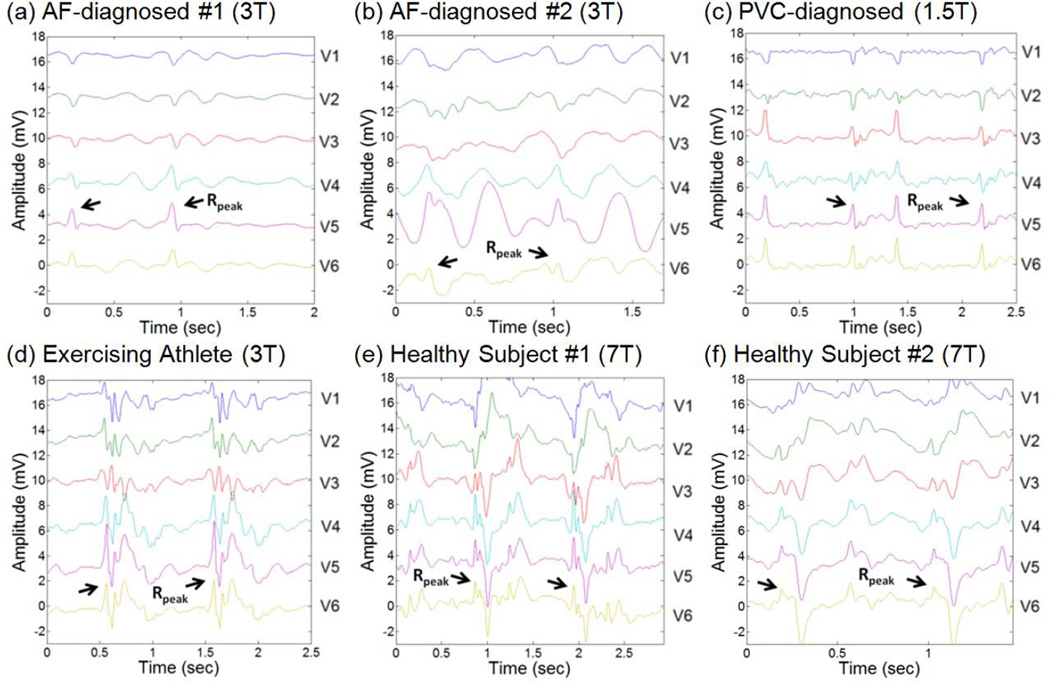
Figure 6 shows ECG traces taken inside 1.5T, 3T and 7T MRI scanners in patients with diagnosed PVC and AF, healthy exercising athletes as well as healthy volunteer subjects. Effectiveness of the 3DQRS method was found to be markedly better than the VCG-based routine in all the subjects (Table 1).
Fig. 6.
Representative 2 cardiac cycles for patients and volunteers at various field strengths, with the detected R-wave peak positions denoted.
Table 1.
Results of 3DQRS Efficacy Test at 1.5T, 3T, and 7T
| 3DQRS | VCG-based | Marked | |||||
|---|---|---|---|---|---|---|---|
| False Negative |
False Positive | False Negative |
False Positive |
Total Beats | |||
| Section 1 | AF-Diagnosed #1 at 3T | 3 | 1 | 3 | 6 | 45 | |
| AF-Diagnosed #2 at 3T | 1 | 1 | 34 | 18 | 169 | ||
| Exercising Athlete at 3T | 2 | 2 | 4 | 22 | 102 | ||
| Healthy Volunteer #1 at 3T | 0 | 1 | 17 | 6 | 60 | ||
| Healthy Volunteer #2 at 3T | 0 | 0 | 12 | 7 | 115 | ||
| Healthy Volunteer #3 at 3T | 0 | 0 | 0 | 0 | 57 | ||
| Healthy Volunteer #4 at 3T | 0 | 0 | 0 | 0 | 64 | ||
| Healthy Volunteer #5 at 3T | 1 | 1 | 6 | 2 | 136 | ||
| Healthy Volunteer #6 at 3T | 1 | 0 | 2 | 4 | 58 | ||
| Healthy Volunteer #7 at 3T | 2 | 0 | 2 | 12 | 73 | ||
| Healthy Volunteer #8 at 3T | 0 | 2 | 0 | 2 | 72 | ||
| Total Count | 10 | 8 | 80 | 79 | 951 | ||
| Sensitivity (Se) | 98.9% | 92.2% | -- | ||||
| Positive Predictive (+P) | 99.2% | 92.3% | -- | ||||
| Section 2 | PVC #1 at 1.5T | 0 | 0 | 1 | 21 | 24 | |
| PVC #2 at 1.5T | 0 | 0 | 1 | 16 | 35 | ||
| Total Count | 0 | 0 | 2 | 37 | 59 | ||
| Sensitivity (Se) | 100% | 96.7% | -- | ||||
| Positive Predictive (+P) | 100% | 61.5% | -- | ||||
| Section 3 | Healthy Subject #1 at 7T | 6 | 6 | 175 | 156 | 382 | |
| Healthy Subject #2 at 7T | 29 | 30 | 80 | 56 | 505 | ||
| Total Count | 35 | 36 | 255 | 212 | 887 | ||
| Sensitivity (Se) | 96.2% | 77.7% | -- | ||||
| Positive Predictive (+P) | 96.1% | 80.7% | -- | ||||
Table 1 Section 1 shows results from both AF-diagnosed patients and the exercising athlete obtained in a 3T MR scanner, in which a consistent improvement was demonstrated in R-wave peak detection using the 3DQRS method, relative to the VCG-based method. The improvement resulted in a relative increase of ~6% in sensitivity (Se) levels (from 92.2% to 98.9%) and in positive predictive (+P) value (from 92.3% to 99.2%).
Table 1 Section 2 shows the data recorded from PVC-diagnosed patients, demonstrating the inability of the VCG-based algorithm to distinguish between R-peaks and PVCs even at 1.5T, where the MHD voltage is less severe. At 1.5T, Se and +P were found to be 100% using the 3DQRS method versus the relatively low +P of 61.5% observed with the VCG-based method.
Table 1 Section 3 shows the 7T results, where the 3DQRS algorithm was found to be superior to the VCG-based algorithm, resulting in a 15.5% decrease in SE and 19.8% in +P.
An overall level of 96.9% and 96.9% was observed at the different MRI field strengths for Se and +P, respectively, in the case of the 3DQRS method, while a 80.9% and a 81.1% overall level was observed for both counts in the case of the VCG-method. This represented an overall decrease in error of over 16% for both metrics, when comparing the 3DQRS method to the VCG-based method.
Discussion and Conclusion
12-lead ECG was recorded in healthy volunteers, AF and PVC patients inside and outside an MRI scanner at 1.5, 3 and 7T. The QRS complex of the ECG data was detected using the 3DQRS method, with the results compared with a conventional VCG-based method (18). An overall decrease in detection error of over 16% for all subjects was observed when using the 3DQRS method.
A decrease in error of ~10% was observed when using the 3DQRS method for healthy volunteers and AF-diagnosed patients at 3T. A lower level of 61.5% was noted for the +P obtained in PVC-diagnosed patients even at 1.5T, which is very significant, since at 1.5T VMHD is less severe than at higher fields. This high error in the VCG method, despite the increased use of 12-lead ECG channels, is due to the similarity in the PVC vector and R-peak vector calculated using the VCG, in contrast to the distinguishable 3-D kernel of PVCs relative to the QRS complexes obtained using the 3DQRS method.
Over a 16% decrease in error for both false negative and false positive counts was observed in all sections 1, 2 and 3, in particular section 3 where decreases in error of over 24% (false positive) and 19% (false negative) were observed in the two healthy volunteers at 7T. The higher magnitudes of VMHD at 7T complicate the identification of the R-peak vector using the VCG method, whilst the 3DQRS kernel was still able to discern the peaks.
Arrhythmic beats combined with higher magnetic field strengths can cause the VCG method to fail, because the VCG-obtained R-peak vector measured outside the MRI does not consistently correlate with the R-peak vector measured under these conditions. The superior results of QRS complex detection observed in the 3DQRS method can be attributed to the unique geometrical information that is obtained with the 3D QRS kernel. The cross correlation levels which are used in the 3DQRS method to detect QRS complexes remain consistent as the field strength increases, which suggest that the 3DQRS kernel is robust to changes in B0 up to 7T, although no patients were included at 7T in this study. These findings suggest the improved reliability of cardiac gating in high field MRI using the 3DQRS method.
The 3DQRS method includes a step of cross-correlation calculation, which makes this method more computationally demanding than the VCG-based method. We found that the 3DQRS algorithm can be performed in 20ms using a state-of-the-art personal computer, which permits practical use of this computational algorithm to achieve improved ECG-gating in high-field MRIs. Cross-correlation methodologies allow for simple subtraction of R peak signals without the need for the costly computation of matrix multiplications, as in the VCG method.
Future work includes study of a large population of patient subjects with arrhythmia to further valid the 3DQRS method in improving cardiac gating and heart rate detection in high field MRIs.
Acknowledgments
Funding Sources and Acknowledgements
This work was supported by AHA 10SDG261039, NIH U41-RR019703, NIH R03 EB013873-01A1, a BWH BRREF award, and a Hong-Kong Croucher fellowship. We thank Otto-von-Guericke University of Magdeburg for providing the 7 Tesla 12-lead ECG datasets. We also thank Dr. Michael Jerosch-Herold, Dr. Raymond Y. Kwong, Dr. Gregory Michaud and Dr. William G. Stevenson from the Department of Cardiology, Brigham and Women’s Hospital, Dr. Charles L. Dumoulin from the Department of Radiology, Cincinnati Children’s Hospital Medical Center, Dr. Gari D. Clifford and Dr. Julien Oster from the Department of Engineering Science, University of Oxford for providing clinical consultations, and assisting with patient recruitment, data collection, and study design.
Footnotes
Disclosures
None
References
- 1.Birkholz T, Schmid M, Nimsky C, Schuttler J, Schmitz B. ECG artifacts during intraoperative high-field MRI scanning. Journal of neurosurgical anesthesiology. 2004;16(4):271–276. doi: 10.1097/00008506-200410000-00002. [DOI] [PubMed] [Google Scholar]
- 2.Blandford R, Thorne K. Applications of Classical Physics. CA: CalTech; 2004. Magnetohydrodynamics; pp. 1–40. [Google Scholar]
- 3.Krug J, Rose G. Magnetohydrodynamic distortions of the ECG in different MR scanner configurations. Computing in Cardiology. 2011:769–772. [Google Scholar]
- 4.Kyriakou A, Neufeld E, Szczerba D, Kainz W, Luechinger R, Kozerke S, McGregor R, Kuster N. Patient-specific simulations and measurements of the magneto-hemodynamic effect in human primary vessels. Physiological measurement. 2012;33(2):117–130. doi: 10.1088/0967-3334/33/2/117. [DOI] [PubMed] [Google Scholar]
- 5.Kinouchi Y, Yamaguchi H, Tenforde TS. Theoretical analysis of magnetic field interactions with aortic blood flow. Bioelectromagnetics. 1996;17(1):21–32. doi: 10.1002/(SICI)1521-186X(1996)17:1<21::AID-BEM3>3.0.CO;2-8. [DOI] [PubMed] [Google Scholar]
- 6.Jekie M, Dzwonczyk R, Ding S, Raman V, Simonetti O. Quantitative evaluation of magnetohydrodynamic effects on the electrocardiogram. Proc Intl Soc Mag Reson Med. 2009;17:3795. [Google Scholar]
- 7.Maderwald S, Orzada S, Lin Z, Schafer L, Bitz A, Kraff O, Brote L, Haring L, Czylwik A, Zenge M, Ladd S, Ladd M, Nassenstein K. 7 Tesla Cardiac Imaging with a Phonocardiogram Trigger Device. Proc Intl Soc Mag Reson Med. 2011;19:1322. [Google Scholar]
- 8.Nassenstein K, Orzada S, Haering L, Czylwik A, Zenge M, Eberle H, Schlosser T, Bruder O, Muller E, Ladd ME, Maderwald S. Cardiac MRI: evaluation of phonocardiogram-gated cine imaging for the assessment of global und regional left ventricular function in clinical routine. European radiology. 2012;22(3):559–568. doi: 10.1007/s00330-011-2279-z. [DOI] [PubMed] [Google Scholar]
- 9.Nassenstein K, Orzada S, Haering L, Czylwik A, Jensen C, Schlosser T, Bruder O, Ladd ME, Maderwald S. Cardiac magnetic resonance: is phonocardiogram gating reliable in velocity-encoded phase contrast imaging? European radiology. 2012;22(12):2679–2687. doi: 10.1007/s00330-012-2547-6. [DOI] [PubMed] [Google Scholar]
- 10.Krug J, Rose G, Clifford G, Oster J. Improved ECG based gating in ultra high field cardiac MRI using an independent component analysis approach. Journal of Cardiovascular Magnetic Resonance. 2013;15(Suppl 1):33. doi: 10.1186/1532-429X-15-104. [DOI] [PMC free article] [PubMed] [Google Scholar]
- 11.Oster J, Pietquin O, Abacherli R, Kraemer M, Felblinger J. Independent component analysis-based artefact reduction: application to the electrocardiogram for improved magnetic resonance imaging triggering. Physiological measurement. 2009;30(12):1381–1397. doi: 10.1088/0967-3334/30/12/007. [DOI] [PubMed] [Google Scholar]
- 12.Krug J, Rose G, Stucht D, Clifford G, Oster J. Filtering the Magnetohydrodynamic Effect from 12-lead ECG Signals using Independent Component Analysis. Computing in Cardiology. 2012:589–592. [Google Scholar]
- 13.Hamilton PS, Tompkins WJ. Quantitative investigation of QRS detection rules using the MIT/BIH arrhythmia database. IEEE transactions on bio-medical engineering. 1986;33(12):1157–1165. doi: 10.1109/tbme.1986.325695. [DOI] [PubMed] [Google Scholar]
- 14.Kohler BU, Hennig C, Orglmeister R. The principles of software QRS detection. IEEE engineering in medicine and biology magazine : the quarterly magazine of the Engineering in Medicine & Biology Society. 2002;21(1):42–57. doi: 10.1109/51.993193. [DOI] [PubMed] [Google Scholar]
- 15.Pan J, Tompkins WJ. A real-time QRS detection algorithm. IEEE transactions on biomedical engineering. 1985;32(3):230–236. doi: 10.1109/TBME.1985.325532. [DOI] [PubMed] [Google Scholar]
- 16.Abi-Abdallah D, Robin V, Drochon A, Fokapu O. Alterations in human ECG due to the MagnetoHydroDynamic effect: a method for accurate R peak detection in the presence of high MHD artifacts; Conference proceedings : Annual International Conference of the IEEE Engineering in Medicine and Biology Society IEEE Engineering in Medicine and Biology Society Conference; 2007. pp. 1842–1845. [DOI] [PubMed] [Google Scholar]
- 17.Last T, Nugent CD, Owens FJ. Multi-component based cross correlation beat detection in electrocardiogram analysis. Biomedical engineering online. 2004;3(1):26. doi: 10.1186/1475-925X-3-26. [DOI] [PMC free article] [PubMed] [Google Scholar]
- 18.Fischer SE, Wickline SA, Lorenz CH. Novel real-time R-wave detection algorithm based on the vectorcardiogram for accurate gated magnetic resonance acquisitions. Magnetic resonance in medicine : official journal of the Society of Magnetic Resonance in Medicine / Society of Magnetic Resonance in Medicine. 1999;42(2):361–370. doi: 10.1002/(sici)1522-2594(199908)42:2<361::aid-mrm18>3.0.co;2-9. [DOI] [PubMed] [Google Scholar]
- 19.Krug J, Rose G, Stucht D, Clifford G, Oster J. Limitations of VCG based gating methods in ultra high field cardiac MRI. Journal of Cardiovascular Magnetic Resonance. 2013;15(Suppl 1):19. doi: 10.1186/1532-429X-15-104. [DOI] [PMC free article] [PubMed] [Google Scholar]
- 20.Bigger JT, Jr, Dresdale RJ, Heissenbuttel RH, Weld FM, Wit AL. Ventricular arrhythmias in ischemic heart disease: mechanism, prevalence, significance, and management. Progress in cardiovascular diseases. 1977;19(4):255–300. doi: 10.1016/0033-0620(77)90005-6. [DOI] [PubMed] [Google Scholar]
- 21.Tse ZT, Dumoulin CL, Clifford GD, Schweitzer J, Qin L, Oster J, Jerosch-Herold M, Kwong RY, Michaud G, Stevenson WG, Schmidt EJ. A 1.5T MRI-conditional 12-lead electrocardiogram for MRI and intra-MR intervention. Magnetic Resonance in Medicine. 2013 doi: 10.1002/mrm.24744. [DOI] [PMC free article] [PubMed] [Google Scholar]
- 22.Tse Z, Dumoulin C, Watkins R, Pauly KB, Kwong R, Michaud G, Stevenson W, Jolesz F, Schmidt E. Improved cardiac gating at 3T with the “3D-QRS” method utilizing MRI-compatible 12-lead ECGs. Journal of Cardiovascular Magnetic Resonance. 2013;15(Suppl 1):W20. [Google Scholar]
- 23.Tse ZTH, Dumoulin CL, Clifford G, Jerosch-Herold M, Kacher D, Kwong R, Stevenson WG, Schmidt EJ. Improved R-wave detection for enhanced cardiac Gating using an MRI-compatible 12-lead ECG and multi-channel analysis. Journal of Cardiovascular Magnetic Resonance. 2011;13(Suppl 1):P3. [Google Scholar]
- 24.Lewis JP. Fast Normalized Cross-Correlation. Industrial Light & Magic; 1995. [Google Scholar]
- 25.Nocedal J, Wright S. Line Search Methods. In: Mikosch T, Resnick S, Robinson S, editors. Numerical Optimization. Volume 2. New York, NY: Springer Science; 2006. [Google Scholar]
- 26.Target Heart Rate and Estimated Maximum Heart Rate. Center for Disease Control. 2011 [Google Scholar]
- 27.Dower GE. The ECGD - a Derivation of the Ecg from Vcg Leads. Journal of electrocardiology. 1984;17(2):189–191. doi: 10.1016/s0022-0736(84)81094-8. [DOI] [PubMed] [Google Scholar]
- 28.Tse Z, Dumoulin G, Clifford G, Jerosch-Herold M, Kacher D, Kwong R, Stevenson W, Schmidt E. Real-ECG extraction and stroke volume from MR-Compatible 12-Lead ECGs; testing during stress, in PVC and in AF patients. Journal of Cardiovascular Magnetic Resonance. 2011;13(Suppl 1):6. [Google Scholar]
- 29.Abächerli R, Pasquier C, Odille F, Kraemer M, Schmid J-J, Felblinger J. Suppression of MR gradient artefacts on electrophysiological signals based on an adaptive real-time filter with LMS coefficient updates. Magnetic Resonance Materials in Physics, Biology and Medicine. 2005;18(1):41–50. doi: 10.1007/s10334-004-0093-1. [DOI] [PubMed] [Google Scholar]
- 30.Glover PM, Bowtell R. Measurement of electric fields induced in a human subject due to natural movements in static magnetic fields or exposure to alternating magnetic field gradients. Physics in medicine and biology. 2008;53(2):361–373. doi: 10.1088/0031-9155/53/2/005. [DOI] [PubMed] [Google Scholar]
- 31.Sansone M, Mirarchi L, Bracale M. Adaptive removal of gradients-induced artefacts on ECG in MRI: a performance analysis of RLS filtering. Medical & biological engineering & computing. 2010;48(5):475–482. doi: 10.1007/s11517-010-0596-z. [DOI] [PubMed] [Google Scholar]


