Abstract
Background and Objectives
Early demineralization appears with high contrast at near-IR wavelengths due to a ten to twenty fold difference in the magnitude of light scattering between sound and demineralized enamel. Water absorption in the near-IR has a significant effect on the lesion contrast and the highest contrast has been measured in spectral regions with higher water absorption. The purpose of this study was to determine how the lesion contrast changes with lesion severity and depth for different spectral regions in the near-IR and compare that range of contrast with visible reflectance and fluorescence.
Materials and Methods
Forty-four human molars were used in this in vitro study. Teeth were painted with an acid-resistant varnish, leaving a 4×4 mm window on the occlusal surface of each tooth exposed for demineralization. Artificial lesions were produced in the unprotected windows after 12–48 hr exposure to a demineralizing solution at pH-4.5. Near-IR reflectance images were acquired over several near-IR spectral distributions, visible light reflectance, and fluorescence with 405-nm excitation and detection at wavelengths greater than 500-nm. Crossed polarizers were used for reflectance measurements to reduce interference from specular reflectance. Cross polarization optical coherence tomography (CP-OCT) was used to non-destructively assess the depth and severity of demineralization in each sample window. Matching two dimensional CP-OCT images of the lesion depth and integrated reflectivity were compared with the reflectance and fluorescence images to determine how accurately the variation in the lesion contrast represents the variation in the lesion severity.
Results
Artificial lesions appear more uniform on tooth surfaces exposed to an acid challenge at visible wavelengths than they do in the near-IR. Measurements of the lesion depth and severity using CP-OCT show that the lesion severity varies markedly across the sample windows and that the lesion contrast in the visible does not accurately reflect the large variation in the lesion severity. Reflectance measurements at certain near-IR wavelengths more accurately reflect variation in the depth and severity of the lesions.
Conclusion
The results of the study suggest that near-IR reflectance measurements at longer wavelengths coincident with higher water absorption are better suited for imaging early caries lesions.
Keywords: demineralization, dental caries, enamel, near-IR imaging, polarization
INTRODUCTION
Light scattering in sound dental enamel varies markedly from the UV to the near-IR and exhibits the highest transparency near 1310-nm [1,2]. At this wavelength, the attenuation coefficient is only 2 to 3 cm−1, which is a factor of 20 to 30 times lower than in the visible region [2]. At longer wavelengths, water absorption increases significantly and reduces the penetration of the near-IR light. Even though the light scattering for sound enamel is at a minimum in the near-IR, the light scattering coefficient of enamel increases by 2–3 orders of magnitude upon demineralization due to the formation of pores. These pores are of a similar size scale to the wavelength of the light and act as Mie scatterers [3].
Several studies have demonstrated that caries lesions can be imaged with high contrast in the near-IR [4–7]. Recent studies on both natural occlusal lesions [8] and artificial lesions on the occlusal surfaces [7] indicate that the contrast is highest for those wavelengths coincident with higher water absorption, such as 1450-nm. Since dentin has a higher water content than enamel, it is likely that water absorption in the underlying dentin reduces the intensity of light reflected from sound areas and this increases the contrast of lesion areas. Early enamel white spot lesions can be discriminated from sound enamel by visual observation or by visible-light diffuse reflectance imaging [9,10]. Recent studies have shown that very high lesion contrast can be attained for very shallow lesions by using shorter wavelength blue light [11]. Blue light is scattered to a greater degree in sound enamel than longer wavelengths in the visible and near-IR [12–14]. Monte Carlo simulations in that same paper suggest that the optimal spectral region for the highest lesion contrast depends on the lesion depth and severity and that shorter wavelengths are likely to yield higher contrast for shallow lesions while longer wavelengths should yield higher contrast for deeper lesions [11].
In a recent study comparing the contrast of artificial lesions on tooth occlusal surfaces [7] at several wavelengths, we observed that the uniformity of the lesion contrast varied markedly with wavelength. In the visible the lesions appeared highly uniform, while in the near-IR the lesions contrast varied considerably. Images taken of those samples with optical coherence tomography and histological examination using polarized microscopy showed that the lesions were highly variable and were not uniform in either depth or severity. This was more consistent with the large variations in the lesion contrast observed at near-IR wavelengths. More extensive studies over a greater range of lesion severity are required to determine the optimum performance ranges for each of these imaging methods. A greater sensitivity of lesion contrast to variation in the lesion severity should make it easier to monitor changes in the lesion severity over time.
In order to reliably produce lesions on tooth occlusal surfaces, those surfaces have to be cleaned and all stains need to be removed. The removal of the outside layer of fluoride rich enamel is often necessary to facilitate lesion development. The surface roughness may modify the specular and diffuse scattering from the surface and this surface scattering can profoundly influence both the reflectivity and fluorescence. There is some concern that the method of sample preparation may increase the surface roughness and surface scattering. Therefore, two methods of surface preparation were investigated: air abrasion and mechanical polishing (prophy). The surface wetness also profoundly influences the lesion contrast. Clinicians routinely blow air to dry the tooth surface when inspecting tooth surfaces for lesions. Since water absorption varies markedly in the near-IR, surface water is likely to have an even greater influence on the lesion contrast than in the visible, for that reason tooth surfaces were imaged both wet and dry.
Optical coherence tomography (OCT) is a well-established imaging method that can be used to acquire depth resolved images of demineralization in teeth. Different approaches have been proposed over the past decade to quantify the severity of demineralization from conventional and cross-polarization OCT images [15–17]. Strong specular reflection from the tooth surface is greatly reduced in the cross-polarization OCT image allowing direct integration of the reflectivity from lesion areas near the tooth surface [16,18–21]. This also greatly facilitates automated analysis, which is required to handle the great wealth of data contained in OCT images [22,23]. Three dimensional tomographic OCT scans can be converted to two dimensional images of the calculated lesion depth and the reflectivity integrated over the calculated lesion depth (ΔR, dB × µm) that are well suited for representing the severity of demineralization [7,24]. The unit ΔR is analogous to the unit ΔZ, the integrated mineral loss with depth, which is measured with microradiography and is considered the gold standard for lesion severity. Previous studies have shown that ΔR correlates with ΔZ [18]. Therefore, lesion severity in the context of this paper will be defined as the integrated reflectivity over the depth of the lesion, ΔR. This approach is quite valuable for monitoring lesion severity both in vivo and in vitro and for comparing the inhibition of demineralization by various anti-caries agents. Two dimensional projections of the OCT images in the calculated depth and ΔR formats are also advantageous for comparison with other 2D optical imaging methods such as reflectance imaging and florescence imaging. The intensity in these images represents either the reflectivity integrated over the depth or the loss in intensity over depth. One goal of this study is to directly compare these OCT image formats pixel by pixel with reflectance and fluorescence images to determine how the image contrast changes with both lesion severity and lesion depth in the different spectral bands.
The purpose of this study was to determine how the lesion contrast changes with lesion severity and depth for different spectral regions in the near-IR and compare that range of contrast with visible reflectance and fluorescence. This was achieved by comparing the acquired fluorescence and reflectance images with two dimensional images of the lesion depth and integrated reflectivity measured using cross polarization optical coherence tomography.
MATERIALS AND METHODS
Artificial Lesion Sample Preparation
Forty-four extracted posterior teeth were collected from patients in the San Francisco Bay area with approval from the UCSF Committee on Human Research. The teeth were sterilized using gamma radiation and stored in 0.1% thymol solution to maintain tissue hydration and prevent bacterial growth. Samples were initially separated into four groups based on the surface preparation technique and the duration of exposure to demineralization solution. The occlusal surface of each tooth in groups 1, 3 & 4 were prepared by an air abrasion technique employing a constant flow of 25–50 µm Al3O2 glass beads for twenty seconds to remove debris and surface staining from the pits and fissures. The occlusal surfaces of teeth in group 2 were prepared using the conventional prophy method, consisting of a two stroke application using a slow speed hand piece at maximum speed (Butler Eez-Touch prophy angle and Whip Mix Preppies non-fluorinated pumice), followed by a 15 minute treatment in an ultrasonic cleaner (Branson 3510) to remove any residual pumice. All samples were mounted in black orthodontic acrylic blocks (Great Lakes Orthodontics, Tonawanda, NY).
A 4×4 mm window, or box, was etched on the occlusal surface of each tooth using a CO2 laser (Impact 2500, GSI lumonics Rugby, UK). The laser was operated at a wavelength of 9.3-µm, pulse duration of 15 µs, and a pulse repetition rate of 5 Hz. During the ablation procedure, the incident fluence was 170 J/cm2 with a spot size of 150 µm, and a water spray was used to regulate the enamel temperature. The 4×4 mm window demarcates the area exposed to demineralization and the 50–100-µm deep etch marks serve as fiducial marks for serial sectioning and polarized light microscopy. The increased resistance to acid dissolution of the laser irradiated perimeter of the window is effective in isolating the sound and demineralized regions and is sufficiently narrow to not interfere with image contrast calculations.
Tooth surfaces outside the window were protected from demineralization solution by application of red acid-resistant varnish (Revlon, New York, NY). Two coats of varnish were applied, and then removed after artificial lesion generation using acetone.
Artificial lesions were produced with the surface softened dissolution model used in prior studies [5,7]. Samples in groups 1, 2, 3 and 4 were submerged in individual vials containing a 50 ml aliquot of Ca/PO4/acetate; 2.0 mmol/L Calcium, 2.0 mmol/L phosphate, and 0.075 mol/L acetate: maintained at a pH 4.5 and incubated at a temperature of 37°C for 12 (2 groups), 24 & 48 hours respectively. This procedure sought to produce groups 1 (n=12), 3 (n=10) and 4 (n=10) with increasing lesion severity and group 2 (n=12) with similar severity to group 1 (dependent of the effective difference between the air abrasion and prophy preparation methods).
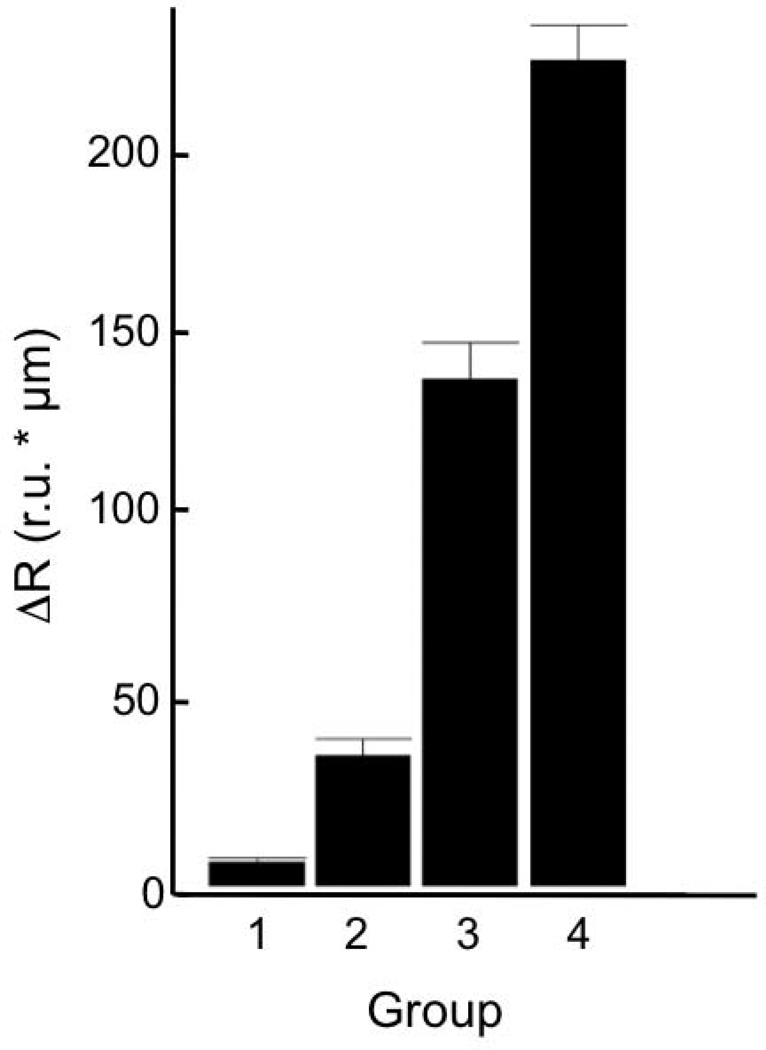
Even after extensive surface preparation to remove variability in lesion generation, there was great variability in the lesion severity from group to group. Therefore, we decided it was advantageous to separate the samples based on their actual depth and severity measured nondestructively with CP-OCT. Groups 1, 2, 3, and 4 are ranked by increasing lesion severity in terms of both mean depth and mean integrated reflectivity. The mean values for each adjusted group with the calculated standard deviation are shown in the chart in Fig. 2 and Table 1.
Fig. 2.
The mean integrated reflectivity ± the standard deviation (s.d.) for adjusted groups 1–4.
TABLE 1.
Mean lesion contrast *100 (s.d) for 12 hr samples prepared with air abrasion and prophy for all filters wet and dry. The mean (s.d) lesion depth and integrated reflectivity (ΔR) for 12 hr samples prepared using air abrasion and prophy.
|
Filter (LP & BP) |
Air Abrasion Dry Mean Contrast |
Prophy Dry Mean Contrast |
Air Abrasion Wet Mean Contrast |
Prophy Wet Mean Contrast |
| LP1100 | 26(7.6) | 23(5.3) | 23(6.1) | 20(5.2) |
| LP1200 | 21(11) | 22(5.3) | 18(8.0) | 18(4.7) |
| LP1300 | 20(11) | 24(10) | 16(9.9) | 14(9.9) |
| LP1400 | 23(13) | 27(17) | 5.1(18) | −8.4(14) |
| LP1500 | 26(14) | 27(14) | 12(15) | −0.45(11) |
| BP1300 | 24(9.1) | 21(4.1) | 25(7.8) | 21(4.1) |
| BP1377 | 25(9.5) | 21(4.2) | 20(12) | 16(6.8) |
| BP1460 | 18(15) | 22(15) | −29 (33) | −31(19) |
| BP1550 | 9.1(12) | 8.5(6.9) | −0.95(8.9) | −3.5(3.6) |
| Visible | 25 (3.5) | 13(4.6) | 13(13) | 10(4.7) |
| QLF | −5.1 (7.3) | −10(8.8) | −18(13) | −14(8.7) |
|
Air Abrasion Depth (µm) |
Prophy Depth (µm) |
Air Abrasion ΔR (IU) |
Prophy Mean ΔR (IU) |
|
| Value | 22(27) | 11(11) | 39(52) | 42(83) |
IU= Linear intensity units (detector volts/ 32 µV)
Polarized Near-Infrared Reflectance Measurements
Strong specular reflectance from tooth surfaces poses a challenge in reflectance imaging due to the high refractive index of enamel. However, the visibility of scattering structures on highly reflective surfaces such as teeth can be enhanced by use of crossed polarizers to remove the glare from the surface [25,26]. For the acquisition of near-IR reflectance images, a tungsten halogen light source with various band pass (BP) and long pass (LP) filters was used with a high sensitivity InGaAs SWIR camera (SU320KTSX-1.7RT/RS170) from Sensors Unlimited (Princeton, NJ) containing a focal plane array format of 320 × 256 pixels and a 25 µm pixel pitch. Incident light was polarized using a linear polarizer and a second linear polarizer was placed on the camera oriented orthogonal to the first. Optical long pass and band pass filters were employed to segregate the near-IR spectrum into wavelength regions of interest, often exploiting the absorption of water, in search for the wavelength range yielding the greatest contrast for surface lesions. Long pass filters with short wavelength cut off’s located at 1100, 1200, 1300, 1400 and 1500-nm, in addition to band pass filters centered at 1300, 1377, 1460 and 1550-nm (Spectrogon, FWHM= 80-nm), were attached to the camera lens. Images were processed with a background, dark reference, then normalized over the spatial distribution of a white reference.
Polarized Visible Light Reflectance Measurements
The contrast between sound and demineralized enamel can be further enhanced by depolarization of the scattered light in the area of demineralized enamel [27,28]. Visible Reflectance images were acquired using an Ocean Optics fiber-coupled tungsten-halogen lamp (Model HL-2000-FHSA) with a DFK 31AF03 FireWire camera outfitted with a MiniInfinimite lens. The light source was equipped with a linear polarizer and the camera was equipped with a second linear polarizer oriented orthogonal relative to the initial polarizer (crossed polarizers) in order to remove specular reflection from the tooth surface.
Laser Induced Fluorescence (QLF) Measurements
Fluorescence or quantitative light fluorescence (QLF) images were captured for direct comparison with polarized near-IR and polarized visible-light reflectance methods. A "Blu-Ray", 405 nm wavelength, GaN diode laser operating at 150 mW (Photonics Products, UK) was used as an excitation source. The 405-nm wavelength is consistent with the best-reported diagnostic performance in clinical QLF systems [29]. A 500-nm long-pass filter (#C47-616, Edmund Scientific, Barrington, NJ) was used to filter the emitted fluorescence and images were acquired with a DFK 31AF03 FireWire camera (Imaging Source, Charlotte, NC) with 1024 × 768 pixels outfitted with a MiniInfinimite lens (Infinity Photo-optical, Boulder, CO) (Figure 1). Data was collected in a `dark room' to avoid ambient room light from entering the camera lens using IC Capture 2.2 software (Imaging Source). Conventional QLF measurements are reported as a contrast ratio of the fluorescence radiance intensity of the apparent lesion area compared to any equivalent sound enamel area.
Fig. 1.
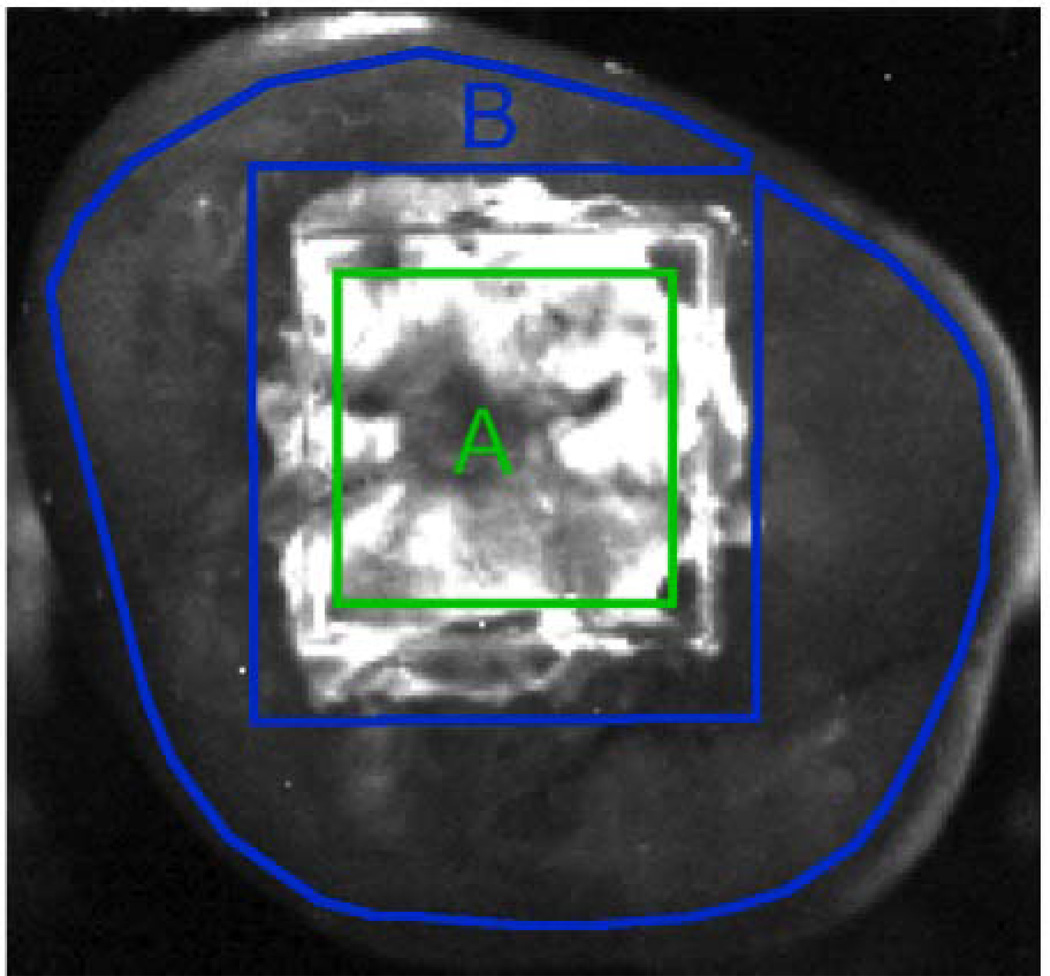
Near-IR reflectance (BP1460 filter) image of a sample from group 4 (most severe). The 3×3 mm area centered in the 4×4 mm window exposed to demineralization is demarcated in green and labeled 'A'. The polygon region outlined in blue and labeled 'B' represents the sound reference area.
Image Analysis
A somewhat novel approach was employed to calculate the lesion contrast from the images. The intensity of a 3×3-mm square region centered in the 4×4-mm lesion area was compared with most of the sound area remaining on the occlusal surface outside the box as shown in Fig. 1. This approach seeks to minimize the effects of tooth topography. Images were analyzed using the image analysis package, IgorPro (Wavemetrics, Lake Oswego, OR). Near-IR and visible-light reflectance contrast ratios were produced using the equation (IL−IS)/IL, because the increased scattering from demineralized tissue produces a greater intensity signal. QLF reflectance contrast measurements have the opposite contrast and were produced using the equation (IS−IL)/IS, because the decreased fluorescence emission from demineralized tissue produces a weaker intensity signal. For each sample, lesion intensity measurements were collected as the mean intensity of a 3×3 mm square region centered within the laser demarcated area. Sound tissue intensities were measured using a polygon method. The polygon method employs a freehand Region of Interest (ROI) tool in order to draw a polygon figure around the entire occlusal surface but excluding the lesion area. Figure 1 illustrates the region selection for both sound and lesion area on a 48 hour sample. Mean intensities for each region were acquired using the ROI function of Igor Pro. The reported contrast values can range from 0 to 1 where a 0 value represents no contrast, a 1 value represents maximum contrast, and negative values represents inverse contrast. The reported lesion contrast ranges from 0 to 1.0 when the lesion intensity is greater than the measured sound intensity. A negative contrast can occur when the measured sound intensity exceeds the lesion intensity and the reported values do not have a confined range. Contrast values were compared using repeated measures one-way analysis of variance (ANOVA) followed by Tukey-Kramer post-hoc multiple comparison tests using InStat statistical software (GraphPad, San Diego, CA).
Tooth Surface Wetness
The amount of water that adheres to the surface of a tooth during imaging can have a profound effect on the lesion contrast observed. Some of the wavelength regions imaged deliberately overlap distinct near-IR water absorption bands. All samples were imaged in both a dry state, where samples were sprayed with air for a 5 second duration before imaging, and a wet state where they were imaged immediately after removal from the water/thymol storage solution without air drying.
Polarization Sensitive Optical Coherence Tomography (PS-OCT)
Several studies have demonstrated that the reflectivity in the cross polarization (CP) image integrated over the lesion area, ∆R (dB(decibels) × µm), correlates with ∆Z, the integrated mineral loss (Vol.% mineral × µm) determined using transverse microradiography [16,18–20]. An all-fiber optical coherence domain reflectometry (OCDR) system from Optiphase (Van Nuys, CA) employing high-speed piezoelectric fiber-stretchers, polarization maintaining (PM) optical fibers, and two balanced InGaAs receivers was used for in vitro data collection. This two-channel (∞ & ‖) system was integrated with a broadband superluminescent diode (SLD) (Denselight, Jessup, MD) operating at a center wavelength of 1317 nm and spectral bandwidth full-width half-maximum (FWHM) of 84 nm. A high-speed XY-scanning system (ESP 300 controller and 850G-HS stages, National Instruments, Austin, TX) was used to scan the sample area. The high power (15-mW) polarized SLD source was aligned using a polarization controller to deliver full power into the slow axis (∞) of the source arm of the interferometer. The light in the PM fiber was split into the reference and sample arms of the interferometer by a 50/50 PM-fiber coupler. The sample arm was coupled into an AR-coated fiber-collimator to produce a 6 mm diameter collimated beam and focused onto the sample surface using a 20-mm focal length AR-coated planoconvex lens. Configuring the PS-OCT system in this manner produced data sets with a lateral resolution of approximately 20 µm and axial resolution of 10 µm in air with a signal to noise ratio greater than 40–50 dB. The resolution in enamel is even greater because of the higher refractive index (n=1.63). The instrument was controlled by a program written with LabVIEW software (National Instruments, Austin, TX). Individual A-scans were compiled into B-scan cross sectional slices that are aggregated into 3D files.
Automated PS-OCT Image Analysis for Lesion Depth and Integrated Reflectivity
Optical Coherence Tomographic scans were assessed to evaluate lesion quality on a basis of lesion depth and the integrated reflectivity over the lesion depth, using a program written with LabVIEW. The program derived two-dimensional projections of the lesion depth and integrated reflectivity on a per-point basis for use in the assessment of lesion contrast image accuracy and utility [24].
Raw OCT data was linearized and an outlying region of each b-scan was measured as the background noise value and operated to yield the mean background intensity and standard deviation [24]. Four times the background standard deviation plus the mean background intensity was used as a thresholding value to ensure with 99.994% certainty that the accepted signal exceeded the noise [22,23]. A Gaussian blur was applied through a convolution matrix for the elimination of speckle noise, retention of signal peaks and choosing of integration boundaries. The data set was thresholded a second time, before any depth or integrated reflectivity calculations were performed, to discriminate peaks from sound tissue and that of demineralized enamel. It was empirically determined through analysis of sound samples that demineralized enamel can be identified as having a greater than or equal to 90% contrast for signal amplitude relative to background signal [22,23]. Peaks for which this threshold is not met are considered to be sound.
For the determination of lesion depths and integration boundaries, an edge-detection approach was used which identified the enamel surface and the deep lesion boundary by application of an edge locator. The OCT data was rescaled to range from 0 to the maximum value by subtraction of the minimum noise level. The depth of the lesion is calculated by locating the upper and lower lesion boundaries of the lesion signal by identifying the first pixels that fail to met the requirement of being greater than or equal to Ae−2, where A is the peak maximum. The spatial dimensions per-pixel were obtained experimentally by system calibration and applied properly in order to convert pixel depths to micrometer depths. In a prior study, reported OCT lesion depths were verified by histological examination of sectioned samples and measurement using PLM [24].
Integrated reflectivity calculations were achieved by standard integration of the signal peak, within the boundaries identified by the previous method. The values reported are in micron × volts/3.2 × 10−5.
The reported mean depth and mean integrated reflectivity values represent the mean values over the entire 3×3-mm windows.
Thematic Mapping and Accuracy Analysis
Assessing the accuracy of near-IR and visual reflectance images, on a point-by-point basis, was carried out using a LabView program based on thematic mapping solutions presented by Congalton and Green [30]. Near-IR and visible reflectance images were converted into contrast images scaling from 0 to 1.0 based on the sound intensity of each sample and then transformed into depth and integrated reflectivity maps using linear regression. The manufactured images were then compared with a 2D OCT depth and integrated reflectivity projections as reference, by automatically matching and overlaying the same 3×3 mm regions evaluated in the mean contrast measurements. Pixel values from the near-IR maps were compared to the reference and categorized based on their accuracy as a true representation of the local depth or integrated reflectivity. True assessments classified values within 25% (based on the standard deviation of the regression fit) of the reference value, and greater or lesser values classified the lesion as: over or under-estimates, respectively. The point-by-point classification was used to produce an overall accuracy map indicating where the contrast values correctly or incorrectly represent the actual lesion severity.
RESULTS
Influence of Surface Preparation on Lesion Contrast
There was some concern that the method chosen for mechanical removal of stain and the fluoride rich outer layer of the enamel in the sample window could significantly alter the surface roughness and the lesion contrast. Two groups (n=12) with sample surfaces treated by air abrasion and prophy techniques were compared with 12 hr lesions both wet and dry. The calculated mean lesion depth and mean integrated reflectivity in the sample windows calculated from OCT along with the lesion contrast values measured using reflectance and fluorescence are tabulated in Table 1. A statistical comparison using a simple t-test between each method indicates that the values are all statistically similar and we can conclude that air abrasion does not significantly roughen the surface and alter the contrast.
Lesion Severity Classification based on OCT
Lesion generation is highly variable in the occlusal surfaces, even after extensive cleaning of those surfaces with air abrasion. Therefore, we decided to measure the lesion depth and integrated reflectivity using OCT for the 12 (2 groups), 24 and 48 hour sample sets after lesion generation and separate the samples into four groups based on increasing mean integrated reflectivity (lesion severity) from 1 to 4. The distribution of the adjusted groups is shown in Fig. 2 and Table 2. The mean integrated reflectivity was chosen to represent the lesion severity because it has been shown to correlate with ∆Z, the integrated mineral loss which is used as the standard measure of lesion severity [16,18–20].
TABLE 2.
The mean (s.d) depths and integrated reflectivity (ΔR) for adjusted groups 1, 2, 3 & 4.
| Group | Depth (µm) | ΔR (IU) |
|---|---|---|
| 1 | 3.9(2.8) | 6.5(4.1) |
| 2 | 21.5(10.8) | 35.7(16.2) |
| 3 | 63.4(10.5) | 139(28.1) |
| 4 | 84.2(22.8) | 226(32.9) |
IU= Linear intensity units (detector volts/ 32 µV)
Contrast Measurements of Dry Sample Groups
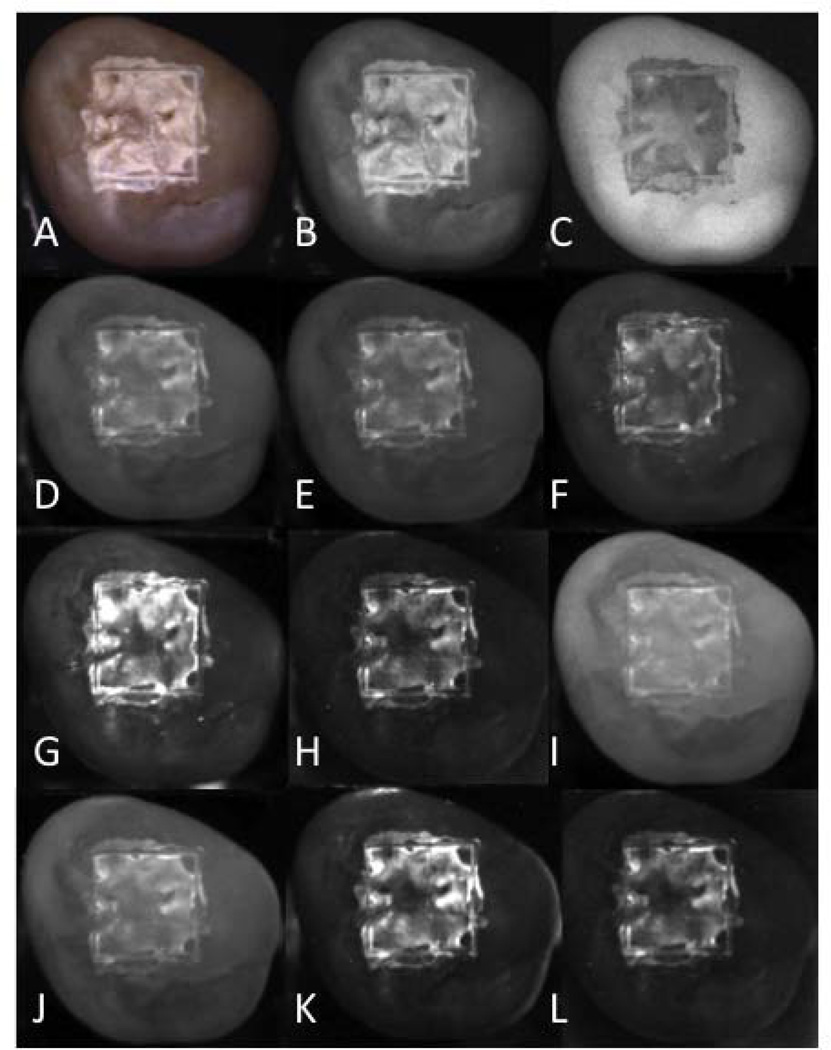
Figure 3 contains multispectral images of one sample taken from group 4 (the most severe lesions), acquired using fluorescence, visible and near-IR reflectance with various long pass (LP) and band pass (BP) filters. Teeth were removed from a water/thymol solution and were air-dried for 5 seconds. A major factor in the lesion contrast is the intensity of the sound tooth region surrounding the laser-demarcated area. The sound areas appear with the lowest intensity in spectral regions coincident with higher water absorption, namely H, K & L of Fig. 3.
Fig. 3.
Set of lesion images for one sample from group 4 (most severe). (A) visible reflectance color image, (B) visible reflectance grayscale, (C) fluorescence (405/500-nm), (D) LP1100, (E) LP1200, (F) LP1300, (G) LP1400, (H) LP1500, (I) BP1300, (J) BP1377, (K) BP1460, (L) BP1550.
The contrast values for the multispectral measurements are tabulated in Table 3 for each imaging method with both wet and dry surfaces. Contrast values are consistently higher for near-IR reflectance in the spectral regions coincident with higher water absorption, the LP1400, BP1460 and LP1500 groups. Reflectance with the LP1500 filter yields the highest contrast for less severe lesions, groups 1 & 2 and reflectance with the BP1460 filter yields the highest contrast for the more severe lesion groups, 3 & 4.
TABLE 3.
Mean lesion contrast *100 (s.d) for wet and dry samples of varying severity increase from group 1–4. Groups with the same letter are statistically similar P>0.05.
|
DRY Filter |
Group 1 |
Stat. group |
Group 2 |
Stat. group |
Group 3 |
Stat. group |
Group 4 |
Stat. group |
| a)LP1100 | 22(5.0) | a-h, j | 27(3.6) | a-h, j | 23(7.9) | a-c, f-g,i, k | 32(7.4) | a-c, g, i-k |
| b)LP1200 | 19(8.0) | a-h, j | 22(3.3) | a-h, j | 25(8.5) | a-c, f-g, i-k | 35(8.7) | a-c, g, i-j |
| c)LP1300 | 18(8.0) | a-h, j | 23(8.6) | a-h, j | 29(7.9) | a-g, i-k | 40(8.0 | a-c, g, i-j |
| d)LP1400 | 20(13) | a-h, j | 28(11) | a-h, j | 35(12) | c-e, h, j | 52(12) | d-e, h |
| e)LP1500 | 22(9.1) | a-h, j | 28(15) | a-h, j | 38(14) | c-e, h, j | 54(13) | d-e, h |
| f)BP1300 | 20(5.5) | a-h, j | 24(4.4) | a-h, j | 20(7.2) | a-c, g, i, k | 20(4.8) | g, k |
| g)BP1377 | 20(6.2) | a-h, j | 22(4.2) | a-h, j | 23(6.0) | a-c f, i, k | 30(8.8) | a-c, h-j |
| h)BP1460 | 15(9.6) | a-j | 23(17) | a-h, j | 42(9.8) | d-e, j | 56(14) | d-e |
| i)BP1550 | 6.7(5.4) | h | 9.5(9.1) | - | 18(8.8) | a-c, f, g, j | 35(13) | a-c, g, j |
| j)Visible | 16(6.4) | a-h | 22(9.9) | a-h | 36(6.5) | b-e, h | 40(9.0 | a-c, g |
| k) QLF | −8.4(6.1) | - | −5.6(12) | - | 18(10) | a-c, e-f, i | 24(16) | a, f-g |
|
WET Filter |
Group 1 |
Stat. group |
Group 2 |
Stat. group |
Group 3 |
Stat. group |
Group 4 |
Stat. group |
| a)LP1100 | 21(6.3) | a-c, f-g, j | 21(4.6) | a-c, f-g, j | 13(7.3) | a-c, f-g, j | 13(7.6) | a-c, e-g, j |
| b)LP1200 | 17(7.6) | a-c, e-g, j | 18(5.0) | a-c, e-g, j | 11(8.3) | a-c, f-g, j | 12(8.4) | a-c, e-g, j |
| c)LP1300 | 13(8.7) | a-c, e-g, i-j | 12(14) | a-c, e-g, j | 6.0(11) | a-g, j | 7.6(8.9) | a-g, i-k |
| d)LP1400 | −2.0(17) | d-e, i-k | −3.3(14) | d-e, i-k | −3.7(8.1) | c-e, h-i, k | −2.8(16) | c-e, g-i, k |
| e)LP1500 | 4.3(14) | b-e, g, i-k | 4.3(11) | b-e, g, i-j | −4.3(13) | c-e, g-i, k | 7.1(15) | a-e, i, k |
| f)BP1300 | 21(5.3) | a-c, g, j | 25(6.9) | a-c, f-g, j | 18(7.6) | a-c, g, j | 16(6.6) | a-c, g, j |
| g)BP1377 | 15(10) | a-c, e-g, j | 17(10) | a-c, e-f, j | 12(9.1) | a-c, e-f, j | 9.9 (11) | e-g, j-k |
| h)BP1460 | −31(27) | k | −37(27) | - | −12(17) | d-e, i, k | −13(17) | d, i, k |
| i)BP1550 | 0.9(4.7) | c-e, j-k | −5(5.1) | d-e, k | −6.8(3.8) | d-e, h, k | −2.9(8.2) | c-e, h, k |
| j)Visible | 10(5.5) | a-g, i | 11(13) | a-g | 16(5.3) | a-c, f-g | 17(4.9) | a-c, f-g |
| k)QLF | −16(9.6) | d, h-i | −14(11) | d, i | −4.3(9.8) | d-e, h-i | −1.8(13) | c-e, g-i |
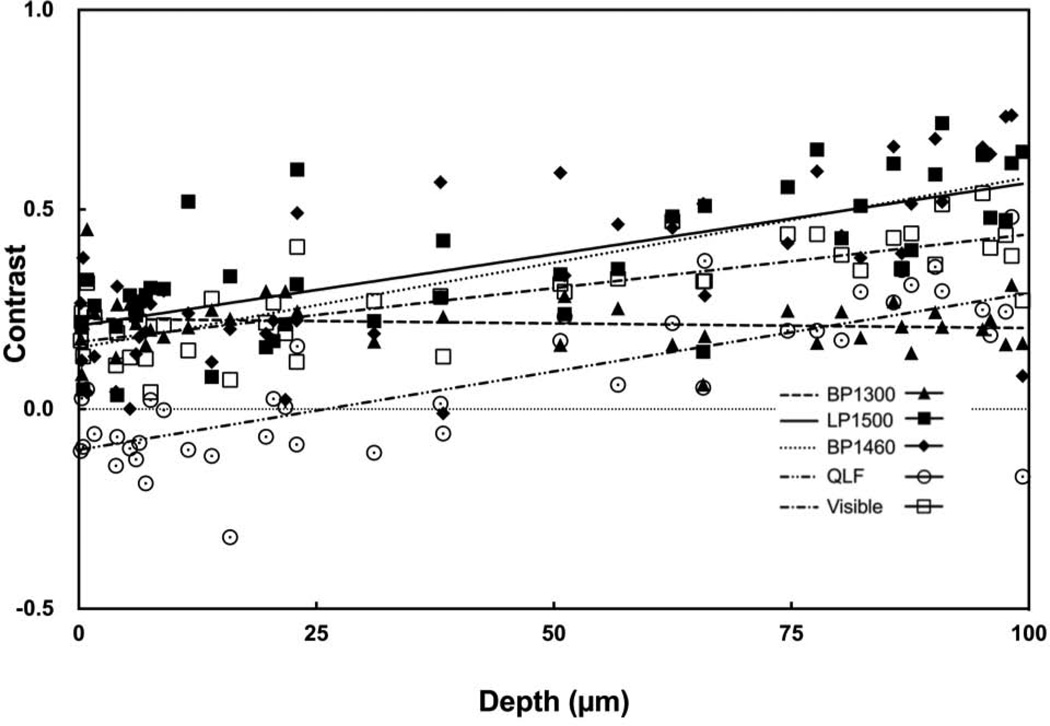
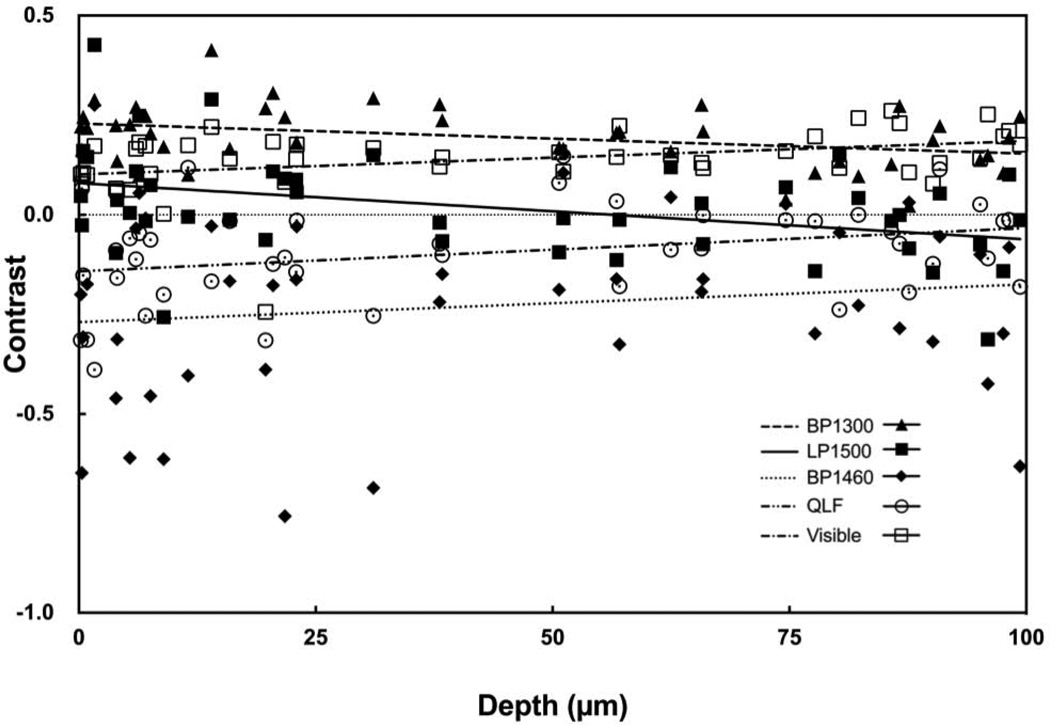
Near-IR reflectance with the LP1400, BP1460 and LP1500 filters produced the greatest range of lesion contrast values and the contrast increased linearly with increasing lesion depth and severity. Figure 5 contains plots of the contrast values for BP1300, LP1500, BP1460 and visible reflectance along with QLF versus the mean depth measured with OCT. Best fit lines are also shown for each of the five groups. The respective slopes and correlation coefficients are tabulated in Table 4 for both wet and dry samples. The BP1460 filter was chosen for point-by-point lesion mapping analysis based on the large linear increase with lesion depth and severity.
Fig. 5.
Plot of the measured lesion contrast for dry samples vs. the mean lesion depth determined using OCT. Data for visible reflectance, QLF, and near-IR reflectance with BP1300, BP1460 and LP1500 are shown along with the best fit linear regression lines.
TABLE 4.
The slope and correlation coefficients for the best fit lines correlating the lesion contrast to the CP-OCT depth and integrated reflectivity (ΔR) data for each spectral band for both wet and dry samples. A (+) in the Sig. column indicates that the slope was significantly different from zero (P< 0.05).
| DRY | LP1100 | LP1200 | LP1300 | LP1400 | LP1500 | BP1300 | BP1377 | BP1460 | BP1550 | Visible | QLF | |
|---|---|---|---|---|---|---|---|---|---|---|---|---|
| Depth | Slope* | 10 | 17 | 24 | 36 | 36 | − 2.3 | 11 | 43 | 34 | 27 | 40 |
| R2 | 0.26 | 0.43 | 0.56 | 0.55 | 0.53 | 0.017 | 0.27 | 0.52 | 0.67 | 0.62 | 0.59 | |
| Sig. | + | + | + | + | + | − | + | + | + | + | + | |
| ΔR | Slope* | 3.2 | 5.8 | 8.4 | 13 | 13 | −1.1 | 3.0 | 16 | 12 | 9.7 | 15 |
| R2 | 0.32 | 0.44 | 0.47 | 0.47 | 0.023 | 0.14 | 0.46 | 0.55 | 0.53 | 0.58 | 0.32 | |
| Sig. | + | + | + | + | + | − | + | + | + | + | + | |
| WET | ||||||||||||
| Depth | Slope* | − 9.9 | − 7.5 | − 7.1 | − 2.6 | − 8.0 | − 8.0 | − 8.5 | 18 | − 1.6 | 7.8 | 14 |
| R2 | 0.22 | 0.12 | 0.062 | 0.0043 | 0.049 | 0.15 | 0.087 | 0.080 | 0.0094 | 0.12 | 0.17 | |
| Sig. | + | + | − | − | − | + | − | − | − | + | + | |
| ΔR | Slope* | − 4.5 | − 3.0 | − 3.0 | − 0.6 | − 3.2 | − 3.5 | − 4.0 | 7.8 | − 0.8 | 3.0 | 6.6 |
| R2 | 0.30 | 0.13 | 0.072 | 0.0016 | 0.051 | 0.19 | 0.13 | 0.097 | 0.016 | 0.12 | 0.25 | |
| Sig. | + | + | − | − | − | + | + | + | − | + | + | |
multiplied by 10000.
Contrast Measurements of Wet Sample Groups
It is well known that the presence of saliva and water on the tooth surface can profoundly reduce the contrast of early demineralization. Clinicians routinely air dry suspected lesion areas to increase contrast. Understanding how the apparent lesion contrast evolves with varying degrees of surface wetness will likely be important for near-IR reflectance imaging.
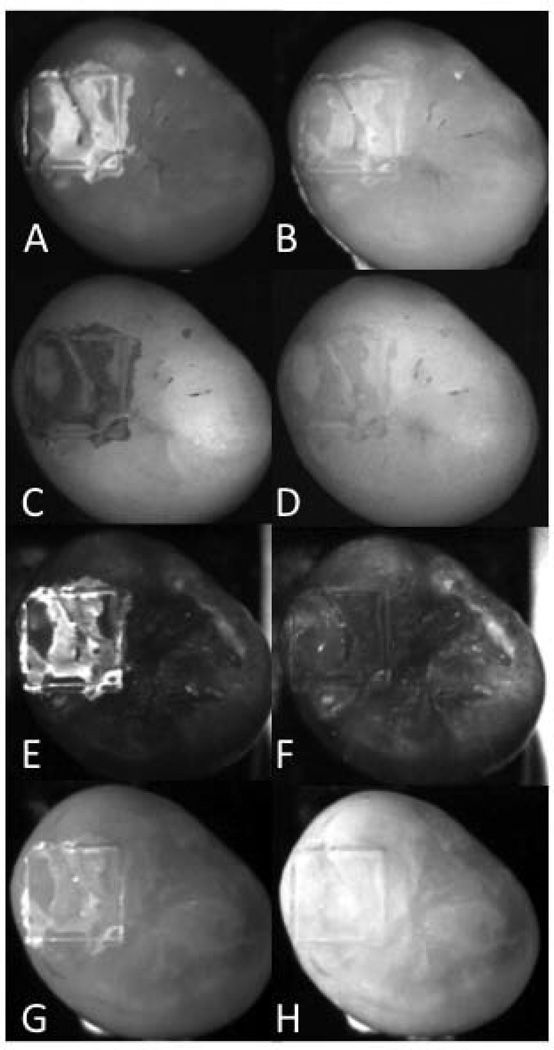
Table 3 lists the reflection contrast measurements for groups 1–4 acquired with a wet occlusal surface. Samples were removed from a water/thymol solution and were not air-dried. There was a marked reduction in contrast compared to the dry measurements recorded on the same group for most of the methods. The greatest changes in lesion contrast occurred for near-IR reflectance with the LP1400, BP1460 and LP1500 filters coincident with water absorption bands. Lesions areas that manifested very high contrast values when observed while dry actually became darker than the surrounding sounds areas due to water filling the pores and absorbing the incident light, namely the contrast went from positive to negative. At wavelengths where water absorption was lower, visible and BP1300, the reduction in contrast was smaller. Although it appears that there is a linear increase in contrast for the wet samples in the visible the slope of the line is small and not significantly different from zero.
Figure 4 shows QLF and reflectance images (visible, BP1460 and BP1300 filters) for a 48 hour sample (group 4 lesion). The reduction in lesion contrast is most remarkable for QLF and near-IR reflectance with the BP1460 filter, the lesion almost completely vanishes when wetted.
Fig. 4.
Comparison of dry (left) and wet (right) images of a group 4 lesion. (A–B) Visible, (C–D) fluorescence (405/500), (E–F) BP1460 and (G–H) BP1300.
Figure 6 contains the corresponding plots of the contrast values for BP1300, LP1500, BP1460 and visible reflectance along with QLF versus the mean depth measured with OCT for wet surfaces. The integrated reflectivity shows similar trends. Visible and QLF behave similarly when dry and wet with a reduction in the initial contrast of early lesions and a reduced slope with increasing lesion severity for wet samples. BP1460 exhibits a positive slope when the tooth surface is wet but it is not significantly different from zero. BP1300 exhibits similar behavior when both dry and wet.
Fig. 6.
Plot of the measured lesion contrast for wet samples vs. the mean lesion depth determined using OCT. Data for visible reflectance, QLF, and near-IR reflectance with BP1300, BP1460 and LP1500 are shown along with the best fit linear regression lines.
Accuracy of BP1460 and Visible Images with PS-OCT
Point-by-point near-IR (BP1460) and visible reflectance images of the 3×3 mm lesion area (ROI) were compared with PS-OCT 2D depth and integrated reflectivity maps representing the lesion severity. The lesion depth and integrated reflectivity for each pixel in the visible and near-IR images were calculated using the linear fits shown in Fig. 5 for the dry samples. These values were compared on a pixel by pixel basis with the depths measured using PS-OCT and the difference in values (error) is represented by confusion maps.
Point by point near-IR (BP1460) and visible images of 3×3 mm lesion areas (ROI) were compared with PS-OCT 2D depth and integrated reflectivity maps representing the lesion severity. The lesion depth and integrated reflectivity for each pixel in the visible and near-IR images were calculated using the linear fits shown in Fig. 5 for dry samples. By automatically overlaying the identical regions using a pattern-matching algorithm, a pixel-by-pixel value comparison of the reflectance imaging method and reference PS-OCT measurements produced a difference in values (error) data set represented by confusion maps.
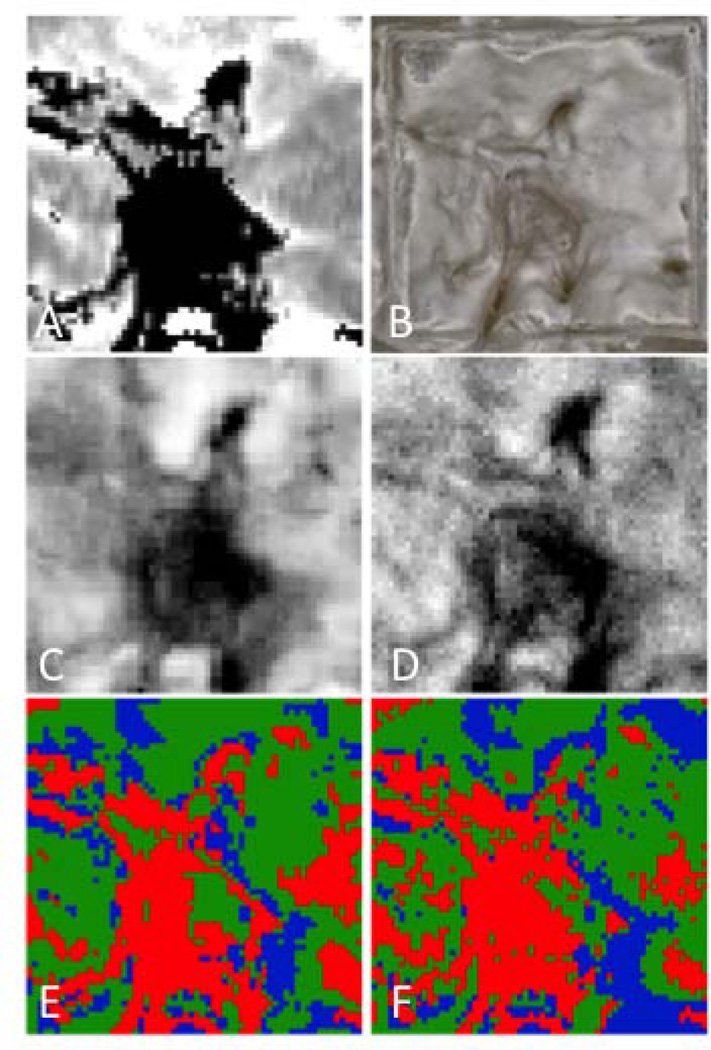
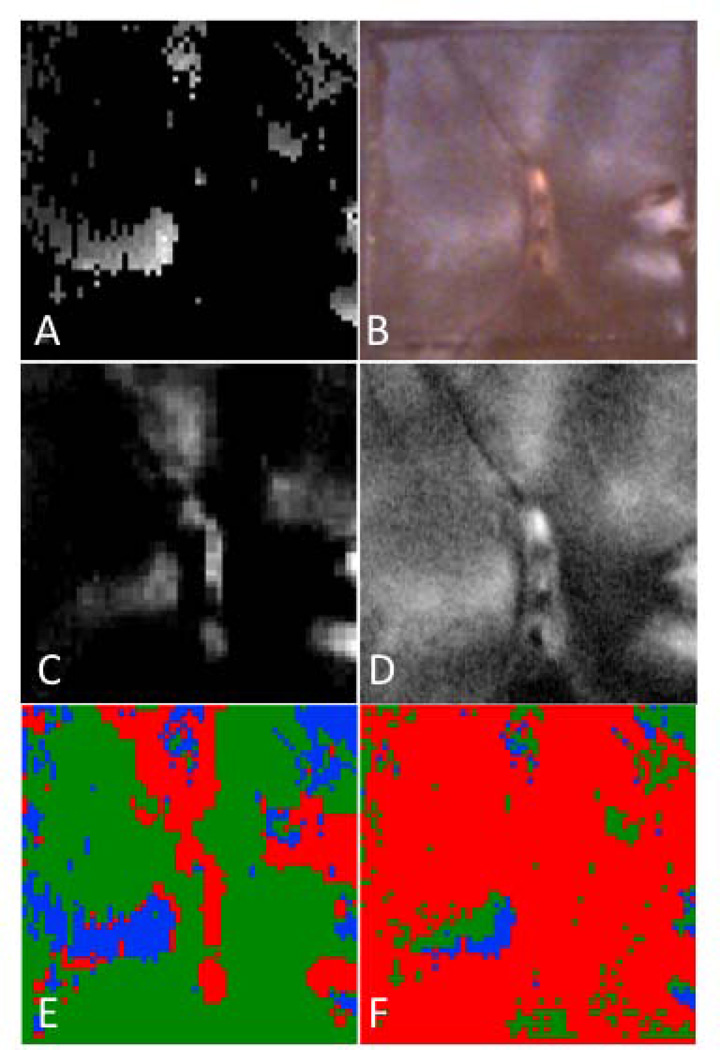
Figure 7 shows the respective depth based images of the 3×3 mm region of interest (ROI) for a group 4 lesion along with the corresponding confusion maps. Figure 8 is an analogous set of images to those shown in Fig. 7, but representative of the integrated reflectivity measure of severity and corresponding accuracy for a less severe, group 1 lesion. Confusion maps classified pixels as true representations of the lesion severity if the value was within 25% (based on the standard deviation of the regression fit) of the reference, and as overestimates or underestimates outside that range. Figures 9 & 10 represent the distribution of pixel-by-pixel accuracy assessments, based on depth and integrated reflectivity respectively, for BP1460 and visible reflectance methods on a group basis.
Fig. 7.
Maps of the calculated lesion depth for a group 4 sample. (A) Lesion depth from OCT, (B) Visible depth composition image from digital microscope, (C) Lesion depth from near-IR (BP1460), and (D) Lesion depth from visible. Confusion maps of lesion depth comparing OCT lesion depths vs. near-IR (BP1460) (E) and visible (F). Green is true, blue is underestimate and red is overestimate.
Fig. 8.
Maps of the integrated reflectivity with lesion depth (ΔR) for a group 1 sample. (A) Lesion depth from OCT, (B) Visible reflectance image, (C) Lesion integrated reflectivity with lesion depth from near-IR (BP1460), and (D) from visible. Confusion maps of lesion depth comparing OCT depths vs. near-IR (BP1460) (E) and visible (F). Green is true, blue is underestimate and red is overestimate.
Fig. 9.
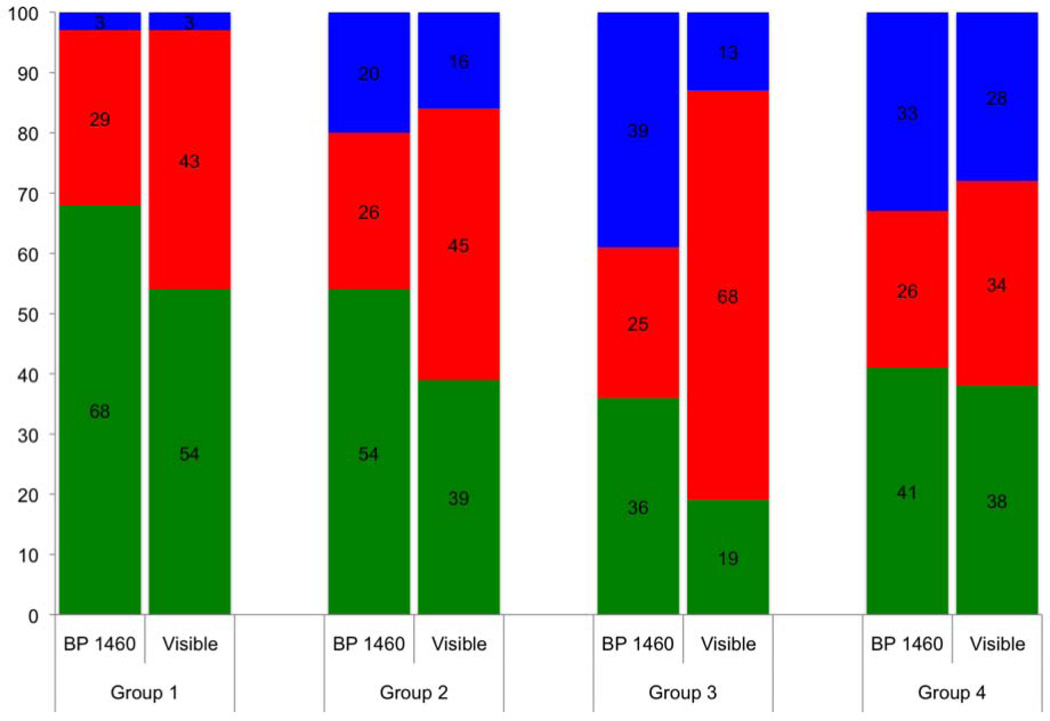
Stacked bar graph showing accuracy of lesion depth assessment for each lesion group for visible and near-IR (BP1460) reflectance based on point by point comparison with the lesion depth determined using OCT. Green is true, blue is underestimate and red is overestimate.
Fig. 10.
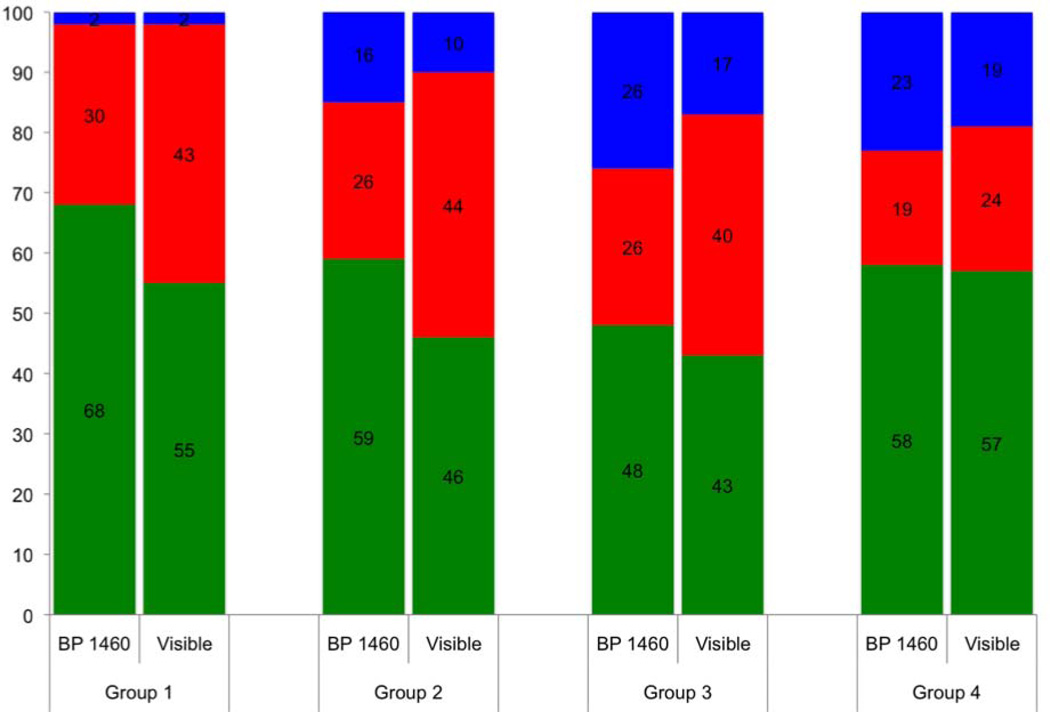
Stacked bar graph showing accuracy of lesion severity assessment for each lesion group for visible and near-IR (BP1460) reflectance based on point by point comparison with the integrated reflectivity with lesion depth (ΔR) determined using OCT, Green is true, blue is underestimate and red is overestimate.
The lesion depth and integrated reflectivity values were more often overestimated for visible reflectance, while more often underestimated with near-IR reflectance. More pixels were accurately classified for less severe lesions (groups 1–3) with near-IR reflectance than with visible reflectance. The two methods become similar in accuracy for the most severe lesions (group 4). The near-IR reflectivity is better able to show variation of the lesion severity.
DISCUSSION
Previous studies have shown that near-IR reflectance measurements yield very high contrast of early caries lesions, particularly at those near-IR wavelengths coincident with high water absorption. However, the lesion contrast is expected to be highly dependent on the lesion severity and studies suggest that the wavelengths which yield the highest contrast of lesions with a particular depth and severity may not yield the highest contrast for other shallower lesions or for other lesion types with different mineral profiles. Moreover, an imaging method that shows a concomitant increase in lesion contrast with increasing lesion severity is more useful since the lesion severity can more easily be estimated from the images. In this study we measured the lesion contrast for four lesion groups of varying severity with mean depths ranging from 4 to 84-µm in different spectral regions. Several filters were used to measure the reflectance in different near-IR spectral ranges and in the visible. We also measured the contrast of fluorescence (QLF) for comparison. There are studies that suggest higher contrast can be obtained by using blue light instead of including all the visible wavelengths [11]. The emphasis of this study was on the near-IR, therefore we did not explore different spectral regions in the visible range in this study. In addition, visible light absorption by stains is a major problem for tooth occlusal surfaces. In a recent study of natural lesions in the occlusal surfaces of extracted teeth [8], the image contrast was actually negative as opposed to being positive in visible reflectance measurements indicating that absorption due to stains contributed more than increased scattering due to demineralization to the reflectivity in the visible. Therefore, visible reflectance is of questionable utility in areas that are subject to heavy staining, namely the areas where most lesions are likely to develop. In fact, visible light reflectance was proposed almost three decades ago for use in monitoring early demineralization on tooth surfaces but has proven to be unsuccessful due to the problems indicated above [10].
Near-IR reflectance at wavelengths coincident with higher water absorption produced the greatest range of lesion contrast values and the contrast increased linearly with increasing lesion depth and severity (Fig. 5). A greater sensitivity of lesion contrast to variation in the lesion severity should make it easier to gauge the severity of lesions in occlusal surfaces. The higher accuracy of near-IR reflectance for early lesions, is likely due to higher sensitivity to equivalent changes in lesion depth and severity and are therefore better suited for monitoring changes in lesion severity over time.
In this paper, we also demonstrate the utility of cross-polarization OCT images converted to the calculated depth and ΔR formats for providing a map of the lesion severity. Reflectance images of a specific region of interest on the tooth surface were compared pixel by pixel with the lesion depth and the reflectivity integrated over the lesion depth to show how accurately the lesion contrast in that image represents the actual variation in lesion severity. This analysis also assesses the ability of near-IR and visible reflectance methods to provide reliable information about the local severity of a lesion in terms of depth and integrated reflectivity, and how that accuracy evolves with a developing (growing) lesion. Evaluating imaging methods in this manner may identify the parameters where optical contrast has great accuracy in diagnosis, and a threshold where contrast information has effectively reached a plateau.
We also explored the influence of the surface wetness on the lesion contrast. The surface wetness causes a profound reduction in the lesion contrast for both fluorescence and reflectance measurements. Wavelengths coincident with water absorption are more profoundly affected. Therefore, it is necessary to air dry tooth surfaces before performing reflectance measurements. One would think that it would not be feasible clinically to use near-IR reflectance at those wavelengths due to the high sensitivity to water. However, we have successfully acquired high contrast in vivo images of early lesions in tooth occlusal surfaces at 1480-nm and 1610-nm in preliminary clinical imaging studies using broadband superluminescent light sources. This was achieved without using a longer period of air drying than is required for visible images. Monitoring the changes in lesion contrast with air drying has been shown to be useful for assessing lesion activity. Lesions with a well-defined surface zone are considered less active and the surface zone acts as a barrier to water diffusion, and the rate of water loss is lower, since wavelengths coincident with water absorption bands manifest greater changes in contrast with water loss. Therefore, those wavelengths are likely better suited for monitoring the rate of dehydration or water loss.
We also established in this study that air abrasion can be used to clean tooth occlusal surfaces without significant changes in the lesion contrast. This is important because it is very difficult to produce lesions on tooth occlusal surfaces due to stains, debris and the fluoride rich outer layer of enamel.
In conclusion, this study shows that reflectance measurements at longer near-IR wavelengths, coincident with higher water absorption have significant advantages over other methods for imaging caries lesions. These advantages include minimal interference from stains and discoloration, very high lesion contrast over a wide range of lesion severity and a linear increase in the lesion contrast with increasing lesion severity.
Acknowledgements
Supported by NIH/NIDR R01-DE14698 and R01-DE17869. The authors would like to thank William Fried for his help with these studies.
REFERENCES
- 1.Fried D, Featherstone JDB, Glena RE, Seka W. The nature of light scattering in dental enamel and dentin at visible and near-IR wavelengths. Appl Optics. 1995;34(7):1278–1285. doi: 10.1364/AO.34.001278. [DOI] [PubMed] [Google Scholar]
- 2.Jones RS, Fried D. Lasers in Dentistry VIII. Vol. 4610. San Jose: SPIE; 2002. Attenuation of 1310-nm and 1550-nm Laser Light through Sound Dental Enamel; pp. 187–190. [Google Scholar]
- 3.Darling CL, Huynh GD, Fried D. Light Scattering Properties of Natural and Artificially Demineralized Dental Enamel at 1310-nm. J Biomed Optics. 2006;11(3):034023. doi: 10.1117/1.2204603. [DOI] [PubMed] [Google Scholar]
- 4.Lee D, Fried D, Darling CL. Lasers in Dentistry XV. Vol. 71620. San Jose: SPIE; 2009. Near-IR multi-modal imaging of natural occlusal lesions; pp. X1–X7. [DOI] [PMC free article] [PubMed] [Google Scholar]
- 5.Wu J, Fried D. High contrast near-infrared polarized reflectance images of demineralization on tooth buccal and occlusal surfaces at λ = 1310-nm. Lasers in Surgery and Medicine. 2009;41(3):208–213. doi: 10.1002/lsm.20746. [DOI] [PMC free article] [PubMed] [Google Scholar]
- 6.Zakian C, Pretty I, Ellwood R. Near-infrared hyperspectral imaging of teeth for dental caries detection. Journal of Biomedical Optics. 2009;14(6):064047. doi: 10.1117/1.3275480. [DOI] [PubMed] [Google Scholar]
- 7.Fried WA, Darling CL, Chan K, Fried D. High Contrast Reflectance Imaging of Simulated Lesions on Tooth Occlusal Surfaces at Near-IR Wavelengths. Lasers Surg Med. 2013;45:533–541. doi: 10.1002/lsm.22159. [DOI] [PMC free article] [PubMed] [Google Scholar]
- 8.Chung S, Fried D, Staninec M, Darling CL. Multispectral near-IR reflectance and transillumination imaging of teeth. Biomed Opt Express. 2011;2(10):2804–2814. doi: 10.1364/BOE.2.002804. [DOI] [PMC free article] [PubMed] [Google Scholar]
- 9.Angmar-Mansson B, ten Bosch JJ. Optical methods for the detection and quantification of caries. Adv Dent Res. 1987;1(1):14–20. doi: 10.1177/08959374870010010601. [DOI] [PubMed] [Google Scholar]
- 10.ten Bosch JJ, van der Mei HC, Borsboom PCF. Optical monitor of in vitro caries. Caries Res. 1984;18:540–547. doi: 10.1159/000260818. [DOI] [PubMed] [Google Scholar]
- 11.Zhang L, Nelson LY, Seibel EJ. Spectrally enhanced imaging of occlusal surfaces and artificial shallow enamel erosions with a scanning fiber endoscope. Journal of Biomedical Optics. 2012;17(7):076019. doi: 10.1117/1.JBO.17.7.076019. [DOI] [PMC free article] [PubMed] [Google Scholar]
- 12.Spitzer D, ten Bosch JJ. The absorption and scattering of light in bovine and human dental enamel. Calcif Tiss Res. 1975;17:129–137. doi: 10.1007/BF02547285. [DOI] [PubMed] [Google Scholar]
- 13.Fried D, Glena RE, Featherstone JD, Seka W. Nature of light scattering in dental enamel and dentin at visible and near-infrared wavelengths. Applied optics. 1995;34(7):1278–1285. doi: 10.1364/AO.34.001278. [DOI] [PubMed] [Google Scholar]
- 14.Zijp JR, ten Bosch JJ, Groenhuis RA. HeNe laser light scattering by human dental enamel. J Dent Res. 1995;74:1891–1898. doi: 10.1177/00220345950740121301. [DOI] [PubMed] [Google Scholar]
- 15.Amaechi BT, Higham SM, Podoleanu Ag, Rodgers JA, Jackson DA. Use of Optical Coherence Tomography for Assessment of Dental caries. J Oral Rehab. 2001;28(12):1092–1093. doi: 10.1046/j.1365-2842.2001.00840.x. [DOI] [PubMed] [Google Scholar]
- 16.Fried D, Xie J, Shafi S, Featherstone JD, Breunig TM, Le C. Imaging caries lesions and lesion progression with polarization sensitive optical coherence tomography. Journal of Biomedical Optics. 2002;7(4):618–627. doi: 10.1117/1.1509752. [DOI] [PubMed] [Google Scholar]
- 17.Sowa MG, Popescu DP, Friesen JR, Hewko MD, Choo-Smith LP. A comparison of methods using optical coherence tomography to detect demineralized regions in teeth. J Biophotonics. 2011;4(11–12):814–823. doi: 10.1002/jbio.201100014. [DOI] [PMC free article] [PubMed] [Google Scholar]
- 18.Jones RS, Darling CL, Featherstone JD, Fried D. Imaging artificial caries on the occlusal surfaces with polarization-sensitive optical coherence tomography. Caries research. 2006;40(2):81–89. doi: 10.1159/000091052. [DOI] [PubMed] [Google Scholar]
- 19.Manesh SK, Darling CL, Fried D. Polarization-sensitive optical coherence tomography for the nondestructive assessment of the remineralization of dentin. Journal of Biomedical Optics. 2009;14(4):044002. doi: 10.1117/1.3158995. [DOI] [PubMed] [Google Scholar]
- 20.Ngaotheppitak P, Darling CL, Fried D. Measurement of the severity of natural smooth surface (interproximal) caries lesions with polarization sensitive optical coherence tomography. Lasers in Surgery and Medicine. 2005;37(1):78–88. doi: 10.1002/lsm.20169. [DOI] [PubMed] [Google Scholar]
- 21.Chong SL, Darling CL, Fried D. Nondestructive measurement of the inhibition of demineralization on smooth surfaces using polarization-sensitive optical coherence tomography. Lasers Surg Med. 2007;39(5):422–427. doi: 10.1002/lsm.20506. [DOI] [PubMed] [Google Scholar]
- 22.Le MH, Darling CL, Fried D. Automated analysis of lesion depth and integrated reflectivity in PS-OCT scans of tooth demineralization. Lasers Surg Med. 2010;42(1):62–68. doi: 10.1002/lsm.20862. [DOI] [PMC free article] [PubMed] [Google Scholar]
- 23.Kang H, Jiao JJ, Chulsung L, Le MH, Darling CL, Fried DL. Nondestructive Assessment of Early Tooth Demineralization Using Cross-Polarization Optical Coherence Tomography. Selected Topics in Quantum Electronics, IEEE Journal of. 2010;16(4):870–876. doi: 10.1109/JSTQE.2009.2033610. [DOI] [PMC free article] [PubMed] [Google Scholar]
- 24.Chan KH, Chan AC, Fried WA, Simon JC, Darling CL, Fried D. Use of 2D images of depth and integrated reflectivity to represent the severity of demineralization in cross-polarization optical coherence tomography. J Biophotonics. 2013 doi: 10.1002/jbio.201300137. (In press). [DOI] [PMC free article] [PubMed] [Google Scholar]
- 25.Benson PE, Ali Shah A, Robert Willmot D. Polarized versus nonpolarized digital images for the measurement of demineralization surrounding orthodontic brackets. Angle Orthod. 2008;78(2):288–293. doi: 10.2319/121306-511.1. [DOI] [PubMed] [Google Scholar]
- 26.Everett MJ, Colston BW, Sathyam US, Silva LBD, Fried D, Featherstone JDB. Lasers in Dentistry V. Vol. 3593. San Jose: SPIE; 1999. Non-invasive diagnosis of early caries with polarization sensitive optical coherence tomography (PS-OCT) pp. 177–183. [Google Scholar]
- 27.Fried D, Xie J, Shafi S, Featherstone JDB, Breunig T, Lee CQ. Early detection of dental caries and lesion progression with polarization sensitive optical coherence tomography. J Biomed Optics. 2002;7(4):618–627. doi: 10.1117/1.1509752. [DOI] [PubMed] [Google Scholar]
- 28.Fried D, Featherstone JDB, Darling CL, Jones RS, Ngaotheppitak P, Buehler CM. In: Early Caries Imaging and Monitoring with Near-IR Light. Boston DW, editor. Philadelphia: W. B Saunders Company; 2005. pp. 771–794. [DOI] [PubMed] [Google Scholar]
- 29.Zhang L, Nelson LY, Seibel EJ. Red-shifted fluorescence of sound dental hard tissue. Journal of Biomedical Optics. 2011;16(7):071411. doi: 10.1117/1.3606572. [DOI] [PubMed] [Google Scholar]
- 30.Congalton RG, Green K. Assessing the Accuracy of Remotely Sensed Data: Principles and Practices. CRC Press; 2009. [Google Scholar]


