

Background: Thioredoxin-interacting protein (TXNIP) is a redox sensor that opposes glucose uptake and glycolytic metabolism.
Results: TXNIP-deficient skeletal muscles lose capacity for ketone and branched chain amino acid oxidation due to deficits in specific mitochondrial dehydrogenases.
Conclusion: TXNIP permits muscle use of alternative respiratory fuels during glucose deprivation.
Significance: Dysregulation of TXNIP might contribute to aberrant fuel selection in the context of metabolic disease.
Keywords: Diabetes, Energy Metabolism, Ketone Body Metabolism, Mitochondrial Metabolism, Redox, Skeletal Muscle Metabolism, Branched Chain Amino Acids, Thioredoxin Interacting Protein
Abstract
Thioredoxin-interacting protein (TXNIP) is an α-arrestin family member involved in redox sensing and metabolic control. Growing evidence links TXNIP to mitochondrial function, but the molecular nature of this relationship has remained poorly defined. Herein, we employed targeted metabolomics and comprehensive bioenergetic analyses to evaluate oxidative metabolism and respiratory kinetics in mouse models of total body (TKO) and skeletal muscle-specific (TXNIPSKM−/−) Txnip deficiency. Compared with littermate controls, both TKO and TXNIPSKM−/− mice had reduced exercise tolerance in association with muscle-specific impairments in substrate oxidation. Oxidative insufficiencies in TXNIP null muscles were not due to perturbations in mitochondrial mass, the electron transport chain, or emission of reactive oxygen species. Instead, metabolic profiling analyses led to the discovery that TXNIP deficiency causes marked deficits in enzymes required for catabolism of branched chain amino acids, ketones, and lactate, along with more modest reductions in enzymes of β-oxidation and the tricarboxylic acid cycle. The decrements in enzyme activity were accompanied by comparable deficits in protein abundance without changes in mRNA expression, implying dysregulation of protein synthesis or stability. Considering that TXNIP expression increases in response to starvation, diabetes, and exercise, these findings point to a novel role for TXNIP in coordinating mitochondrial fuel switching in response to nutrient availability.
Introduction
Thioredoxin-interacting protein (TXNIP),2 also known as vitamin D3 up-regulated protein 1 (1) and thioredoxin-binding protein 2 (2), is a ubiquitously expressed 46-kDa protein that binds to the catalytic center of thioredoxin (TXN), an antioxidant protein that regulates the reversible oxidation/reduction of protein thiols/disulfides (3, 4). Thus, TXNIP serves as a negative regulator of TXN activity and sensitizes the cell to oxidative stress (2). Structurally, TXNIP belongs to the α-arrestin superfamily of proteins that are characterized by a two-lobe, immunoglobulin-like β-strand sandwich motif (5). Recent findings suggest that at least some biological functions of TXNIP are mediated via the arrestin domain rather than its redox-sensitive cysteine residues (6).
Evidence that TXNIP plays a critical role in metabolic regulation first came to light when the hyperlipidemic phenotype of the HcB-19/Dem (HcB-19) mouse strain was linked to a nonsense mutation in the Txnip gene, resulting in complete loss of the protein. In addition to hypertriglyceridemia, hypercholesterolemia, and increased secretion of triglyceride-rich lipoproteins (3), HcB-19 mice have abnormally high levels of free fatty acids and ketones during food restriction, suggesting perturbations in either the production or clearance of these fuels (3, 7–9). Many of the same metabolic features were recapitulated in three additional mouse models with targeted disruptions in the Txnip gene (10–13).
In addition to regulating lipid metabolism, strong evidence has established a central role for TXNIP in cellular glucose homeostasis. Numerous studies in cultured cells have shown that overexpression of TXNIP lowers glucose uptake, whereas silencing of the gene imparts the opposite effect (14). Likewise, each of the foregoing mouse models of TXNIP deficiency is characterized by fasting-induced hypoglycemia, improved glucose tolerance, enhanced insulin sensitivity, and increased glucose transport into peripheral tissues (10–13). Notably, this insulin-sensitive phenotype is maintained even when TXNIP null animals are fed a high fat diet (10, 11) or bred into the obese, ob/ob background (15), raising interest in this protein as a potential antidiabetic drug target.
The molecular mechanisms underlying the profound metabolic consequences of TXNIP deficiency appear to be highly complex and tissue dependent. Previous studies have implicated perturbations in pancreatic insulin secretion (8), hepatic glucose output (13), Akt signaling (11), glucose transporter 1 trafficking (16), NLRP3 inflammasome activation (17), and oxidative stress (18). There is growing suspicion that at least some of these outcomes are secondary to mitochondrial dysfunction and impaired oxidative metabolism. For example, oxidation rates of 14C-labeled glucose, fatty acids, and ketones are lower in isolated skeletal muscles from TXNIP knock-out (TKO) mice compared with their littermate controls (11), and pyruvate oxidation is disrupted in heart mitochondria from TKO mice (19). Most notably, in both cell culture and animal models, deletion of Txnip results in robust increases in lactate production (3, 9, 11, 13, 14, 19), a strong biomarker of oxidative insufficiency.
Whereas the foregoing observations have fueled widespread speculation surrounding a critical role for this protein in regulating mitochondrial function, rigorous experimental evidence to support this presumption is sparse. The purpose of the present study was to further delineate the connection between TXNIP and oxidative metabolism in skeletal muscle and liver. To this end, we employed targeted metabolomics and comprehensive bioenergetic analyses to evaluate oxidative metabolism and respiratory kinetics in mouse models of total body and skeletal muscle-specific Txnip deficiency. In aggregate, our results show that TXNIP is not required for normal functioning of the electron transport chain (ETC), but is essential for maintaining skeletal muscle protein abundance of specific mitochondrial dehydrogenase enzymes that permit switching from glucose to alternative fuels. These findings shed new insight into the physiological function of TXNIP and the metabolic turmoil caused by its deficiency.
EXPERIMENTAL PROCEDURES
Animal Studies
Animal studies were approved by the Duke University Institutional Animal Care and Use Committee. Generation of the total body Txnip knock-out (TKO) and Txnip homozygous floxed control (TXNIPfl/fl) mice has been previously described (11). Skeletal muscle-specific knock-out mice (TXNIPSKM−/−) were generated by breeding TXNIPfl/fl mice with transgenic mice expressing Cre recombinase under control of the mouse myogenin promoter and MEF2C (myo-CreTg/0), which express Cre recombinase exclusively in skeletal muscle but not heart. All lines were backcrossed >6 generations to the C57BL/6J background. Male mice were used for all studies. Animals were housed in a temperature-controlled environment with a 12-h light:12-h dark cycle and allowed ad libitum access to standard chow (Purina Rodent Chow no. 5015, Purina Mills, St. Louis, MO) and water. On the day of sacrifice, food was removed from cages 5–6 h prior to harvesting tissues and blood.
Metabolic Phenotype Parameters
For glucose tolerance tests, mice were fasted 6 h prior to an intraperitoneal injection of 1.75 g/kg of glucose and blood glucose and lactate levels were measured from the tail using a glucometer (BD Medical, Franklin Lakes, NJ) and the Lactate Plus analyzer (Nova Biomedical, Waltham, MA). EDTA plasma collected at 9, 12, and 18 weeks of age were stored at −20 °C prior to analysis of triglycerides (Sigma, 337-B), non-esterified fatty acids (Wako Chemicals, Richmond, VA), and ketone bodies (acetone, acetoacetate, and β-hydroxybutyrate) (Hitachi 911 clinical chemistry analyzer). Plasma lactate assay was assayed spectrophotometrically (20) at 340 nm using a SpectroMax spectrophotometer (Molecular Devices, Silicon Valley, CA).
Exercise Testing
Mice were habituated for three consecutive days prior to exercise testing by exposing them to a stationary treadmill set at a 10% incline for 5 min, followed by 1-min intervals at speeds of 6, 9, and 12 m/min. The high-intensity treadmill test began with a 5-min 0-m/min acclimation period followed by a speed of 15 m/min, which was then increased at increments of 3 m/min every 3 min to a maximal pace of 30 m/min. Mice ran to exhaustion, defined as 10 consecutive seconds on the shock grid. Peak VO2 and the respiratory exchange ratio (RER) were measured by indirect calorimetry using the Comprehensive Laboratory Animal Monitoring System (CLAMS) attached to an enclosed treadmill (Columbus Instruments, Columbus, OH). Endurance exercise was conducted on an open field six-lane treadmill set at a 10% incline. Following a 5-min 0 m/min acclimation period, the speed was raised to 6 m/min and increased by 2 m/min every 5 min until exhaustion.
Mitochondrial Isolation
Mitochondria from gastrocnemius muscles were isolated by differential centrifugation using one of two methods. For respiratory function and enzyme assays, we used a protease digestion method involving 2 min exposure to 0.5 mg/ml of Type XXIV protease (Sigma) (20). Liver mitochondria and muscle mitochondria used for Western blot analyses were harvested using a mechanical preparation devoid of proteases. Tissues were homogenized in KMEM buffer (100 mm KCl, 50 mm MOPS, 1 mm EGTA, 5 mm MgSO4, 1 mm ATP, pH, 7.4) with a Teflon pestle and centrifuged at 500 × g to remove cell debris. The supernatants were then centrifuged at 10,000 × g to isolate mitochondria, followed by three slower centrifugations (7,000 × g, 7,000 × g, and 3,500 × g) for washing. The mitochondrial pellet was resuspended in 250 μl of KMEM or SET buffer (250 mm sucrose, 1 mm EDTA, 10 mm Tris-HCl, 2 mm ATP, pH 7.4). The protein concentration was assayed using the BCA kit (Sigma).
Substrate Oxidation
Fatty acid and pyruvate oxidation rates were determined by measuring the production of [14C]CO2 from either 0.625 μCi/ml of [1-14C]palmitate (100 μm palmitate bound to 0.15% BSA) or 0.625 μCi/ml of [2-14C]pyruvate (1 mm pyruvate with 0.15% BSA) (21). Leucine oxidation rates were determined by measuring the production of [14C]CO2 from 2.5 μCi/ml of [U-14C]leucine (100 μm). Isolated mitochondria were resuspended to 0.8 μg/μl in SET buffer and transferred to incubation buffer (pH 7.8) consisting of 62.5 mm sucrose, 12.5 mm potassium phosphate, 100 mm potassium chloride, 1.25 mm magnesium chloride, 2.5 mm carnitine, 0.25 mm malic acid, 1.25 mm DTT, 2 mm NAD+, 2 mm ATP, 10 mm Tris-HCl, 0.5 mm CoA, 0.1 mm pyroxidal phosphate, 0.4 mm thiamine pyrophosphate, and 0.5 mm α-ketoglutarate. Added to the final volume of incubation buffer were appropriate volumes of lipoyl dehydrogenase (5 units/ml) and branched-chain amino acid (BCAA) transaminase, where 1 unit converts 1.0 μmol of leucine per minute to 2-ketoisocaproate at 37 °C in the presence of α-ketoglutarate and pyroxidal phosphate. The incubation buffer was kept in a shaking water bath at 37 °C for at least 3 h before use to allow for conversion of the radiolabeled leucine to its labeled intermediate, 2-ketoisocaproate.
Isolated Muscle Incubations
[1-14C]Palmitate oxidation and [U-14C]leucine oxidation in intact soleus and extensor digitorum longus (EDL) muscles were conducted as described in Refs. 20 and 22. A similar procedure was used for measuring [U-14C]glucose oxidation in low calcium (Krebs Henseleit) KHB buffer containing 5 mm glucose, 0.5 mm carnitine, and 12.5 mm HEPES ± 100 nm insulin (23). Incubation media was collected for the spectrophotometric assessment of lactate production via the reduction of NAD+ at 340 nm.
Isolated Mitochondrial Oxygen Consumption
Mitochondria were resuspended at 0.5 mg/ml in MiR05 respiration media (24) using BD Oxygen Biosensor plates (BD Biosciences, MA) as described in Ref. 20.
Preparation of Permeabilized Muscle Fibers, Mitochondrial Respiration, and Mitochondrial H2O2 emission in Permeabilized Fiber Bundles
These techniques were adapted from previous methods (25, 26) and as described in Refs. 27 and 28.
Metabolic Profiling
Tissue and plasma metabolites were measured using tandem mass spectrometry (29).
Enzyme Activity Assays
Citrate synthase was assessed using a colorimetric assay (20). Short chain hydroxyl-acyl-CoA dehydrogenase (SCHAD) activity was measured for 10 min at 37 °C in a reaction buffer (pH 6.5) containing 100 mm potassium phosphate, 0.1 mm EDTA, and 0.3 mg/ml of essential fatty acid-free BSA using a modified protocol (30, 31). The rate of disappearance of 0.1 mm NADH at 340 nm upon the addition of 50 μm acetoacetyl-CoA substrate was determined over the linear range of the reaction and normalized to the molar extinction coefficient for NADH (6.22 mm−1 cm−1) and protein content. The β-hydroxybutyrate dehydrogenase (BDH1) activity assay was adapted from Refs. 32 and 33 and measured the reduction of NAD+ at 37 °C over 15 min following the addition of 20 μm 3-hydroxybutyrate to 200 μg of mitochondria in BDH1 activity buffer (50 mm Tris-HCl, 2 mm NAD+, 20 mm sodium hydroxybutyrate, 1 mm KCN, 0.4 μg/ml of rotenone, and 0.4 mg/ml BSA). Isocitrate dehydrogenase (ICD3) (NAD+-dependent) and ICD2 (NADP+-dependent) activities were measured over 10 min (340 nm, 30 °C) following the addition of a mixture of 10 mm citrate and 1.5 mm isocitrate to 150 μg of mitochondria in pre-warmed (37 °C) 70 mm Tris-HCl, pH 7.2, 2 mm NAD+ or NADP+, 2 mm ADP, 8 mm MgCl2, 1 mm MnCl2, and 5 μl/ml of antimycin A (5% in EtOH) (34, 35). Succinate dehydrogenase was assayed by first activating the enzyme by incubating 5–10 μg of mitochondria in 100 mm potassium phosphate buffer (pH 7.4) with 20 mm succinate for 5 min at 37 °C followed by the addition of 2 mm KCN, 200 μm 2,6-dichloroindophenol, and 1.6 mm phenazine methosulfate (35). Succinate dehydrogenase was measured spectrophotometrically (600 nm, 30 °C) based upon the reduction of 2,6-dichlorophenolindophenol (ϵ = 21 mm−1 cm−1) by phenazine methosulfate over 7 min. Branched chain amino acid dehydrogenase (BCKAD) and pyruvate dehydrogenase activity rates were determined by measuring the production of [14C]CO2 from either 1.25 μCi/ml of [1-14C]leucine (100 μm) or 0.625 μCi/ml of [1-14C]pyruvate (1 mm with 0.15% BSA), respectively, using the protocols for leucine and pyruvate oxidation in isolated mitochondria. Reduced (GSH) and oxidized (GSSG) glutathione were measured using the Biotech® GSH/GSSG-412 assay kit (OxisResearch, Portland, OR) optimized for tissues.
Analysis of mRNA Expression
Total RNA was isolated from mixed gastrocnemius muscle using the total RNA isolation kit (Qiagen). RNA quality and quantity were determined with a NanoDrop 8000 (Thermo Scientific). cDNA was synthesized from 1 μg of RNA using the IScript cDNA synthesis kit (Bio-Rad) in a 20-μl reaction volume and diluted 5-fold for subsequent RT-PCR. mRNA abundance was assayed by real-time quantitative PCR using a Prism 7000 with TaqMan real-time master mix and pre-designed/pre-validated FAM-labeled Assays-on-Demand (Applied Biosystems, Foster City, CA). Data were normalized using values from a duplexed reaction using a VIC-labeled 18 S endogenous control (Applied Biosystems).
Mitochondrial DNA Content
Total DNA was extracted from mixed gastrocnemius muscle using phenol/chloroform (25:4) followed by ethanol precipitation (36). The ratio of mitochondrial DNA to nuclear DNA was measured using real-time quantitative PCR by calculating the ratio of the fold-change from the ΔΔCt of a mitochondrial encoded gene (COX1) and a nuclear encoded gene (β-actin).
Protein Expression
Gastrocnemius muscle lysates were prepared using protease and phosphatase inhibitor mixtures and 0.001 μg/μl of microcystin (Sigma). Protein concentrations were determined using a BCA Assay (Sigma) and separated on 4–15% Criterion TGX Precast gels (Bio-Rad). Blots were blocked with 0.45% fish gelatin for 1 h then exposed to primary antibody to detect citrate synthase (Alpha Diagnostics International, San Antonio, TX), oxidative phosphorylation (OXPHOS) complexes (MitoSciences), BDH1, ICD3 (Abcam, Cambridge, UK), BCKAD E1α subunit (generously provided by Dr. Chris Lynch), and TXNIP (generously provided by Dr. Roger Davis). MemCode (Pierce) protein staining served as a loading control for each blot with band intensity being quantified using ImageQuant software (Amersham Biosciences). Proteins were visualized with secondary antibodies labeled with IRDye infrared dyes using an Odyssey CLx Infrared Imaging System and Image Studio software (LI-COR Biosciences, Lincoln, NE). The muscle (A) and heart (B) subunits of the lactate dehydrogenase (LDH) complex were measured colorimetrically by loading 30 μg of gastrocnemius muscle protein onto a 7.5% native polyacrylamide gel (Bio-Rad). Following electrophoresis, the gel was stained in 30 ml of staining solution containing 0.1 m sodium lactate, 1.5 mm NAD, 0.1 m Tris-HCl (pH 8.6), 10 mm NaCl, 5 mm MgCl2, 0.03 mg/ml of phenazine methosulfate, and 0.25 mg/ml nitro blue tetrazolium. Band intensity was quantified using Image Lab 4.1 software (Bio-Rad).
Statistical Analysis
Data are expressed as mean ± S.E. Results were analyzed by Student's t test unless otherwise indicated in the figure legends. A p value less than or equal to 0.05 was considered statistically significant.
RESULTS
TXNIP Deficiency Disrupts Whole Body Energy Metabolism
Previous studies examining the metabolic consequences of total body Txnip deficiency were performed in the context of prolonged food deprivation (18–36 h) (3, 9, 11, 12). To avoid the complexities of the murine starvation response, we examined metabolic regulation during a 5–6-h fast. In the morning after overnight ad libitum feeding and throughout 6 h of food withdrawal, Txnip knock-out (TKO) mice had lower blood glucose levels and higher blood lactate (Fig. 1A). In line with earlier reports, when challenged with an intraperitoneal injection of glucose TKO mice exhibited exquisite glucose tolerance (Fig. 1B), with a trend toward lower insulin levels (Fig. 1C) despite increased body weight (Fig. 1D) and higher circulating levels of lipid-derived fuels such as triglycerides, non-esterified fatty acids, and ketones (Fig. 1E). Because TXNIP is expressed abundantly in skeletal muscle (Fig. 1F), the principal contributor to circulating lactate, we proceeded to examine muscle glucose metabolism ex vivo. In isolated soleus muscles from TKO compared with WT mice, lactate production was increased in both the basal and insulin-stimulated states, whereas glycogen synthesis was elevated only in the latter condition (Fig. 1, G and H). Using the Lox-P/Cre strategy described under “Experimental Procedures,” we generated mice lacking Txnip specifically in skeletal muscle (TXNIPSKM−/−) but retaining expression in heart (Fig. 1I). The metabolic phenotype of these mice was remarkably similar to the TKO line (Fig. 1, J–M), suggesting derangements in skeletal muscle energy metabolism contribute substantially to the phenotype of the TKO model. In summary, these findings are consistent with the idea that genetic ablation of TXNIP promotes glucose uptake and glycolytic metabolism in muscle.
FIGURE 1.

TXNIP deficiency alters whole body energy metabolism. TKO mice and WT littermates were fed a standard chow diet and metabolic parameters were measured at 18–22 weeks unless otherwise noted. A, blood glucose and lactate levels were measured 0–6 h following food withdrawal (n = 6). B, glucose tolerance tests were performed at 12 weeks of age using 1.75 g/kg of glucose administered 6 h after food withdrawal (n = 12). C, serum insulin was measured at 0 and 15 min. D, body weight at 22 weeks. E, plasma triglycerides (TAG), non-esterified fatty acids (NEFA), and β-hydroxybutyrate (BHB) were measured 5 h after food withdrawal at 9–12 weeks of age (n = 6–8). F, TXNIP mRNA tissue distribution was measured by real-time quantitative PCR and normalized to 18S as an endogenous control gene (n = 5). Lactate production (G) and rates of [14C]glucose (H) incorporation into glycogen were measured in isolated soleus muscles incubated 1 h ± 100 nm insulin. I, TXNIP mRNA expression in skeletal muscle and heart from TXNIPSKM−/− and TXNIPfl/fl mice (n = 3). Metabolic parameters of TXNIPSKM−/− mice and TXNIPfl/fl littermate controls were measured at 12–14 weeks of age. J, blood glucose and lactate levels (n = 5). K, glucose tolerance tests (n = 6). L, body weight at sacrifice. M, plasma metabolites (n = 9). Data are mean ± S.E. and results were analyzed by Student's t test (*, p ≤ 0.05 and **, p ≤ 0.001).
TXNIP Deficiency Compromises Exercise Tolerance
The higher glycolytic rates in TKO mice could be due to oxidative deficits, as previously suggested (11). Surprisingly, however, when whole body energy metabolism was monitored by indirect calorimetry during a 72-h period we were unable to detect genotype differences in RER, heat production, and oxygen consumption (data not shown). Physical activity and food consumption were also similar between groups. To further explore the connection between TXNIP and oxidative capacity in the context of increased energetic demand we challenged the mice with two distinct exercise tests. During a graded, high intensity regimen, peak VO2 obtained by TKO mice was 13% lower than that measured in their WT counterparts (Fig. 2A), whereas RER was elevated throughout the test, indicative of a substrate shift toward carbohydrate oxidation (Fig. 2B). Because fatty acid oxidation becomes an essential source of energy during prolonged exercise, we next subjected the animals to a graded, mid-intensity endurance run using an open-air treadmill. Exercise endurance was diminished in TKO mice relative to the WT controls, evidenced by reduced time (78.0 ± 2.19 versus 84.8 ± 1.28 min) and distance (1774 ± 81.8 versus 2035 ± 52.3 m) to exhaustion (Fig. 2, C and D). Circulating levels of β-hydroxybutyrate measured immediately after exercise were elevated in TKO mice, consistent with impaired ketone uptake and/or catabolism (Fig. 2E). Importantly, TXNIPSKM−/− mice exhibited a similar exercise intolerant phenotype during both treadmill tests (Fig. 2, F–J), again implicating muscle as a major site of metabolic dysregulation in the TKO mice. Although these results clearly point to a role for TXNIP in regulating muscle substrate selection, both loss-of-function models maintained considerable oxidative reserve, arguing against a severe defect in mitochondrial respiratory function.
FIGURE 2.

TXNIP deficiency decreases exercise tolerance. TKO mice and WT littermates were subjected to two different treadmill exercises at 12–15 weeks of age. Indirect calorimetry was used to measure peak VO2 (A) and the RER (VCO2/VO2) (B) as a function of workload during a graded, high intensity regimen. Exercise endurance was evaluated using an open-air treadmill and a mid-intensity regimen. Performance was assessed by measuring time (min) (C) and distance (meters) (D) to exhaustion. E, plasma β-hydroxybutyrate was measured prior to and immediately after endurance exercise. Data are expressed as mean ± S.E. from 7 to 8 animals per group. The same tests were administered to TXNIPSKM−/− mice and TXNIPfl/fl littermate controls at 22–24 weeks of age. F, peak VO2. G, RER. H, time; and I, distance to exhaustion. J, plasma β-hydroxybutyrate concentrations. Data are expressed as mean ± S.E. from 5 to 7 animals per group and results were analyzed by Student's t test (*, p ≤ 0.05 and **, p ≤ 0.001). Panels B and G were evaluated using a one-factor analysis of variance and post hoc analysis to determine differences between groups.
TXNIP Deficiency Diminishes Substrate Oxidation in Muscle but Not Liver Mitochondria
We next sought to pinpoint the specific sites of oxidative dysfunction in the TXNIP null condition. Because TXNIP has been implicated in regulating energy metabolism in both skeletal muscle and liver, TKO mice were used to permit direct comparisons between these two tissues. Measurement of substrate oxidation in isolated soleus and EDL muscles revealed marked genotype-dependent deficits in glucose, fatty acid, and amino acid catabolism (Fig. 3, A–C). Notably, whereas TXNIP deficiency lowered glucose and fatty acid oxidation 25–30% in both soleus and EDL, oxidation rates of the BCAA, leucine, were diminished 68% in soleus and 87% in EDL, as compared with WT muscles. Experiments in isolated mitochondria from TKO gastrocnemius muscles produced similar results, again showing moderate declines in pyruvate and palmitate oxidation (Fig. 3, D and E) and a much more striking 75% deficit in leucine oxidation (Fig. 3F). By contrast, oxidation rates of all three substrates were normal in liver mitochondria harvested from TKO compared with WT mice (Fig. 3, G–I). Thus metabolic insufficiencies measured at the whole body level appeared to be due in large part to remodeling of the muscle oxidative machinery.
FIGURE 3.

Substrate oxidation and respiratory function in skeletal muscle and liver mitochondria. Substrate oxidation assays were performed in tissues and mitochondria from TKO mice and WT littermates harvested 5–6 h after food withdrawal. A, oxidation of [U-14C]glucose to CO2 was measured in isolated soleus muscles during a 2-h incubation in modified KHB buffer containing 5 mm glucose ± 100 nm insulin. Oxidation of 500 μm [1-14C]palmitate (B) or 200 μm [U-14C]leucine (C) to CO2 was measured in isolated soleus and EDL muscles during a 2-h incubation in modified KHB (n = 6). Isolated mitochondria from gastrocnemius muscles were used to measure substrate oxidation to CO2 in the presence of 1 mm [2-14C]pyruvate (D), 100 μm [1-14C]palmitate (E), or 100 μm [U-14C]leucine (F) for 30 min (n = 11–12). Isolated mitochondria from liver was used to measure substrate oxidation to CO2 in the presence of 1 mm [2-14C]pyruvate (G), 100 μm [1-14C]palmitate (H), or 100 μm [U-14C]leucine (I) for 30 min (n = 6–12). Gastrocnemius muscles from TKO mice and WT littermate controls were used for Western blot of complexes I-V of the ETC (J) and quantified results (K) were normalized to MemCode staining to control for loading. Respiratory function in situ was measured using permeabilized fiber bundles under state 3 respiration conditions in the presence of saturating (L) or increasing (M) substrate concentrations to determine substrate sensitivity (Km). Data are expressed as mean ± S.E. and results were analyzed by Student's t test (*, p ≤ 0.05 and **, p ≤ 0.001).
TXNIP Deficiency Does Not Affect Mitochondrial Content or Respiratory Function
We questioned whether the foregoing deficits in oxidative metabolism were related to changes in mitochondrial mass and/or respiratory function. Contrary to this possibility, muscle quantities of mitochondrial DNA, citrate synthase protein content, and enzyme activity (not shown), as well as protein abundance of several constituents of the ETC (Fig. 3, J and K), were similar between genotypes. Comprehensive evaluation of respiratory function using isolated mitochondria also proved unremarkable (not shown). More rigorous assessment of respiratory kinetics using permeabilized fiber bundles in combination with a high resolution respirometry system revealed only modest abnormalities in ETC function (Fig. 3L). ADP-stimulated Vmax in the presence of saturating glutamate-malate concentrations was 20% lower in the TKO mice, implying a minor deficit in maximal rates of ATP synthesis at Complex V. When substrate kinetics were analyzed at more physiological, submaximal concentrations, we identified a subtle shift toward increased sensitivity (lower Km) to glutamate (Fig. 3M), suggesting enhanced use of this fuel to provide NADH to Complex I. These findings argue against a major impingement at the level of the ETC.
TXNIP Deficiency Disrupts Redox Balance without Affecting Mitochondrial Reactive Oxygen Species Emission
Because TXNIP is best known for its role in redox regulation, we sought to determine whether the unique form of mitochondrial dysfunction in muscles from the TKO mice might be related to changes in redox balance. To this end, we measured a series of metabolites that report on shifts in cellular energy charge and oxidative stress. Interestingly, despite high rates of glycolysis and lactate production, muscle concentrations of NADH (Fig. 4A) were unchanged in the TKO mice. By contrast, levels of NADPH, which can also arise from glucose metabolism via the pentose-phosphate shunt, were elevated 2.5-fold in the TKO mice (Fig. 4B), resulting in a striking decrease in the NADH/NADPH ratio (Fig. 4C). Conversely, TXNIP deficiency resulted in a 25% decline in muscle concentrations of reduced GSH and a 33% increase in the oxidized form, GSSG (Fig. 4, D–F). Because GSH participates in antioxidant defense, we questioned whether the alterations in redox balance in TKO muscles were related to increased mitochondrial production of reactive oxygen species. On the contrary, when assayed in permeabilized fiber bundles, rates of succinate-supported mitochondrial H2O2 emission trended lower in the TKO group (Fig. 4G). Thus, the metabolic defects in TKO muscles did not appear to result from mitochondrial-derived oxidative stress.
FIGURE 4.
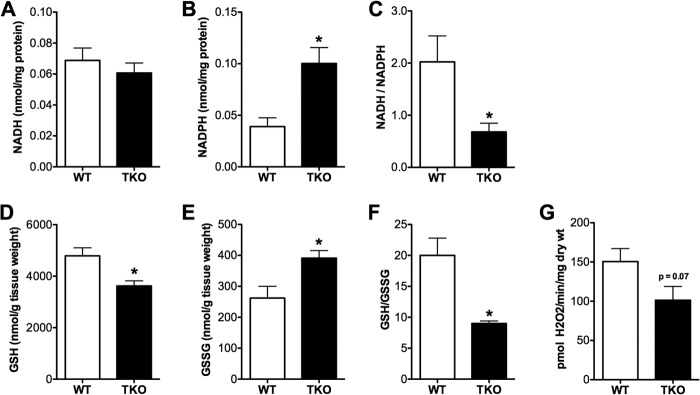
Redox imbalance in TXNIP-deficient skeletal muscles. Skeletal muscles from TKO mice and WT littermate controls were harvested 5 h after food withdrawal and immediately flash frozen in liquid N2 for subsequent assessment of redox metabolites. Gastrocnemius muscles were used to measure NADH (A), NADPH (B), and the NADH/NADPH (C) ratio. Quadriceps muscles were used to measure reduced glutathione (GSH) (D), oxidized glutathione (GSSG) (E), and the GSH/GSSG (F) ratio. G, mitochondrial potential for producing reactive oxygen species was assessed in permeabilized fiber bundles by measuring succinate-supported H2O2 emission rates under state 4 conditions. Data are expressed as mean ± S.E. from 5 to 6 animals per group and results were analyzed by Student's t test (*, p ≤ 0.05).
Targeted Metabolomics Revealed Several Muscle-specific Roadblocks in Mitochondrial Carbon Flux
To gain further insight into the oxidative lesions arising from TXNIP deficiency we used a targeted metabolomics approach to capture a snapshot of intermediary metabolism in vivo. Because mitochondrial degradation of carbon fuels results in the production of multiple acyl-CoA intermediates, we expected muscle quantities of these molecules to change in association with TXNIP expression. A survey of acyl-CoAs in gastrocnemius muscle from TKO compared with WT mice revealed a 35% reduction in acetyl-CoA (Fig. 5A), the universal end product of carbohydrate, fat, and protein catabolism. Additionally, the leucine-derived metabolite, isovaleryl-CoA, was 65% lower in TKO mice (Fig. 5A), and a similar trend was evident for several even chain, fatty acid-derived species (Fig. 5A). By virtue of the mitochondrial carnitine acyltransferase enzymes, the foregoing acyl-CoA intermediates give rise to their corresponding acylcarnitine conjugates, which also report on substrate flux at specific mitochondrial enzymes. Whereas muscle levels of acetyl-CoA-derived acetylcarnitine (C2) were unaffected by genotype (Fig. 5B), most odd chain/amino acid-derived acylcarnitines, as well as several medium and long chain/fatty acid-derived species, were reduced with TXNIP deficiency (Fig. 5B). Long chain acylcarnitines are produced by the carnitine palmitoyltransferase enzymes (CPT1 and CPT2), which reside in the outer and inner mitochondrial membranes, respectively, and catalyze the initial steps in β-oxidation. Although a reduction in total long chain acylcarnitines (Fig. 5B) is consistent with diminished CPT1 activity, tissue concentrations of malonyl-CoA, a potent glucose-derived inhibitor of CPT1 (37), were similar between genotypes (Fig. 5A). Therefore, reduced lipid catabolism in TKO mice did not appear to result from malonyl-CoA-mediated inhibition of fat oxidation.
FIGURE 5.

Targeted metabolic profiling of skeletal muscle and serum. Gastrocnemius muscles and serum from TKO mice and WT littermate controls were harvested 5–6 h following food withdrawal at 18 weeks of age. Tissues were immediately flash frozen in liquid N2 and subsequently processed for mass spectrometry-based measurement of acyl-CoAs (A), acylcarnitines (B), organic acids (C), amino acids (D), and serum amino acids (E). Data are expressed as mean ± S.E. from 5 to 7 animals per group. Results were analyzed by Student's t test (*, p ≤ 0.05 and §, p ≤ 0.10).
In contrast to many other even chain species, levels of 3-hydroxybutyrylcarnitine (C4OH) were robustly elevated in the muscles of TKO mice (Fig. 5B). Because the C4OH metabolite can arise from the ketone intermediate, 3-hydroxybutyryl-CoA (38), this finding is consistent with a severe bottleneck in ketolysis. Muscle concentrations of several glucose-derived organic acids and amino acids (including glycine, alanine, and lactate) were elevated in the TXNIP null condition, whereas intermediates directly involved in anaplerotic entry of carbons into the tricarboxylic acid (TCA) cycle (such as aspartate, glutamate, α-ketoglutarate, and fumarate) were diminished (Fig. 5, C and D). These results are consistent with perturbations in glycolysis and TCA cycle flux and might reflect increased trafficking through the malate/aspartate and glutamate/aspartate shuttles. Although muscle concentrations of the BCAAs (valine, leucine, and isoleucine) were similar between groups (Fig. 5D), circulating levels of these metabolites were elevated in TKO mice (Fig. 5E), consistent with a defect in BCAA catabolism. Whereas the metabolite signature in skeletal muscle was clearly distinguishable between genotypes, the only differentially abundant metabolites in TKO liver were the lower levels of long chain acylcarnitines (Fig. 6, A–C), which again occurred independent of changes in malonyl-CoA (not shown). In aggregate, these results add further evidence that TXNIP plays a key role in maintaining oxidative metabolism at sites upstream of the ETC.
FIGURE 6.

Targeted metabolic profiling of liver. Liver from TKO mice and WT littermate controls were harvested 5–6 h following food withdrawal at 18 weeks of age. Specimens were immediately flash frozen in liquid N2 and subsequently processed for mass spectrometry-based measurement of acylcarnitines (A), organic acids (B), and amino acids (C). Data are mean ± S.E. from 6 animals per group and results were analyzed by Student's t test (*, p ≤ 0.05 and §, p ≤ 0.10).
TXNIP Deficiency Results in Muscle-specific Deficits in Multiple Dehydrogenase Enzymes
The foregoing static metabolic profiles (Fig. 5, A–E), taken together with the substrate oxidation presented in Fig. 3, A–F, pointed toward several specific mitochondrial oxidoreductase enzymes responsible for degrading BCAAs, ketones, and fatty acids, including BCKAD, BDH1, and SCHAD. As predicted, the activities of these three enzymes were diminished 65, 47, and 15%, respectively, in mitochondria from TKO compared with WT muscles (Table 1). Likewise, activity of the NAD-dependent TCA cycle enzyme, ICD3, was 27% lower in muscles from TXNIP KO compared with WT mice (Table 1). The impact of TXNIP deficiency on mitochondrial dehydrogenase enzymes was not universal, as the activities of succinate dehydrogenase (SDH), pyruvate dehydrogenase (PDH), and NADPH+-dependent ICD2, were similar between genotypes.
TABLE 1.
Enzyme activity in isolated mitochondria
Data are mean ± S.E. (n = 5 or 6 per group).
| Enzyme | Activity |
Changea | |
|---|---|---|---|
| WT | KO | ||
| nmol/mg protein/h | % | ||
| BCKAD | 66.7 (±1.42) | 23.7 (±0.73)b | ↓ 65% |
| BDH1 | 47.9 (±5.34) | 24.8 (±2.52)b | ↓ 47% |
| SCHAD | 902 (±39.9) | 770 (±40.5)c | ↓ 15% |
| ICD3 | 129.3 (±9.55) | 94.8 (±7.02)b | ↓ 27% |
| SDH | 889 (±47.7) | 817 (±25.4) | = |
| PDH | 1229 (±28.0) | 1240 (±29.6) | = |
| ICD2 | 215 (±9.1) | 204 (±12.1) | = |
a The = and ↓ indicate percent change in the TXNIP KO relative to the WT control.
b Results were analyzed by Student's t test (p ≤ 0.001).
c Results were analyzed by Student's t test (p ≤ 0.05).
We proceeded to determine whether the decline in the aforementioned enzyme activities was related to changes in gene and/or protein expression. Whereas mRNA expression of these enzymes was similar between TKO and WT mice (Fig. 7A), Western blot analyses revealed marked deficits at the level of protein expression, as quantities of the BCKAD E1α subunit, BDH1, and ICD3 were decreased 77, 65, and 22%, respectively (Fig. 7B). These changes in protein abundance were remarkably similar in muscles from TXNIPSKM−/− mice (Fig. 7C) and mirrored the degree to which oxidation rates of each respective substrate were diminished in the TXNIP null condition. By contrast, expression levels of the same three proteins were unchanged in liver of TKO mice as compared with their control littermates (not shown). Considering that TXNIP deficiency increased circulating levels and muscle production of lactate (Fig. 1, A and G), we examined muscle isoenzyme distribution of LDH, a tetrameric complex consisting of M (muscle) and H (heart) subunits (39). Based on its subunit composition, the complexes are referred to as LDH1 (H4), LDH2 (H3M1), LDH3 (H2M2), LDH4 (H1M3), or LDH5 (M4). As suspected, native gel electrophoresis revealed a pronounced shift toward an isoenzyme composition depleted of LDH1 and enriched in LDH5 in TXNIP null muscles (Fig. 7, D–F), whereas mRNA abundance of the Ldh5 and Ldh1 genes were unchanged (Fig. 7G). Similar results were found in muscles from TXNIPSKM−/− mice (Fig. 7, H–K). The LDH1 isozyme favors conversion of lactate to pyruvate, whereas the opposite is true of LDH5 (39) fitting with the metabolic phenotype of the Txnip null animals. Last, because TXNIP appeared to be essential for maximum oxidation of leucine, ketones, and lactate, we questioned whether TXNIP is transcriptionally up-regulated in response to physiological stresses known to increase muscle reliance on these alternative fuels. Indeed, overnight fasting, genetic diabetes, and prolonged exercise increased Txnip mRNA levels in rodent skeletal muscles (Fig. 7, L–O). In summary, these findings establish a tissue-specific role for TXNIP in preserving mitochondrial capacity to switch substrates during glucose deprivation.
FIGURE 7.

Expression of mitochondrial dehydrogenase enzymes in skeletal muscle and liver. Tissues were harvested 5–6 h following food withdrawal at 18–22 weeks of age. Skeletal muscles from TKO mice and littermate controls were used for quantitative RT-PCR analysis of mRNAs encoding (A) bckad e1α, bdh1, and icd3 normalized to 18 S, and Western blot analysis of the BCKAD E1A, BDH1, and ICD3 proteins (B) normalized to Memcode staining. Expression of the same proteins was measured in gastrocnemius muscles (C) from TXNIPSKM−/− mice and TXNIPfl/fl controls. Skeletal muscles from TKO mice and littermate controls were used for: D, an LDH isozyme activity gel with WT heart shown as a control; E, quantification of results; F, calculation of the LDH5:LDH1 ratio; and G, quantitative RT-PCR analysis of mRNAs encoding ldh5 and ldh1. The same analyses were performed using gastrocnemius muscles from TXNIPSKM−/− mice and TXNIPfl/fl mice (H–K). Quantitative RT-PCR analysis of mRNA encoding txnip normalized to 18 S was measured in skeletal muscles from fed and fasted (12 h) C57BL/6J mice (L), fasted (12 h) and refed (3 h) C57BL/6J mice (M), Zucker Diabetic Fatty (ZDF) rats, and lean controls (O) C57BL/6J mice (N) at rest and 10 min, 3 h, or 24 h after a 90-min graded treadmill exercise bout (*, p ≤ 0.05 versus rest). Data are mean ± S.E. (n = 5 per group) and results were analyzed by Student's t test (*, p ≤ 0.05 and **, p ≤ 0.001).
DISCUSSION
TXNIP is a multifaceted molecule that sits at the crossroad of redox sensing, oxidative stress, and metabolic control (3, 7–14). Despite numerous reports showing that TXNIP deficiency causes profound derangements in energy metabolism, the molecular mechanisms underlying these consequences remain murky. Previous reports have suggested that loss of TXNIP leads to respiratory dysfunction that in turn gives rise to aerobic glycolysis, also known as the Warburg effect (8, 9, 11–13). Here, we explored the connection between TXNIP and mitochondrial performance in skeletal muscle and liver, two organs principally responsible for whole body glucose and lipid homeostasis. We report several new and enlightening observations that add to our current physiological understanding of this protein. First, TXNIP deficiency in skeletal muscle resulted in diminished oxidation of all major substrates, leading to reduced exercise tolerance. Second, the oxidative insufficiencies in TXNIP null muscles were not due to reductions in mitochondrial mass, impaired ETC function, or increased mitochondrial reactive oxygen species production; but instead were attributed to decreased protein abundance of specific mitochondrial dehydrogenase enzymes. Last, the consequences of TXNIP deficiency were tissue-dependent, as the striking metabolic deficits evident in muscle mitochondria of TKO mice were absent in liver.
Despite marked changes in circulating levels of several metabolic fuels, whole body energy expenditure and substrate selection were unchanged in TKO mice. This observation aligns with an earlier report (10) and fits with the finding that TXNIP deficiency did not affect substrate oxidation rates in isolated mitochondria from liver, an organ that contributes substantially to resting RER. By contrast, genotype-dependent differences in the muscle-fueled selection were revealed during a treadmill challenge. The higher RER in the TKO mice undergoing exercise agreed with the lower rates of fatty acid and amino acid oxidation measured in isolated muscles and isolated mitochondria. Although exercise tolerance was diminished in both TKO and TXNIPSKM−/− mice, these animals were still capable of reaching and maintaining relatively high workloads during an acute treadmill test. This outcome was inconsistent with severe respiratory defects. Indeed, subsequent experiments showed that mitochondrial content and ETC function were essentially normal in TXNIP null skeletal muscles.
Despite high rates of glycolysis in the TXNIP null muscles, NADH levels were unchanged. This result adds further support to the notion that ETC function is not a limiting factor in the TKO mice, and raises the possibility that enhanced transfer of glucose-derived NADH to complex I via the malate/aspartate shuttle (Fig. 8) might compensate for deficiencies in fatty acid and amino acid catabolism during exercise. Additionally, this finding conflicts with the idea that NADH accumulation in TKO muscles leads to inactivation of PTEN, a redox-sensitive phosphatidylinositol 3-phosphatase that lowers cellular levels of (3,4,5)-trisphosphate thereby dampening Akt phosphorylation and insulin signaling (11). Because high NADH levels have been shown to block TXN/NADP(H)-dependent activation of PTEN, investigators suggested that a rise in the cellular NADH/NADPH ratio, secondary to respiratory dysfunction, might lead to constitutive oxidation and inactivation of PTEN, thus amplifying Akt phosphorylation. Although the latter outcomes were clearly apparent in TKO muscles (11), NADH and NADPH were not measured. In the current study TXNIP deficiency did not affect NADH levels but instead caused a 2-fold rise in NADPH, possibly resulting from increased glucose transport and subsequent metabolism in the pentose phosphate pathway (40). NADPH provides reducing power for regenerating GSH and TXN. Surprisingly, however, elevated NADPH levels in the TKO muscles were accompanied by lower GSH concentrations. Although the reason for this disconnect is uncertain, we suspect that substrate-driven pressure on membrane-associated NADPH oxidase (NOX), which generates superoxide, might give rise to non-mitochondrial H2O2 production, thereby increasing demands on the GSH oxidant scavenging system. Interestingly, NOX-derived reactive oxygen species has been shown to target and inactivate PTEN as part of a feed-forward mechanism that boosts insulin action (41).
FIGURE 8.

TXNIP deficiency disrupts mitochondrial fuel selection. During periods of carbohydrate deprivation, up-regulation of TXNIP serves to limit glucose transport into skeletal muscle and promote mitochondrial oxidation of alternative fuels. TXNIP deficiency enhances glucose uptake and flux through both glycolysis and the pentose phosphate pathway. Despite this shift to glycolytic metabolism, respiratory function of the ETC remains intact, thereby permitting transfer of glucose-derived NADH to complex I via the malate/aspartate shuttle. Diminished protein expression and activities of specific mitochondrial dehydrogenase enzymes lowers muscle capacity for oxidizing lactate, fatty acid, amino acid, and ketones, thus disrupting adaptive mitochondrial fuel switching in response to starvation and exercise. Key: metabolites affected by TXNIP deficiency are indicated in red (increased) and blue (decreased). Abbreviations: AcAc, acetoacetate; α-KG, α-ketoglutarate dehydrogenase; AST, apartate aminotransferase; BHB, β-hydroxybutyrate; BDH1, β-hydroxybutyrate dehydrogenase; CACT, carnitine acylcarnitine translocase; CPT1 and CPT2, carnitine palmitoyltransferase 1 and 2; DHAP, dihydroxyacetone phosphate; G-6-P, glucose 6-phosphate; GDH, glutamate dehydrogenase; GPx, glutathione peroxidase; ICD3, NAD+-dependent isocitrate dehydrogenase; LCAC, long chain acylcarnitine; LCFA-CoA, long chain fatty acid acyl-CoA; LDH1, lactate dehydrogenase 1; LDH5, lactate dehydrogenase 5; MDH, malate dehydrogenase; NOX, NADPH oxidase; PDH, pyruvate dehydrogenase; PPP, pentose phosphate pathway.
To our knowledge, this investigation was the first to apply comprehensive metabolic profiling tools to the TXNIP null models. When the targeted metabolomics analyses were combined with results of the foregoing substrate oxidation and respiratory function assays, a clearer picture of TXNIP deficiency began to take shape (Fig. 8). First, the tissue-specific role of this protein in regulating mitochondrial metabolism was further underscored, as the only commonality between the muscle and liver was the long chain acylcarnitine profile. In both tissues, the decline in long chain acylcarnitines suggested a decrease in either CPT1 activity or substrate delivery. Because neither CPT1 protein abundance nor malonyl-CoA levels were affected by genotype, we suspect that loss of TXNIP impedes fatty acid transport into tissues via a yet unknown mechanism. Second, the reduction in skeletal muscle acetyl-CoA levels was consistent with catabolic defects upstream of the ETC, and both the acyl-CoA and acylcarnitine profiles pointed to major defects in the pathways of amino acid and ketone degradation. Most notably, muscle content of isovaleryl-CoA (C5) as well as each of the odd-chain acylcarnitines were robustly decreased in the TKO group, whereas circulating BCAA levels were elevated. Considering that isovaleryl-CoA is produced by BCKAD, and because this metabolic profile resembles BCKAD deficiency in humans and mice (42), attention was drawn to this complex.
Also quite striking in the TKO mice was the marked rise in intramuscular levels of β-hydroxybutyrylcarnitine. This metabolite derives from 3-hydroxyacyl-CoA, a product of ketone metabolism and a substrate of the SCHAD enzyme (43, 44). Additionally, the decline in muscle levels of α-KG suggested a potential impingement in TCA cycle flux at the ICD3 step. Collectively, these signatures led to the discovery that TXNIP deficiency in muscle results in a near complete loss of both the BCKAD E1A subunit and BDH1 protein, with more modest declines in protein abundance of SCHAD and ICD3. These findings help to explain the elevated circulating levels of ketones, fatty acids, and amino acids in the TXNIP-deficient models as well as their intolerance to prolonged fasting (12) and endurance exercise.
Another important finding of this study was the TXNIP-dependent shift in muscle abundance of the LDH1 and LDH5 complexes. This result could explain why the knock-out mice have such high levels of circulating lactate despite normal respiratory function. Recent studies have shown that permeabilized myofibers and isolated muscle mitochondria oxidize lactate in a NAD-dependent manner (45), and confocal imaging of immunolabeled fibers revealed significant amounts of LDH localized to both the outer mitochondrial membrane as well as the intermembrane space (46). Exercise training-induced adaptations in the LDH complex, which favor increased LDH1 activity, are thought to play an important role in enhancing pyruvate oxidation and mitigating blood lactate levels during physical activity (47). Results herein suggest that TXNIP might contribute to exercise-induced remodeling of the complex by promoting synthesis and/or stability of the LDH M subunit.
These findings imply that the redox environment plays a key role in modulating protein abundance of BDH1, BCKAD, and LDH1, all of which produce NADH. The mechanism(s) by which TXNIP protects specific oxidoreductase enzymes remains unknown, although our data point to regulation at the level of protein synthesis and/or stability. TXNIP can form intermolecular disulfide bonds with reduced thioredoxin as well as other proteins containing a CXXC motif. Emerging evidence suggests that TXNIP is present and functionally active in the mitochondrial matrix (19, 48). Moreover, in INS1 cells, recombinant TXNIP was shown to translocate to the mitochondria in response to oxidative stress, which in turn activated the apoptosis signaling kinase ASK1 by disrupting its interaction with mitochondrial localized TXN2 (48). Additionally, TXN has been shown to bind directly to various 2-oxoacid dehydrogenase complexes, which appears to modulate enzyme activity in vitro (49, 50). Thus, the absence of TXNIP might alter interactions between TXN2 and other redox-sensitive mitochondrial proteins.
Last, we consider the physiological relevance of our findings in the settings of feast and famine. Transcriptional induction of TXNIP is typically viewed as a negative feedback response to excessive glucose exposure, mediated via the activation of carbohydrate-responsive transcription factors, ChREBP and MondoA (51). Our finding that skeletal muscle mRNA expression of TXNIP is up-regulated during nutritional states characterized by intramuscular glucose insufficiency, such as fasting, severe diabetes, and prolonged exercise, supports evidence that this protein can be regulated by nutrient signals other than glycolytic intermediates (14). Prominent among these is insulin, as TXNIP was identified as one of the most potently suppressed skeletal muscle mRNAs in healthy human individuals subjected to a hyperinsulinemic-euglycemic clamp (14). Taken together, these results imply that insulin-mediated suppression of TXNIP in the refed state serves not only to disinhibit glucose uptake, but also to restrict ketone and BCAA oxidation and promote net protein synthesis. Conversely, during periods of prolonged glucose restriction or chronic exercise training, skeletal muscles are reprogrammed to switch energy currency from glucose to fatty acids, ketones, and amino acids. This occurs at the level of substrate supply as well as increased enzyme activities and protein abundance (52–54) and serves as a fundamental survival mechanism that preserves glucose for the brain.
Whereas glucose sparing favors survival during times of famine, elevated TXNIP expression in nutrient replete muscles of obese and diabetic individuals might contribute to glucose disuse. For example, obesity and diabetes are associated with elevated circulating levels of fatty acids, ketones, and BCAA, as well as hyperglycemia (55, 56). A large body of evidence links the development of insulin resistance to heightened competition between glucose and lipid-derived substrates (57). More recent studies implicate a similar role for BCAAs (56, 58), which can fuel the TCA cycle by providing both acetyl-CoA and anaplerotic carbons thereby rendering glucose superfluous. Based on these findings, we speculate that inappropriate up-regulation of TXNIP in the context of overnutrition exacerbates substrate competition and contributes to nutrient-induced mitochondrial stress and/or redox imbalance (59). In summary, this work identifies a novel role for TXNIP in coordinating fuel selection in response to nutrient availability and furthers implicates this protein as a potential antidiabetic drug target.
Acknowledgments
We acknowledge the late Dr. Roger Davis for generating the mouse lines used in these experiments and for his many intellectual contributions to this field. We thank Dr. Chris Lynch for providing the BCKAD antibody.
This work was supported, in whole or in part, by National Institutes of Health Grants P01DK058398 (to D. M. M.) and R01DK080339 (to S. H.) from the United States Public Health Service and an American Heart Association Mid-Atlantic Affiliate Predoctoral Fellowship 10PRE4140033 (to K. L. D.).
- TXNIP
- thioredoxin interacting protein
- BCAA
- branched chain amino acid
- BCKAD
- branched chain ketoacid dehydrogenase
- BDH1
- β-hydroxybutyrate dehydrogenase
- EDL
- extensor digitorum longus
- ETC
- electron transport chain
- ICD2
- NADP+-dependent isocitrate dehydrogenase
- ICD3
- NAD+-dependent isocitrate dehydrogenase
- RER
- respiratory exchange ratio
- SCHAD
- short chain hydroxyacyl-CoA dehydrogenase
- TXN
- thioredoxin
- TKO
- TXNIP whole body knockout mice
- TXNIPSKM−/−
- skeletal muscle-specific knockout mice
- TXNIPfl/fl
- TXNIP floxed control mice
- CPT
- carnitine palmitoyltransferase
- LDH
- lactate dehydrogenase.
REFERENCES
- 1. Chen K. S., DeLuca H. F. (1994) Isolation and characterization of a novel cDNA from HL-60 cells treated with 1,25-dihydroxyvitamin D3. Biochim. Biophys. Acta 1219, 26–32 [DOI] [PubMed] [Google Scholar]
- 2. Nishiyama A., Matsui M., Iwata S., Hirota K., Masutani H., Nakamura H., Takagi Y., Sono H., Gon Y., Yodoi J. (1999) Identification of thioredoxin-binding protein-2/vitamin D3 up-regulated protein 1 as a negative regulator of thioredoxin function and expression. J. Biol. Chem. 274, 21645–21650 [DOI] [PubMed] [Google Scholar]
- 3. Bodnar J. S., Chatterjee A., Castellani L. W., Ross D. A., Ohmen J., Cavalcoli J., Wu C., Dains K. M., Catanese J., Chu M., Sheth S. S., Charugundla K., Demant P., West D. B., de Jong P., Lusis A. J. (2002) Positional cloning of the combined hyperlipidemia gene Hyplip1. Nat. Genet. 30, 110–116 [DOI] [PMC free article] [PubMed] [Google Scholar]
- 4. Nordberg J., Arnér E. S. (2001) Reactive oxygen species, antioxidants, and the mammalian thioredoxin system. Free Radic. Biol. Med. 31, 1287–1312 [DOI] [PubMed] [Google Scholar]
- 5. Alvarez C. E. (2008) On the origins of arrestin and rhodopsin. BMC Evol. Biol. 8, 222. [DOI] [PMC free article] [PubMed] [Google Scholar]
- 6. Spindel O. N., World C., Berk B. C. (2012) Thioredoxin interacting protein. Redox dependent and independent regulatory mechanisms. Antioxid. Redox Signal. 16, 587–596 [DOI] [PMC free article] [PubMed] [Google Scholar]
- 7. Donnelly K. L., Margosian M. R., Sheth S. S., Lusis A. J., Parks E. J. (2004) Increased lipogenesis and fatty acid reesterification contribute to hepatic triacylglycerol stores in hyperlipidemic Txnip−/− mice. J. Nutr. 134, 1475–1480 [DOI] [PubMed] [Google Scholar]
- 8. Hui T. Y., Sheth S. S., Diffley J. M., Potter D. W., Lusis A. J., Attie A. D., Davis R. A. (2004) Mice lacking thioredoxin-interacting protein provide evidence linking cellular redox state to appropriate response to nutritional signals. J. Biol. Chem. 279, 24387–24393 [DOI] [PubMed] [Google Scholar]
- 9. Sheth S. S., Castellani L. W., Chari S., Wagg C., Thipphavong C. K., Bodnar J. S., Tontonoz P., Attie A. D., Lopaschuk G. D., Lusis A. J. (2005) Thioredoxin-interacting protein deficiency disrupts the fasting-feeding metabolic transition. J. Lipid Res. 46, 123–134 [DOI] [PubMed] [Google Scholar]
- 10. Chutkow W. A., Birkenfeld A. L., Brown J. D., Lee H. Y., Frederick D. W., Yoshioka J., Patwari P., Kursawe R., Cushman S. W., Plutzky J., Shulman G. I., Samuel V. T., Lee R. T. (2010) Deletion of the α-arrestin protein Txnip in mice promotes adiposity and adipogenesis while preserving insulin sensitivity. Diabetes 59, 1424–1434 [DOI] [PMC free article] [PubMed] [Google Scholar]
- 11. Hui S. T., Andres A. M., Miller A. K., Spann N. J., Potter D. W., Post N. M., Chen A. Z., Sachithanantham S., Jung D. Y., Kim J. K., Davis R. A. (2008) Txnip balances metabolic and growth signaling via PTEN disulfide reduction. Proc. Natl. Acad. Sci. U.S.A. 105, 3921–3926 [DOI] [PMC free article] [PubMed] [Google Scholar]
- 12. Oka S., Liu W., Masutani H., Hirata H., Shinkai Y., Yamada S., Yoshida T., Nakamura H., Yodoi J. (2006) Impaired fatty acid utilization in thioredoxin binding protein-2 (TBP-2)-deficient mice. A unique animal model of Reye syndrome. FASEB J. 20, 121–123 [DOI] [PubMed] [Google Scholar]
- 13. Chutkow W. A., Patwari P., Yoshioka J., Lee R. T. (2008) Thioredoxin-interacting protein (Txnip) is a critical regulator of hepatic glucose production. J. Biol. Chem. 283, 2397–2406 [DOI] [PubMed] [Google Scholar]
- 14. Parikh H., Carlsson E., Chutkow W. A., Johansson L. E., Storgaard H., Poulsen P., Saxena R., Ladd C., Schulze P. C., Mazzini M. J., Jensen C. B., Krook A., Björnholm M., Tornqvist H., Zierath J. R., Ridderstråle M., Altshuler D., Lee R. T., Vaag A., Groop L. C., Mootha V. K. (2007) TXNIP regulates peripheral glucose metabolism in humans. PLoS Med 4, e158. [DOI] [PMC free article] [PubMed] [Google Scholar]
- 15. Yoshihara E., Fujimoto S., Inagaki N., Okawa K., Masaki S., Yodoi J., Masutani H. (2010) Disruption of TBP-2 ameliorates insulin sensitivity and secretion without affecting obesity. Nat. Commun. 1, 127. [DOI] [PMC free article] [PubMed] [Google Scholar]
- 16. Wu N., Zheng B., Shaywitz A., Dagon Y., Tower C., Bellinger G., Shen C. H., Wen J., Asara J., McGraw T. E., Kahn B. B., Cantley L. C. (2013) AMPK-dependent degradation of TXNIP upon energy stress leads to enhanced glucose uptake via GLUT1. Mol. Cell 49, 1167–1175 [DOI] [PMC free article] [PubMed] [Google Scholar]
- 17. Zhou R., Tardivel A., Thorens B., Choi I., Tschopp J. (2010) Thioredoxin-interacting protein links oxidative stress to inflammasome activation. Nat. Immunol. 11, 136–140 [DOI] [PubMed] [Google Scholar]
- 18. Schulze P. C., Yoshioka J., Takahashi T., He Z., King G. L., Lee R. T. (2004) Hyperglycemia promotes oxidative stress through inhibition of thioredoxin function by thioredoxin-interacting protein. J. Biol. Chem. 279, 30369–30374 [DOI] [PubMed] [Google Scholar]
- 19. Yoshioka J., Chutkow W. A., Lee S., Kim J. B., Yan J., Tian R., Lindsey M. L., Feener E. P., Seidman C. E., Seidman J. G., Lee R. T. (2012) Deletion of thioredoxin-interacting protein in mice impairs mitochondrial function but protects the myocardium from ischemia-reperfusion injury. J. Clin. Invest. 122, 267–279 [DOI] [PMC free article] [PubMed] [Google Scholar]
- 20. Muoio D. M., Noland R. C., Kovalik J. P., Seiler S. E., Davies M. N., DeBalsi K. L., Ilkayeva O. R., Stevens R. D., Kheterpal I., Zhang J., Covington J. D., Bajpeyi S., Ravussin E., Kraus W., Koves T. R., Mynatt R. L. (2012) Muscle-specific deletion of carnitine acetyltransferase compromises glucose tolerance and metabolic flexibility. Cell Metab. 15, 764–777 [DOI] [PMC free article] [PubMed] [Google Scholar]
- 21. Kim J. Y., Koves T. R., Yu G. S., Gulick T., Cortright R. N., Dohm G. L., Muoio D. M. (2002) Evidence of a malonyl-CoA-insensitive carnitine palmitoyltransferase I activity in red skeletal muscle. Am. J. Physiol. Endocrinol. Metab. 282, E1014–1022 [DOI] [PubMed] [Google Scholar]
- 22. Muoio D. M., Dohm G. L., Tapscott E. B., Coleman R. A. (1999) Leptin opposes insulin's effects on fatty acid partitioning in muscles isolated from obese ob/ob mice. Am. J. Physiol. 276, E913–921 [DOI] [PubMed] [Google Scholar]
- 23. Dohm G. L., Tapscott E. B., Pories W. J., Dabbs D. J., Flickinger E. G., Meelheim D., Fushiki T., Atkinson S. M., Elton C. W., Caro J. F. (1988) An in vitro human muscle preparation suitable for metabolic studies. Decreased insulin stimulation of glucose transport in muscle from morbidly obese and diabetic subjects. J. Clin. Invest. 82, 486–494 [DOI] [PMC free article] [PubMed] [Google Scholar]
- 24. Boushel R., Gnaiger E., Schjerling P., Skovbro M., Kraunsøe R., Dela F. (2007) Patients with type 2 diabetes have normal mitochondrial function in skeletal muscle. Diabetologia 50, 790–796 [DOI] [PMC free article] [PubMed] [Google Scholar]
- 25. Kuznetsov A. V., Tiivel T., Sikk P., Kaambre T., Kay L., Daneshrad Z., Rossi A., Kadaja L., Peet N., Seppet E., Saks V. A. (1996) Striking differences between the kinetics of regulation of respiration by ADP in slow-twitch and fast-twitch muscles in vivo. Eur. J. Biochem. 241, 909–915 [DOI] [PubMed] [Google Scholar]
- 26. Tonkonogi M., Fernström M., Walsh B., Ji L. L., Rooyackers O., Hammarqvist F., Wernerman J., Sahlin K. (2003) Reduced oxidative power but unchanged antioxidative capacity in skeletal muscle from aged humans. Pflugers Arch. 446, 261–269 [DOI] [PubMed] [Google Scholar]
- 27. Perry C. G., Kane D. A., Lin C. T., Kozy R., Cathey B. L., Lark D. S., Kane C. L., Brophy P. M., Gavin T. P., Anderson E. J., Neufer P. D. (2011) Inhibiting myosin-ATPase reveals a dynamic range of mitochondrial respiratory control in skeletal muscle. Biochem. J. 437, 215–222 [DOI] [PMC free article] [PubMed] [Google Scholar]
- 28. Anderson E. J., Lustig M. E., Boyle K. E., Woodlief T. L., Kane D. A., Lin C. T., Price J. W., 3rd, Kang L., Rabinovitch P. S., Szeto H. H., Houmard J. A., Cortright R. N., Wasserman D. H., Neufer P. D. (2009) Mitochondrial H2O2 emission and cellular redox state link excess fat intake to insulin resistance in both rodents and humans. J. Clin. Invest. 119, 573–581 [DOI] [PMC free article] [PubMed] [Google Scholar]
- 29. Koves T. R., Ussher J. R., Noland R. C., Slentz D., Mosedale M., Ilkayeva O., Bain J., Stevens R., Dyck J. R., Newgard C. B., Lopaschuk G. D., Muoio D. M. (2008) Mitochondrial overload and incomplete fatty acid oxidation contribute to skeletal muscle insulin resistance. Cell Metab. 7, 45–56 [DOI] [PubMed] [Google Scholar]
- 30. Binstock J. F., Schulz H. (1981) Fatty acid oxidation complex from Escherichia coli. Methods Enzymol. 71, 403–411 [DOI] [PubMed] [Google Scholar]
- 31. Hale D. E., Cornell J. E., Bennett M. J. (1997) Stability of long-chain and short-chain 3-hydroxyacyl-CoA dehydrogenase activity in postmortem liver. Clin. Chem. 43, 273–278 [PubMed] [Google Scholar]
- 32. Grinblat L., Pacheco Bolaños L. F., Stoppani A. O. (1986) Decreased rate of ketone-body oxidation and decreased activity of D3-hydroxybutyrate dehydrogenase and succinyl-CoA:3-oxo-acid CoA-transferase in heart mitochondria of diabetic rats. Biochem. J. 240, 49–56 [DOI] [PMC free article] [PubMed] [Google Scholar]
- 33. Lehninger A. L., Sudduth H. C., Wise J. B. (1960) d-β-Hydroxybutyric dehydrogenase of mitochondria. J. Biol. Chem. 235, 2450–2455 [PubMed] [Google Scholar]
- 34. Reisch A. S., Elpeleg O. (2007) Biochemical assays for mitochondrial activity. Assays of TCA cycle enzymes and PDHc. Methods Cell Biol. 80, 199–222 [DOI] [PubMed] [Google Scholar]
- 35. Yarian C. S., Toroser D., Sohal R. S. (2006) Aconitase is the main functional target of aging in the citric acid cycle of kidney mitochondria from mice. Mech. Ageing Dev. 127, 79–84 [DOI] [PMC free article] [PubMed] [Google Scholar]
- 36. Guo W., Jiang L., Bhasin S., Khan S. M., Swerdlow R. H. (2009) DNA extraction procedures meaningfully influence qPCR-based mtDNA copy number determination. Mitochondrion 9, 261–265 [DOI] [PMC free article] [PubMed] [Google Scholar]
- 37. McGarry J. D., Leatherman G. F., Foster D. W. (1978) Carnitine palmitoyltransferase I. The site of inhibition of hepatic fatty acid oxidation by malonyl-CoA. J. Biol. Chem. 253, 4128–4136 [PubMed] [Google Scholar]
- 38. Soeters M. R., Serlie M. J., Sauerwein H. P., Duran M., Ruiter J. P., Kulik W., Ackermans M. T., Minkler P. E., Hoppel C. L., Wanders R. J., Houten S. M. (2012) Characterization of D3-hydroxybutyrylcarnitine (ketocarnitine). An identified ketosis-induced metabolite. Metabolism 61, 966–973 [DOI] [PubMed] [Google Scholar]
- 39. Dawson D. M., Goodfriend T. L., Kaplan N. O. (1964) Lactic dehydrogenases. Functions of the two types rates of synthesis of the two major forms can be correlated with metabolic differentiation. Science 143, 929–933 [DOI] [PubMed] [Google Scholar]
- 40. Stanton R. C. (2012) Glucose-6-phosphate dehydrogenase, NADPH, and cell survival. IUBMB Life 64, 362–369 [DOI] [PMC free article] [PubMed] [Google Scholar]
- 41. Seo J. H., Ahn Y., Lee S. R., Yeol Yeo C., Chung Hur K. (2005) The major target of the endogenously generated reactive oxygen species in response to insulin stimulation is phosphatase and tensin homolog and not phosphoinositide 3-kinase (PI-3 kinase) in the PI-3 kinase/Akt pathway. Mol. Biol. Cell 16, 348–357 [DOI] [PMC free article] [PubMed] [Google Scholar]
- 42. Chuang D. T., Shih V. E. (2001) Maple syrup urine disease (branched-chain ketoaciduria). in The Metabolic and Molecular Bases of Inherited Disease (Scriver C. R., ed.) 8th Ed., Vol. 2, pp. 1971–2005, McGraw-Hill, New York [Google Scholar]
- 43. Rinaldo P., Cowan T. M., Matern D. (2008) Acylcarnitine profile analysis. Genet. Med. 10, 151–156 [DOI] [PubMed] [Google Scholar]
- 44. Koeberl D. D., Young S. P., Gregersen N. S., Vockley J., Smith W. E., Benjamin D. K., Jr., An Y., Weavil S. D., Chaing S. H., Bali D., McDonald M. T., Kishnani P. S., Chen Y. T., Millington D. S. (2003) Rare disorders of metabolism with elevated butyryl- and isobutyryl-carnitine detected by tandem mass spectrometry newborn screening. Pediatr. Res. 54, 219–223 [DOI] [PubMed] [Google Scholar]
- 45. Jacobs R. A., Meinild A. K., Nordsborg N. B., Lundby C. (2013) Lactate oxidation in human skeletal muscle mitochondria. Am. J. Physiol. Endocrinol. Metab. 304, E686–694 [DOI] [PubMed] [Google Scholar]
- 46. Elustondo P. A., White A. E., Hughes M. E., Brebner K., Pavlov E., Kane D. A. (2013) Physical and functional association of lactate dehydrogenase (LDH) with skeletal muscle mitochondria. J. Biol. Chem. 288, 25309–25317 [DOI] [PMC free article] [PubMed] [Google Scholar]
- 47. Summermatter S., Santos G., Pérez-Schindler J., Handschin C. (2013) Skeletal muscle PGC-1α controls whole-body lactate homeostasis through estrogen-related receptor α-dependent activation of LDH B and repression of LDH A. Proc. Natl. Acad. Sci. U.S.A. 110, 8738–8743 [DOI] [PMC free article] [PubMed] [Google Scholar]
- 48. Saxena G., Chen J., Shalev A. (2010) Intracellular shuttling and mitochondrial function of thioredoxin-interacting protein. J. Biol. Chem. 285, 3997–4005 [DOI] [PMC free article] [PubMed] [Google Scholar]
- 49. Bunik V., Raddatz G., Lemaire S., Meyer Y., Jacquot J. P., Bisswanger H. (1999) Interaction of thioredoxins with target proteins. Role of particular structural elements and electrostatic properties of thioredoxins in their interplay with 2-oxoacid dehydrogenase complexes. Protein Sci. 8, 65–74 [DOI] [PMC free article] [PubMed] [Google Scholar]
- 50. Bunik V. I. (2003) 2-Oxo acid dehydrogenase complexes in redox regulation. Eur. J. Biochem. 270, 1036–1042 [DOI] [PubMed] [Google Scholar]
- 51. Stoltzman C. A., Peterson C. W., Breen K. T., Muoio D. M., Billin A. N., Ayer D. E. (2008) Glucose sensing by MondoA:Mlx complexes. A role for hexokinases and direct regulation of thioredoxin-interacting protein expression. Proc. Natl. Acad. Sci. U.S.A. 105, 6912–6917 [DOI] [PMC free article] [PubMed] [Google Scholar]
- 52. Fujii H., Shimomura Y., Tokuyama K., Suzuki M. (1994) Modulation of branched-chain 2-oxo acid dehydrogenase complex activity in rat skeletal muscle by endurance training. Biochim. Biophys. Acta 1199, 130–136 [DOI] [PubMed] [Google Scholar]
- 53. Holecek M. (2001) Effect of starvation on branched-chain α-keto acid dehydrogenase activity in rat heart and skeletal muscle. Physiol. Res. 50, 19–24 [PubMed] [Google Scholar]
- 54. Shimomura Y., Fujii H., Suzuki M., Murakami T., Fujitsuka N., Nakai N. (1995) Branched-chain α-keto acid dehydrogenase complex in rat skeletal muscle. Regulation of the activity and gene expression by nutrition and physical exercise. J. Nutr. 125, 1762S–1765S [DOI] [PubMed] [Google Scholar]
- 55. Muoio D. M., Newgard C. B. (2008) Mechanisms of disease. Molecular and metabolic mechanisms of insulin resistance and β-cell failure in type 2 diabetes. Nat. Rev. Mol. Cell Biol. 9, 193–205 [DOI] [PubMed] [Google Scholar]
- 56. Newgard C. B. (2012) Interplay between lipids and branched-chain amino acids in development of insulin resistance. Cell Metab. 15, 606–614 [DOI] [PMC free article] [PubMed] [Google Scholar]
- 57. Hue L., Taegtmeyer H. (2009) The Randle cycle revisited. A new head for an old hat. Am. J. Physiol. Endocrinol. Metab. 297, E578–591 [DOI] [PMC free article] [PubMed] [Google Scholar]
- 58. Wang T. J., Larson M. G., Vasan R. S., Cheng S., Rhee E. P., McCabe E., Lewis G. D., Fox C. S., Jacques P. F., Fernandez C., O'Donnell C. J., Carr S. A., Mootha V. K., Florez J. C., Souza A., Melander O., Clish C. B., Gerszten R. E. (2011) Metabolite profiles and the risk of developing diabetes. Nat. Med. 17, 448–453 [DOI] [PMC free article] [PubMed] [Google Scholar]
- 59. Muoio D. M., Neufer P. D. (2012) Lipid-induced mitochondrial stress and insulin action in muscle. Cell Metab 15, 595–605 [DOI] [PMC free article] [PubMed] [Google Scholar]