Background: Reactive oxygen species (ROS) affect cytoplasmic calcium signaling.
Results: Superoxide anion causes oxidation of the IP3 receptor and sensitization of calcium release to promote cytoplasmic calcium oscillations and mitochondrial calcium uptake.
Conclusion: Physiologically relevant ROS controls cytoplasmic and mitochondrial calcium transport through IP3 receptors.
Significance: Mechanisms of calcium and ROS interactions are relevant for both physiological and pathophysiological signaling.
Keywords: Calcium Signaling; Endoplasmic Reticulum (ER); Inositol 1,4,5-Trisphosphate; Mitochondria; Reactive Oxygen Species (ROS); IP3 Receptor
Abstract
Reactive oxygen species (ROS) stimulate cytoplasmic [Ca2+] ([Ca2+]c) signaling, but the exact role of the IP3 receptors (IP3R) in this process remains unclear. IP3Rs serve as a potential target of ROS produced by both ER and mitochondrial enzymes, which might locally expose IP3Rs at the ER-mitochondrial associations. Also, IP3Rs contain multiple reactive thiols, common molecular targets of ROS. Therefore, we have examined the effect of superoxide anion (O2⨪) on IP3R-mediated Ca2+ signaling. In human HepG2, rat RBL-2H3, and chicken DT40 cells, we observed [Ca2+]c spikes and frequency-modulated oscillations evoked by a O2⨪ donor, xanthine (X) + xanthine oxidase (XO), dose-dependently. The [Ca2+]c signal was mediated by ER Ca2+ mobilization. X+XO added to permeabilized cells promoted the [Ca2+]c rise evoked by submaximal doses of IP3, indicating that O2⨪ directly sensitizes IP3R-mediated Ca2+ release. In response to X+XO, DT40 cells lacking two of three IP3R isoforms (DKO) expressing either type 1 (DKO1) or type 2 IP3Rs (DKO2) showed a [Ca2+]c signal, whereas DKO expressing type 3 IP3R (DKO3) did not. By contrast, IgM that stimulates IP3 formation, elicited a [Ca2+]c signal in every DKO. X+XO also facilitated the Ca2+ release evoked by submaximal IP3 in permeabilized DKO1 and DKO2 but was ineffective in DKO3 or in DT40 lacking every IP3R (TKO). However, X+XO could also facilitate the effect of suboptimal IP3 in TKO transfected with rat IP3R3. Although in silico studies failed to identify a thiol missing in the chicken IP3R3, an X+XO-induced redox change was documented only in the rat IP3R3. Thus, ROS seem to specifically sensitize IP3Rs through a thiol group(s) within the IP3R, which is probably inaccessible in the chicken IP3R3.
Introduction
Inositol 1,4,5-trisphosphate receptors (IP3Rs)4 are Ca2+ channels that serve to release Ca2+ from the endoplasmic reticulum (ER) in response to cell stimulation by a wide array of hormones, growth factors, and neurotransmitters (1, 2). Many fundamental biological processes that are activated or regulated by Ca2+ signals require IP3R function. These include such critical functions as secretion (3), smooth muscle contraction (4), gene transcription (5), and fertilization (6). Ca2+ release from IP3Rs localized in the vicinity of mitochondria also plays a pivotal role in propagation of Ca2+ signals into the mitochondrial matrix, which, depending on the exact conditions, can lead to enhanced ATP synthesis or the initiation of apoptotic signaling (7). IP3R channel activity is primarily regulated by IP3 and Ca2+ concentrations, although the channel is also modulated by phosphorylation (8), ATP (9), and interaction with a large number of proteins (10).
Another factor that regulates IP3Rs is the cellular redox state, although the molecular basis for this mode of regulation is poorly understood (reviewed in Ref. 11). Various exogenously added oxidants stimulate IP3R-mediated Ca2+ release. This includes thimerosal (12–14), t-butylhydroperoxide (15), and diamide (16, 17). In the case of thimerosal, the proposed mechanism involves an increased sensitivity of the receptor to lower [IP3], which in some cells is sufficient to trigger Ca2+ oscillations at the ambient [IP3] present in unstimulated cells (11). Although sensitization to IP3 may be a general mechanism applicable to other oxidants, it has also been suggested that they may alter the Ca2+ sensitivity of the receptor (15, 16).
Three different IP3R isoforms are expressed in different amounts in various cells, and the different isoforms are capable of forming homo and heterotetramers (18, 19). The selective localization or regulation of individual isoforms has been proposed to play a role in different biological processes. For example, the IP3R3 isoform has been suggested to have the predominant role in supplying Ca2+ to the mitochondria in CHO cells (20). However, little is known regarding the IP3R isoform selectivity for regulation by redox agents. IP3Rs located at ER/mitochondrial junctions would be particularly prone to the reactive oxygen species (ROS) derived from both organelles. In contrast to the exogenous reagents added to manipulate the cellular redox state, the primary endogenous ROS generated as a consequence of mitochondrial respiratory chain activity are superoxide anions (O2⨪), which are dismutated to form H2O2. Similarly, the ER can generate substantial amounts of H2O2 from multiple sources (21). In the present study, we have evaluated the effects on IP3R-mediated release of a physiological oxidant, O2⨪, generated from xanthine by xanthine oxidase. The experiments have been carried out using different experimental models that express individual isoforms of IP3Rs. Our data show that responsiveness to an endogenously produced ROS is dependent on the exact IP3R isoform and species variant examined.
EXPERIMENTAL PROCEDURES
Cells
RBL-2H3, HepG2, and DT40 (wild type and IP3R knock-outs alike) cells were cultured as described previously (7, 22, 23). Stable colonies of DT40 IP3R triple knock-out cells rescued by rat IP3R3 were produced as described previously (24). Expression of the IP3R3 in each clone was assessed by Western blotting.
Measuring Changes in the Redox State of IP3Rs
The method employed was modified from the “thiol trapping” procedure described by Ref. 25 in which TCA is used to preserve the thiol redox state of the proteins. DT40 cells expressing the endogenous chicken IP3R3 or the rat IP3R3 were centrifuged (800 × g, 5 min) and resuspended in an extracellular-like medium containing 0.25% BSA (0.25% BSA-ECM). 2.5-ml aliquots (∼2 × 10⁷ cells/ml) were treated for 5 min with 0.1 mm xanthine and 20 milliunits/ml xanthine oxidase. The samples were rapidly centrifuged (1,500 × g, 1 min), resuspended in 0.5 ml of PBS, and quenched by addition of TCA to a final concentration of 10% (w/v). The TCA pellet was recovered by centrifugation (3,000 × g, 5 min) and dissolved in denaturing buffer containing 6 m urea, 0.5% SDS, 200 mm Tris-HCl (pH 8.0), and 10 mm EDTA. Free thiol groups in the lysate were blocked by reaction with 10 mm iodoacetamide for 30 min followed by reprecipitation with TCA and solubilization in denaturing buffer. Modified thiol groups on the receptor were converted to the reduced form by reaction with 10 mm DTT for 30min. The lysate was again reprecipitated with TCA and resolubilized in denaturing buffer containing 20 μm DTT at a protein concentration of 2–3 mg/ml. Free thiol groups present in the receptor from control and X+XO treated cells were reacted in a final volume of 25 μl with 0.5 mm PEG-maleimide (5 kDa, Fluka). Gel shifts in the IP3R were visualized after running the samples on 5% SDS-PAGE mini-gels and immunoblotting with a monoclonal Ab to the IP3R3 isoform (BD Biosciences).
Fluorescence Imaging of [Ca2+] in Single Cells
To monitor [Ca2+]c, cells were loaded with 5 μm fura2/AM for 20 min in the presence of 100 μm sulfinpyrazone and 0.003% (w/v) pluronic acid in 2% BSA-ECM at room temperature. Cells attached to coverslips were placed in 1 ml of buffer to the heated stage (35 °C) of an inverted epifluorescence microscope (40× oil objective) connected to a cooled CCD camera (PXL, Photometrics). Ratiometric imaging of fura2 was used to monitor [Ca2+] as described previously (7, 26, 27). Simultaneous imaging of cytoplasmic [Ca2+]and GSH/GSSG was performed in cells transfected with plasmid DNA encoding RCaMP (28) and Grx1-roGFP2 (29, 30) using a ProEM1024 EM-CCD (Princeton Instruments), fitted to Leica DMI 6000B inverted epifluorescence microscope (31). Two different filter sets (for RCaMP: excitation, 580/20 nm; 595-nm beam splitter, emission, 630/60 nm; and for Grx1-roGFP2: excitation, 415/20 nm and 490/20 nm excitation filters and a 500-nm long pass beam splitter; excitation, 520/40 nm) were alternated by a motorized turret.
Fluorometric Measurements of [Ca2+]c and [Ca2+]m in Suspensions of Permeabilized Cells
Experiments with the RBL-2H3 cells were carried out as described earlier (26). Before recording, the fura2FF/AM-loaded cells (∼2 mg protein/1.5 ml) were permeabilized in an intracellular medium (120 mm KCl, 10 mm NaCl, 1 mm KH2PO4, 20 mm Tris-HEPES, 2 mm Magnesium-ATP, and antipain, leupeptin, and pepstatin 1 μg/ml each at pH 7.2) supplemented with 25 μg/ml digitonin for 5 min at 35 °C, followed by washout of the released cytosolic fura2FF (125 × g for 4–5 min). Compartmentalized fura2FF has been shown to occur in the mitochondria of the RBL-2H3 cells (22). Permeabilized cells were resuspended in intracellular medium supplemented with 2 mm succinate and 0.25 μm rhod2/FA and maintained in a stirred thermostatted cuvette at 35 °C. rhod2/FA was added to monitor [Ca2+] in the intracellular medium that exchanges readily with the cytosolic space, and so [Ca2+]rhod2 was abbreviated as [Ca2+]c.
When [Ca2+]c was measured in permeabilized DT40 cells, the harvested cells were first preincubated in Ca2+-free extracellular buffer for 1 h at 37 °C to drain Ca2+ from intracellular compartments and stored on ice. Cells were permeabilized with saponin (40 μg/ml) and incubated in intracellular medium and to measure [Ca2+]c, 1.5 μm fura2/FA was added.
Fluorescence was monitored in a fluorometer (Delta-RAM, PTI) using 340 nm and 380 nm excitation and 500 nm emission for fura2 or fura2FF and 540 nm excitation and 580 nm emission for rhod2. Calibration of the fura2, fura2FF, and rhod2 fluorescence was carried out at the end of each measurement as described previously (26).
Statistics
Experiments were carried out with at least three different cell preparations, and the data are shown as mean ± S.E. Significance of differences from the relevant controls was calculated by Student's t test.
RESULTS
O2⨪-induced Frequency-modulated [Ca2+]c Oscillations in HepG2 Cells
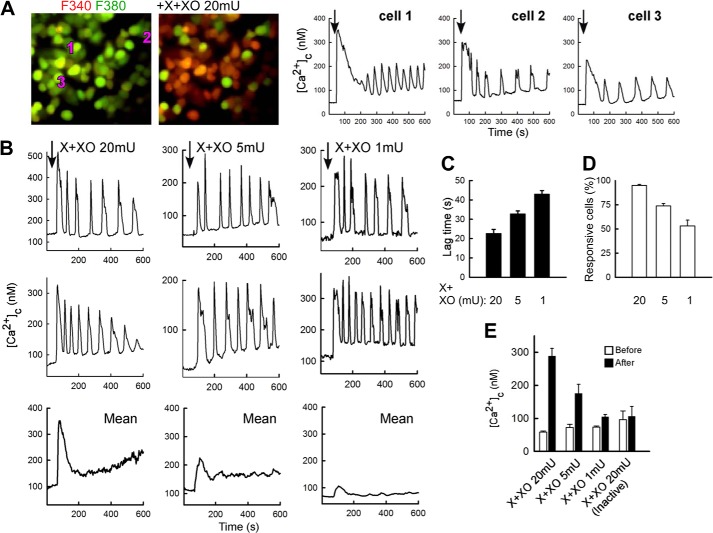
Addition of a O2⨪-generating system (32) to HepG2 human hepatocarcinoma cells resulted in a [Ca2+]c spike in most cells within 1 min (Fig. 1A). The initial spike was followed by [Ca2+]c oscillations (Fig. 1A). Typically, [Ca2+]c returned close to the basal level among the individual spikes, giving rise to a baseline spike pattern (Fig. 1, A and B). The lag time and the fraction of the responsive cells were inversely and directly proportional to the amount of the O2⨪-generating enzyme, respectively (Fig 1, B–D). The mean response of the cells on the field also showed an initial [Ca2+]c rise and a subsequent decay to a plateau level (Fig. 1B, lower panel). The height of both the spike and the plateau was proportional with the added amount of the O2⨪-generating enzyme (Fig 1, B and E). The [Ca2+]c signal was prevented by heat inactivation of the O2⨪-generating enzyme (Fig. 1E) or when the O2⨪-generating system was applied to cells pretreated with a cell-permeable superoxide dismutase mimetic, manganese (III) tetrakis (4-benzoic acid) porphyrin (20 μm, data not shown).
FIGURE 1.
Generation of O2⨪ causes dose-dependent [Ca2+]c oscillations in HepG2 cells. A, [Ca2+]c was measured in fura2/AM-loaded intact HepG2 cells treated with 100 μm X + 20 milliunits (mU)/ml XO to produce O2⨪. In the images recorded before (40 s) and after X+XO addition (70 s), the green to red shift (F340 nm/F380 nm increase) indicates a [Ca2+]c elevation in most cells. For the cells, marked by the numbers on them the time course shows that [Ca2+]c spikes and baseline spike oscillations were elicited by X+XO (graphs). B, individual and mean cell [Ca2+]c time course records obtained during exposure to different doses of XO (20, 5, and 1 milliunits/ml). Mean was calculated for all cells (responding and non-responding) in the field. C–E, X+XO dose dependence of the lag time (C), fraction of responding cells (D), and magnitude of the [Ca2+]c rise (E). Data in E also show that heat-inactivated XO (10-min incubation in boiling water) fails to cause a [Ca2+]c rise.
Previous studies have demonstrated that addition of the O2⨪-generating system to intact cells results in a rapid increase in intracellular O2⨪ using both roGFP2 (33) and MitoSox (34). Here, we recorded the cytoplasmic glutathione redox state simultaneously with [Ca2+]c. Although glutathione redox might change with a slower kinetic than superoxide anion, it can be measured in a more specific and reliable manner. These measurements showed a change in the redox starting together with the X+XO-induced first [Ca2+]c spike (p < 0.03 at 1 min) (Fig. 2). Because the signal-to-noise ratio is much lower for the redox sensors than that for the calcium sensors it does not seem to be feasible to confirm a redox change before the first calcium spike. A recent study indicated that superoxide anion produced by X+XO in the extracellular space traverses the plasma membrane (34), providing a mechanism underlying the cytoplasmic O2⨪ rise and redox change.
FIGURE 2.
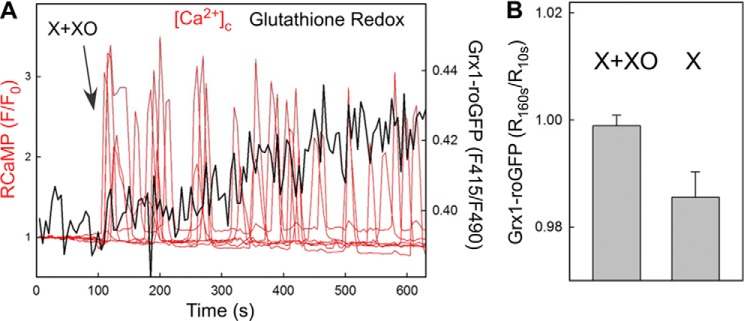
Extracellular generation of O2⨪ causes a rapid and dynamic response in the cytoplasmic redox state. A, [Ca2+]c and glutathione redox state were measured simultaneously in RCaMP and Grx1-roGFP2-expressing intact HepG2 cells treated with 100 μm X + 20 milliunits/ml XO to produce O2⨪. The time course shows the [Ca2+]c spikes recorded in the individual cells of the imaging field (red) and the mean response in the GSH redox state (black). The mean response faithfully represents the kinetic of the single cell responses that were averaged because of the relatively low signal to noise ratio. B, single cell Grx1-roGFP2 ratios obtained at 1 min of stimulation were normalized to the prestimulation ratio values (90 s before stimulation), and the mean was calculated for cells treated with X+XO and with X alone, respectively (nine measurements for each, ∼10 cells/measurement). A significant increase was obtained for X+XO as compared with X alone (p < 0.03). Please note that a continuous downward baseline drift caused lowering R160s/R10s under 1 in 150 s.
Collectively, these data suggest that extracellular O2⨪ generation causes an intracellular O2⨪ increase and a dose-dependent activation of a [Ca2+]c signaling pathway. Previously, we have also reported that exposure to X+XO causes mitochondrial membrane permeabilization and apoptosis, but these effects only occurred after much longer exposures (1 h or longer) (32).
The O2⨪-induced [Ca2+]c Signal Depends on Ca2+ Mobilization from the ER
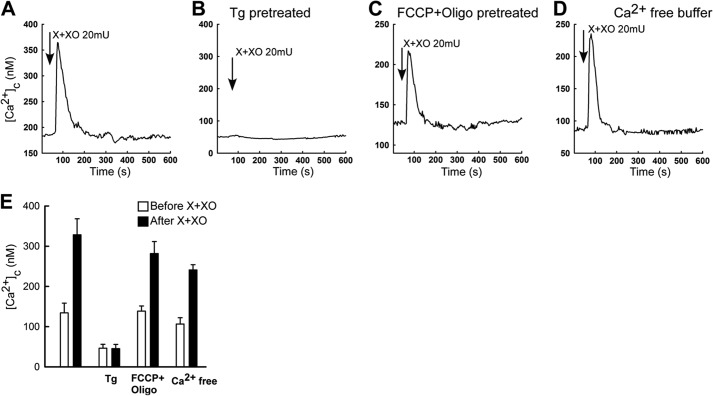
To clarify the source of the [Ca2+]c signal, the O2⨪-generating system was first added to cells pretreated with thapsigargin (2 μm) that discharges the ER Ca2+ store. Thapsigargin pretreatment abolished the O2⨪-induced [Ca2+]c signal (Fig. 3, B versus A). By contrast, pretreatment of the cells with a mitochondrial uncoupler to eliminate the mitochondrial Ca2+ storage (Fig. 3, C and E) or removal of extracellular Ca2+ to prevent Ca2+ entry (Fig. 3, D and E) failed to eliminate the O2⨪-induced [Ca2+]c rise. Thus, the O2⨪-induced [Ca2+]c signal is mediated by Ca2+ mobilization from the ER and does not require Ca2+ entry or mitochondrial Ca2+ accumulation. Furthermore, the rapid kinetic of the [Ca2+]c rise indicates the involvement of IP3Rs in the ER Ca2+ mobilization.
FIGURE 3.
The O2⨪-induced [Ca2+]c signal requires ER Ca2+-mobilization but is not dependent on Ca2+ entry or mitochondrial Ca2+ storage. A–D, mean [Ca2+]c time course is shown for all cells (10–20 cells) in the imaging field. A, X+XO 20 milliunits/ml-induced [Ca2+]c rise. B, ER Ca2+ store predepletion with thapsigargin (Tg; 2 μm) treatment prevented the O2⨪-induced [Ca2+]c rise. C, uncoupling of the mitochondria by 5 μm FCCP + 5 μg/ml oligomycin (Oligo) pretreatment did not interfere with the O2⨪-induced [Ca2+]c rise. D, incubation of the cells in a nominally Ca2+-free medium did not prevent the O2⨪-induced [Ca2+]c rise. E, bar charts show the summary of the individual cell records shown in A–D (n = 50–100 cells).
O2⨪-induced [Ca2+]c Signals in RBL-2H3 and DT40 Cells
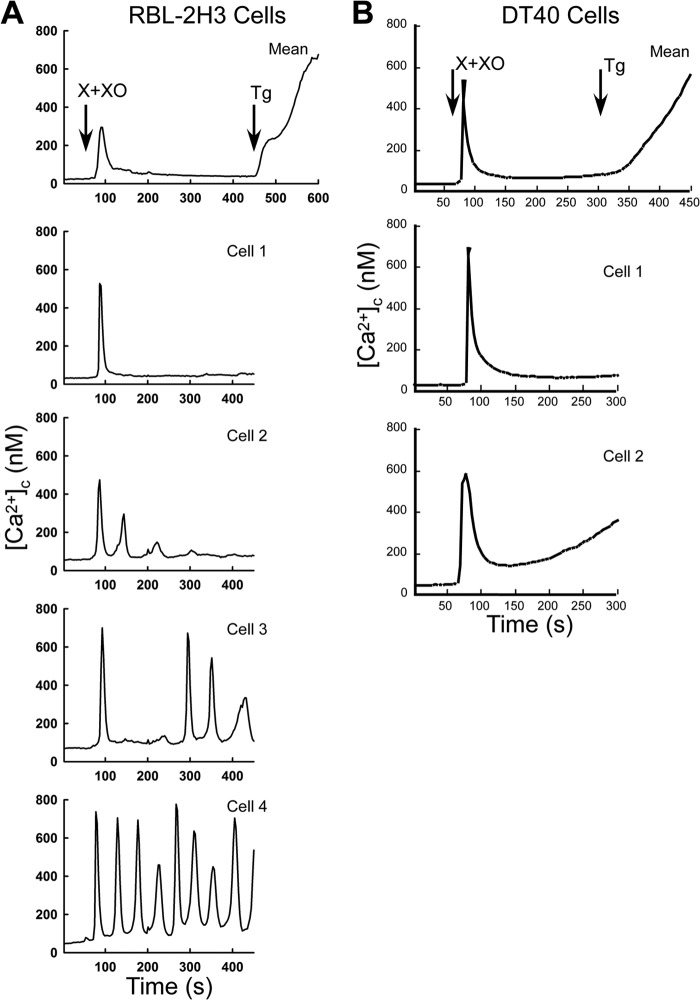
To test whether the O2⨪-induced [Ca2+]c signal is cell-type or species-specific, we also tested the effect of X+XO on the [Ca2+]c in RBL-2H3 rat mast cells and in DT40 chicken B lymphocytes (Fig. 4). These cells were also selected because RBL-2H3 cells provide a model for the quantification of both [Ca2+]c and [Ca2+]m changes elicited by IP3 addition (see Fig. 5), and DT40 cell clones expressing individual IP3R isoforms are available (Figs. 6–10). Similar to HepG2 cells, both RBL-2H3 and DT40 cells exhibited a [Ca2+]c spike in response to O2⨪ generation (Fig. 4, A and B). In the RBL-2H3 cells, the [Ca2+]c spike was regularly followed by baseline-spike [Ca2+]c oscillations (Fig. 4A), whereas in the DT40 cells, the [Ca2+]c showed a plateau slightly above the baseline (Fig. 4B). These results indicate that O2⨪ induces rapid Ca2+ mobilization in a variety of cell types regardless of the species of origin.
FIGURE 4.
O2⨪ evokes a [Ca2+]c signal in a variety of cell types. X+XO (20 milliunits/ml)-induced [Ca2+]c signal in intact RBL-2H3 (A) and DT40 (B) cells loaded with fura2/AM. The upper graphs show the mean [Ca2+]c rise, whereas the other graphs illustrate the heterogeneity of the individual cell responses. Tg, thapsigargin.
FIGURE 5.
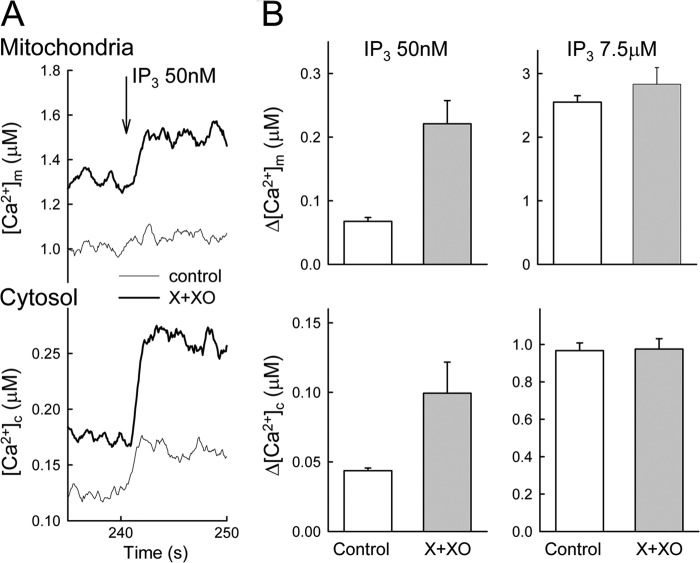
O2⨪ promotes IP3-induced Ca2+ mobilization and mitochondrial Ca2+ transfer in permeabilized cells. [Ca2+]m and [Ca2+]c were measured simultaneously in suspensions of permeabilized RBL-2H3 cells, which were either untreated (control) or pretreated with X+XO. Responses were measured by furaFF/AM compartmentalized in the mitochondria (upper graphs) and by rhod2/FA in the cytosol (lower graphs). A, time courses of responses to suboptimal IP3 (50 nm). B, amplitudes of mean responses to suboptimal IP3 (50 nm) and maximal IP3 (7.5 μm) (n = 4–5).
FIGURE 6.
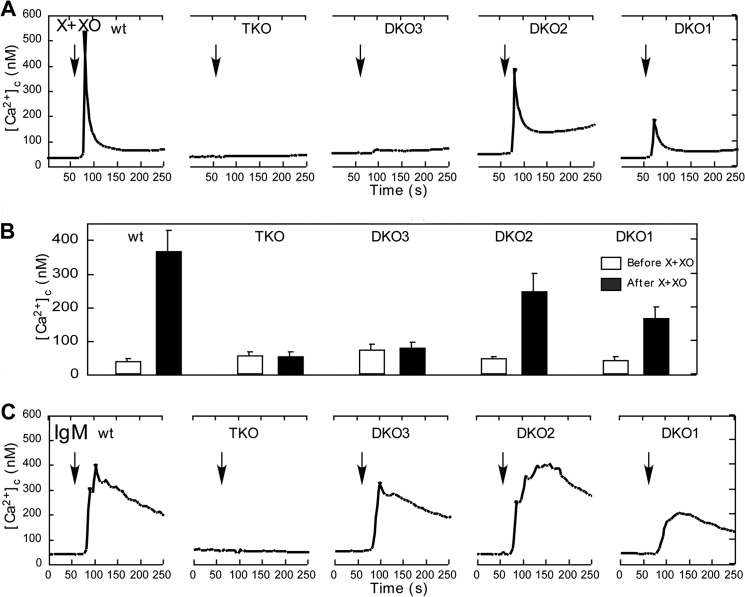
IP3R isoform dependent O2⨪-induced [Ca2+]c signal in intact DT40 cells. A, time course of the X+XO (20 milliunits/ml)-induced [Ca2+]c signal is shown in wild type (WT), IP3R TKO and DKO individual DT40 cells. The O2⨪-induced [Ca2+]c signal was absent in TKO cells. Similarly, IP3R3 expressing DT40 cells (DKO3) also failed to respond to O2⨪, whereas only IP3R1 (DKO1) and IP3R2 (DKO2) expressing cells showed a [Ca2+]c signal. B, summary of the peak [Ca2+]c increases obtained in the five different cell types. C, time course of the [Ca2+]c signal evoked by IgM (2 μg/ml), a phospholipase C-coupled agonist in each DT40 cell type. Every DKO cell type expressing at least one IP3R isoform, even IP3R3, showed an IgM-induced [Ca2+]c signal.
FIGURE 7.
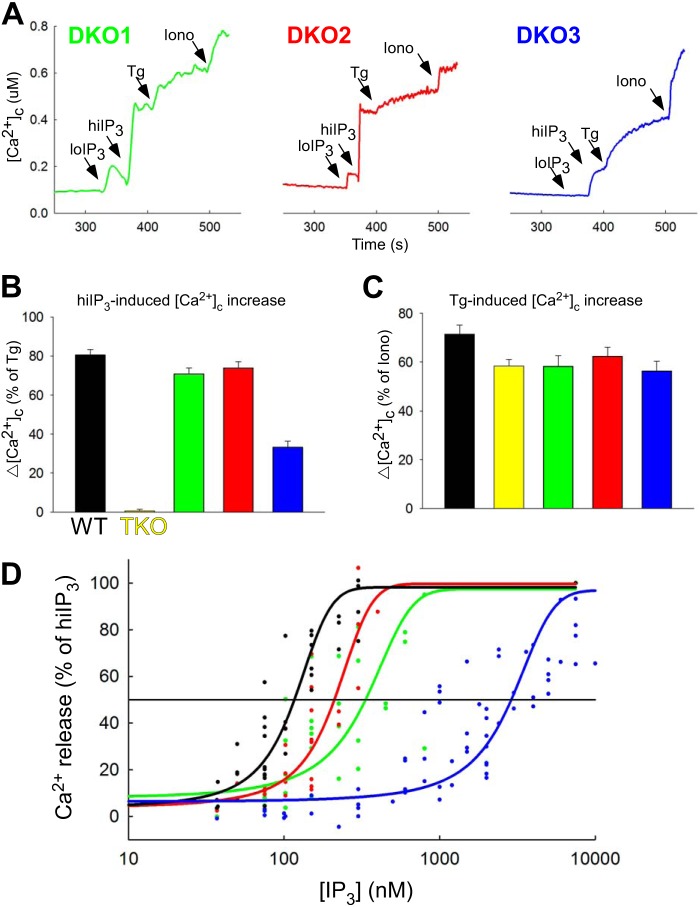
IP3 sensitivity of the ER Ca2+ storage pools in DT40 cells expressing various IP3R isoforms. IP3-induced Ca2+ mobilization was measured in suspensions of permeabilized DT40 cells. A, [Ca2+]c increases evoked by sequential additions of suboptimal (100 nm), maximal (7.5 μm) concentrations of IP3, thapsigargin (Tg; 2 μm), and ionomycin (Iono, 10 μm) are shown for DKO1, DKO2, and DKO3 cells. B and C, summary of the peak [Ca2+]c increases evoked by IP3 (7.5 μm, B) and thapsigargin (2 μm, C) in wild type, TKO, and DKO cells. D, IP3 dose response for [Ca2+]c increases in wild type cells and various DKO cells (each symbol represents a separate measurement).
FIGURE 8.
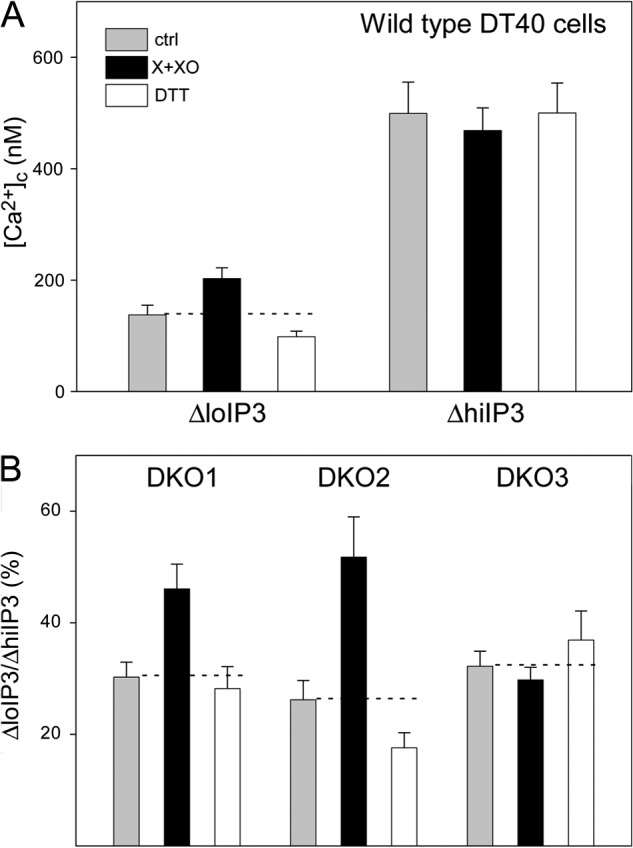
O2⨪ sensitizes IP3R1 and IP3R2 to IP3-induced Ca2+ mobilization. IP3-induced Ca2+ mobilization was measured in the presence or absence of X+XO (100 μm and 20 milliunits) or DTT (1 mm), a thiol-protecting agent in suspensions of permeabilized cells using fura2/FA. A, the [Ca2+]c increases evoked by both suboptimal (100 nm) and maximal (7.5 μm) concentrations of IP3 are shown for WT DT40 cells (n = 12). X+XO increased and DTT decreased the response to suboptimal IP3 (p < 0.03) but did not alter significantly the effect of maximal IP3. These results indicate O2⨪-induced sensitization of the IP3Rs. B, [Ca2+]c increases mediated by individual IP3R isoforms were monitored in DKO1 (n = 11), DKO2 (n = 15), and DKO3 (n = 18) cells. Because of the different IP3 sensitivity of IP3R1, IP3R2 and IP3R3, different suboptimal IP3 concentrations were used for each cell type to attain ∼30% [Ca2+]c increase relative to the effect of the maximal IP3. O2⨪ caused sensitization of IP3R1 and IP3R2 (p < 0.01) but failed to affect IP3R3. ctrl, control.
FIGURE 9.
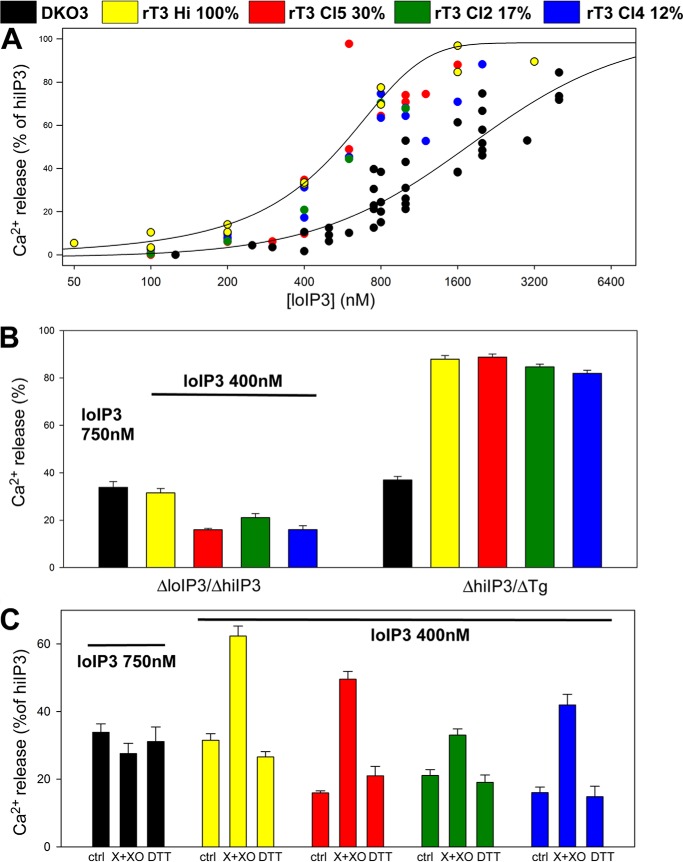
O2⨪ differently sensitizes chicken and rat IP3R3s. The effect of X+XO on [Ca2+]c increase was tested in suspensions of permeabilized DKO3 and in TKO rescued with rat IP3R3 (clones expressing the most IP3R (100%), 30, 17, and 12% are marked by yellow, red, green and blue, respectively). A, IP3 dose response relationships show that TKO cells expressing varying amounts of rat IP3R are more sensitive to IP3 than the chicken IP3R3 expressing DKO3 cells. B, left, cumulative data for DKO3 and TKO cells expressing varying amounts of rat IP3R3. Cells were treated with the amount of IP3 that mobilizes 30% of stored calcium as determined in A: 750 nm IP3 for DKO3 cells and 400 nm for TKO cells. Responses of TKO cells are relative to the response to 7.5 μm IP3. Right, cumulative responses to 7.5 μm IP3 normalized to the total thapsigargin (Tg)-sensitive storage in each cell line. C, X+XO-induced sensitization in rat IP3R3 expressing cells. Rescue clones expressing rat IP3R3 at lower levels showed lesser IP3 sensitivity but were also sensitized by O2⨪. ctrl, control.
FIGURE 10.
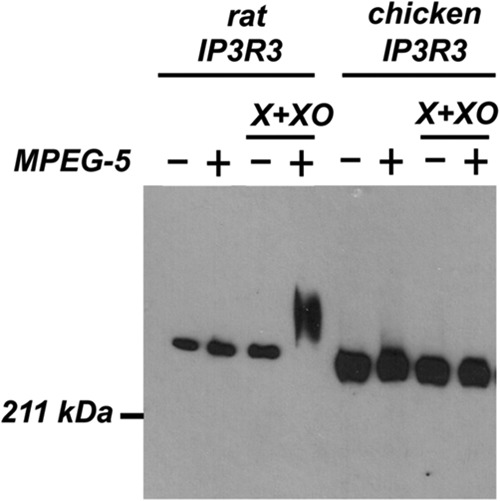
O2⨪ induced thiol oxidation is absent in chicken IP3R3 but is present in rat IP3R3. Trichloroacetic acid and a strongly denaturing buffer (SDS/urea) was used to prepare lysates from control and X+XO-treated DT40 cells expressing rat IP3R3 (TKO rescued with rat IP3R3) or chicken IP3R3 (DKO3) as described in “Experimental Procedures.” After initially blocking all free thiol groups with iodoacetamide, the remaining modified thiol residues were reduced with DTT and then reacted with methoxy polyethylene glycol (MPEG-5). The presence of oxidized thiol residues in the receptor is indicated by a gel shift reaction detected by immunoblotting on 5% SDS-PAGE. The data shown indicate that the thiols in the endogenous rat or chicken IP3R3 receptor are almost entirely in the reduced state under control conditions and only the rat isoform shows an oxidation response with X+XO. Because of differences in the expression levels of the chicken and rat isoforms the amount of protein loaded for the two isoforms was different (2 μg of rat; 20 μg of chicken). The data shown are representative of three experiments.
O2⨪ Promotes IP3-induced Ca2+ Mobilization and Mitochondrial Ca2+ Transfer in Permeabilized RBL-2H3 Cells
A previous study has shown X+XO stimulating phospholipase-mediated IP3 formation, which might lead to IP3R activation (35). To determine whether O2⨪ has any effects downstream of IP3 formation, we used permeabilized RBL-2H3 cells in which Ca2+ mobilization can be directly activated by added IP3. Also, in this model, a fraction of the IP3R-mediated Ca2+ release is locally transferred to the mitochondria, which can be monitored simultaneously with the Ca2+ release (22). When a suboptimal dose of IP3 was added, the IP3R-mediated Ca2+ release was greatly enhanced by O2⨪ (Fig. 5, A and B, lower panel). However, saturating IP3 doses evoked comparable [Ca2+]c increases in the absence and presence of the O2⨪-generating system (Fig. 5B, lower panel). [Ca2+]m recorded simultaneously with [Ca2+]c also showed great enhancement of the effect of suboptimal IP3 and no change in the effect of maximal IP3 (Fig. 5, A and B, upper panel). The enhancement of the suboptimal IP3-induced [Ca2+]m signal appeared to be even more robust (∼3-fold) than the increase in the [Ca2+]c signal (∼2-fold). These results suggest that O2⨪ sensitizes the IP3R-mediated Ca2+ release, clarifying that the O2⨪-induced [Ca2+]c signal in intact cells did not necessarily result from stimulation of IP3 production. Furthermore, sensitization of the IP3R leads to a relatively large increase in the IP3R-mitochondrial Ca2+ transfer, illustrating a striking consequence of the O2⨪ effect on local calcium signaling. The disproportionally large mitochondrial response might be evoked because the local Ca2+ transfer is more effective when IP3Rs are activated in a synchronous manner (22).
Lack of IP3R1 and IP3R2 Prevents the O2⨪-induced [Ca2+]c Signals in DT40 Cells
The studies described above have indicated that O2⨪ promotes IP3R activation by IP3. Because the IP3R has three isoforms that display 60–70% homology in sequence and similarities in their regulation, we wanted to clarify if every isoform can respond to O2⨪. For this purpose, we used DT40 cells lacking various combinations of the IP3Rs (Fig. 6). In IP3R triple knock-out (TKO) cells, the O2⨪-induced [Ca2+]c rise was absent (Fig. 6, A and B, second from left), confirming the dependence of the O2⨪-induced Ca2+ mobilization on the presence of IP3Rs. DT40 cells lacking two of three IP3R isoforms (DKO) expressing either type 1 (DKO1) or type 2 IP3Rs (DKO2) showed a [Ca2+]c signal, whereas DKO expressing type 3 IP3R (DKO3) did not display any [Ca2+]c elevation (Fig. 6, A and B). However, upon stimulation with IgM, an agonist that stimulates IP3 formation every DKO, but the TKO cells showed a [Ca2+]c rise (Fig. 6C). Thus, every chicken IP3R isoform responds to IP3 generation by mediating [Ca2+]c oscillations, but only IP3R1 and IP3R2 are sensitive to stimulation by O2⨪.
Resistance of IP3R3 to O2⨪-induced Sensitization in DT40 Cells
Next, we set out to test whether O2⨪ differentially sensitizes the various IP3R isoforms to IP3 in permeabilized DT40 cells. First, the effect of IP3 on the Ca2+ storage pools was tested in cells expressing different IP3Rs. In wild type cells as well in every DKO, IP3-induced a dose dependent [Ca2+]c increase (Fig. 7A). Although the size of the thapsigargin-induced [Ca2+]c increase was similar in each DT40 line, including the TKO cells (Fig. 7C), the IP3-sensitive increase was considerably smaller in the DKO3 cells than in the wild type or DKO1 and DKO2 cells (Fig. 7B). Furthermore, the IP3 dose-response relationship was rightward shifted for the DKO3 cells, whereas the curves for DKO1 and DKO2 were very close to that for the wild type (Fig. 7D).
In wild type DT40 cells, the O2⨪-generating system promoted the [Ca2+]c rise induced by a suboptimal IP3 dose and failed to alter the effect of maximal IP3 (Fig. 8A). Furthermore, DTT, a thiol protecting agent, slightly attenuated the [Ca2+]c rise evoked by suboptimal IP3 but did not change the response to maximal IP3 (Fig. 8A). Thus, thiol oxidation controlled IP3 sensitivity in DT40 cells expressing three IP3R isoforms. DTT-induced desensitization was also observed in DKO2, whereas the desensitization was not significant in DKO1 (Fig. 8B). Furthermore, the IP3 sensitivity of DKO3 was not affected by O2⨪ or DTT (Fig. 8B). These results suggest that differential sensitization of IP3R1, IP3R2, and IP3R3 by O2⨪ might cause the different [Ca2+]c signals in DKO1, DKO2, and DKO3.
Sensitization of Rat IP3R3 by O2⨪ in IP3R Triple Knock-out DT40 Cells
The relatively small size of the IP3-releasable Ca2+ storage and IP3 sensitivity in DKO3 indicated that the IP3R expression level might be low. To test the dependence of the Ca2+ pool size, IP3 sensitivity, and redox regulation on IP3R expression level, we used TKO cells rescued by IP3R3. Because full-length chicken IP3R has not been cloned, the experiments were carried out in rat IP3R3-expressing stable TKO clones (Fig. 9). First, quantification of IP3R3 Western blots of cell lysates was used to select four clones that showed a 10-fold range in IP3R3 expression level (100, 30, 17, and 12%, normalized to the highest expressing clone). The highest IP3 sensitivity was indeed associated with the highest IP3R3 expression and the IP3-releasable fraction of the ER Ca2+ store was consistently higher in every rat IP3R3 expressing clones than in the DKO3 (Fig. 9, A and B). Strikingly, every rat IP3R3 expressing TKO showed an apparent sensitization in the presence of O2⨪ generating system (Fig. 9C). Collectively, these results indicate that O2⨪ sensitizes IP3R regardless of their expression level. Surprisingly, the rat IP3R3 is similar to chicken IP3R1 and IP3R2 in its sensitivity to O2⨪.
Sequence Heterogeneity between Chicken IP3R3 and Other IP3R Isoforms
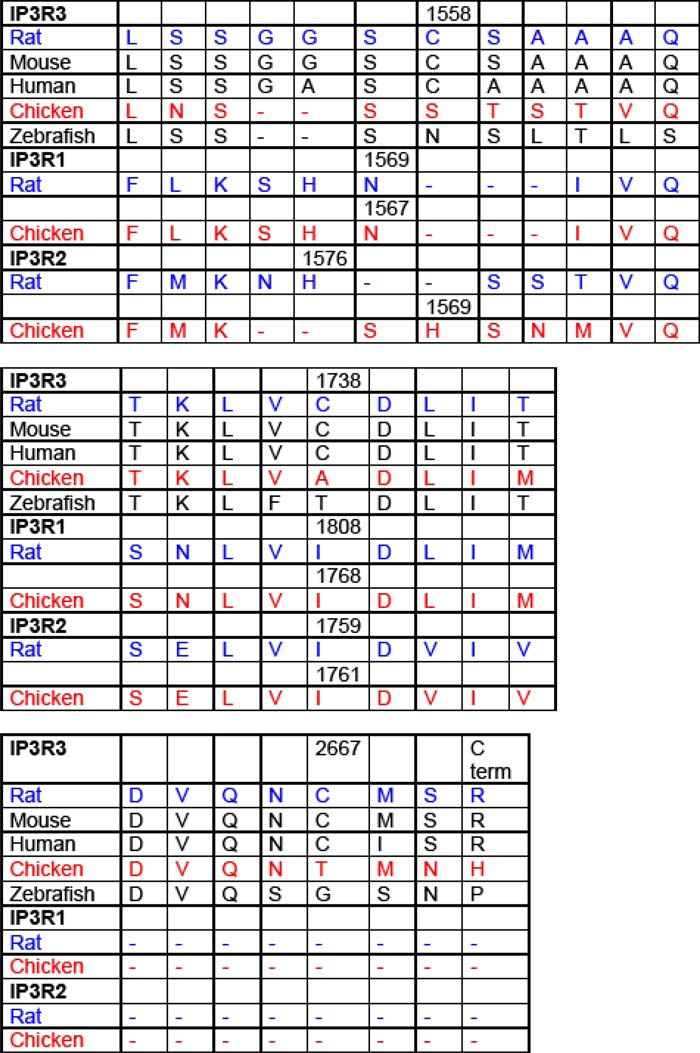
O2⨪ likely affects the IP3R function through a reactive Cys residue(s) within the IP3R or in a protein that interacts with and controls the IP3R. Because the latter group includes many proteins, we focused on studying the presence of Cys thiol groups in various IP3R isoforms. We searched for a Cys that is present it rat but is absent in chicken IP3R3. We found that three of 51 Cys present in rat IP3R3 were absent in chicken IP3R3 (Table 1). However, none of these Cys was also present in IP3R1 and IP3R2. Thus, these Cys groups are unlikely to confer O2⨪ sensitivity to the IP3R.
TABLE 1.
Alignment of amino acid sequence of the different IP3Rs from various species
To identify the relevant Cys thiol group in the O2⨪-induced [Ca2+]c signal, we aligned the amino acid sequences of the three different IP3Rs from the various species. Analysis of the sequences indicates that three of the 51 cysteines present in the rat IP3R3 isoform are not conserved in the chicken or in the other two rat IP3R isoforms.
To determine whether there are differences in the redox responses of the chicken and rat IP3R3s, we measured the redox state of the receptors expressed in DT40 cells using a modification of the thiol trapping procedure (Fig. 10) (25). In this method, TCA is used to deproteinize the cells and prevent thiol transformations. The precipitated protein is solubilized under denaturing conditions (SDS/urea) and successively treated with iodoacetamide and DTT to block free thiol groups and to make available oxidized residues for subsequent reaction with maleimide conjugated to a 5-kDa methoxy polyethylene glycol. The magnitude of the gel shift in immunoreactive IP3R is proportional to the number of available oxidized residues in the protein. The minimal shift observed for the chicken and rat IP3R3 is an indication that very few of the thiol residues in the receptor are oxidized under control conditions. The addition of X+XO to the cells expressing the rat IP3R3 isoform resulted in an enhanced reactivity of the receptor for methoxy polyethylene glycol indicating the oxidation of additional thiols. In contrast, the chicken isoform did not show an enhanced methoxy polyethylene glycol shift. A similar difference was also noted in response to 0.2 mm H2O2 (data not shown). Thus, some evolutionary conserved Cys are likely to be modified by O2⨪ only in the rat IP3R3 and are candidates to mediate sensitization of the IP3R to IP3.
DISCUSSION
Our studies demonstrate O2⨪-dependent sensitization of IP3-induced Ca2+ release toward IP3, which is likely to contribute to O2⨪-induced [Ca2+]c spikes and oscillations. Furthermore, the O2⨪-induced sensitization appears as a particularly potent facilitator of the ER-mitochondrial Ca2+ transfer presumably, due to its dependence on synchronized activation of IP3Rs, which is effectively supported by O2⨪. This work also provides evidence that the IP3R sensitization by O2⨪ is IP3R isoform- and species-specific. O2⨪ fails to induce sensitization of the chicken IP3R3. The differential effect of O2⨪ on chicken IP3R3 and chicken IP3R1 and -2 or rat IP3R3 is likely to be mediated by a conserved cysteine residue(s) that is less reactive in the chicken IP3R3. Overall, this study provides the first evidence that physiologically relevant ROS can control cytoplasmic and mitochondrial calcium signaling through the IP3Rs.
The sensitization of IP3Rs by exogenous oxidants is well established in the literature, but the molecular mechanisms involved have not been elucidated (reviewed in Ref. 11). Most recently, Khan et al. (14) have examined the effect of thimerosal on the IP3 responses of permeabilized DT40 cells expressing various rat IP3R isoforms. They showed that the types IP3R1 and IP3R2 were sensitized by thimerosal but that the rat IP3R3 was not. In our study, the rat IP3R3 expressed in DT40 cells retained responsiveness to a physiologically relevant oxidant, O2⨪. Apart from differences in the oxidants employed, the basis for this discrepancy is presently unclear. However, our results demonstrated that O2⨪ causes modification of a thiol group of the rat IP3R3, which might mediate the sensitization. Based on sequence analysis, the O2⨪-sensitive site is also present in the chicken IP3R3 but, based on the thiol-trapping studies, is unaccessible for modification. As to the nature of the oxidative modifications, several possibilities are available, including disulfide bridge formation and S-glutathionylation. Disulfide bridge formation has been described only at the ER luminal domain of the IP3R (37), which is unlikely in the present case due to the low membrane permeability of O2⨪. Although O2⨪ could be converted to H2O2 that is also a pro-oxidant and can traverse the ER membrane, the resting [H2O2] is already very high in the ER lumen (38). S-Glutathionylation of the IP3R1 has been demonstrated during diamide sensitization of the IP3R in cultured aortic endothelial cells (16, 17). Whether this is a general modification occurring with other oxidants, IP3R isoforms and cell types remain to be determined.
Redox regulation of ryanodine receptor channels share several common features with IP3Rs. Ryanodine receptors show enhanced activity in response to exogenous oxidants as well as endogenously produced ROS in both heart and skeletal muscle (39, 40). Attempts to identify the redox-sensitive, “hyper-reactive” thiols by mass spectrometry indicate the involvement of multiple thiols dispersed throughout the linear sequence (41, 42). Mutagenesis of multiple residues did not entirely eliminate the functional effects of the redox agents (43). In addition, the findings in the present paper indicate that redox sensitivity may not solely be determined by thiols on the IP3R but could also involve other factors such as associated proteins or the local environment. This suggests that unraveling the molecular basis of redox sensing in these intracellular Ca2+ release channels will be a challenging task.
Recent studies indicate broad physiological and pathophysiological relevance of ROS (44, 45). The present results suggest that O2⨪ produced by multiple intracellular enzymes might utilize IP3R-mediated Ca2+ mobilization to make a contribution to cell signaling. Because DTT that reduces disulfide bonds in proteins had some desensitizing effects on the IP3R activity under resting conditions, low levels of ROS continually produced inside the cells might be relevant for IP3R function. However, the large effect of the O2⨪ generating system indicates that increased endogenous ROS production has the potential to enhance IP3R-linked calcium signaling. Our studies primarily focused on the effects of O2⨪ however, its breakdown product, H2O2 also seems to have sensitizing effect on the IP3R ((46, 47) and this work). ROS can also be converted to reactive nitrogen species, and reactive nitrogen species-mediated nitrosylation affects some components of calcium signaling, but its relevance for the IP3R is unclear.
Production of O2⨪ elicited frequency-modulated baseline-spike [Ca2+]c oscillation phenotype. Although some models of [Ca2+]c oscillations depend on fluctuations in [IP3] (48), we have also shown that exposure of IP3R to a stable [IP3] is sufficient to elicit [Ca2+]c oscillations mediated by positive and negative feedback effects of Ca2+ on IP3Rs (49). Thus, O2⨪-induced sensitization of the IP3R to IP3 might be able to promote [Ca2+]c oscillations at relatively low and stable [IP3]. Notably, our results support that extracellular superoxide anion increases cytoplasmic ROS, which can directly control IP3-induced Ca2+ release. It remains possible that a component of the calcium signaling response observed in intact cells is also due to enhanced IP3 formation, which could also be secondary to elevated [Ca2+]c.
The IP3Rs represent an intriguing target of ROS owing to their localization close to main ROS producing organelles (50). Both the ER that hosts IP3Rs and the mitochondria that are closely associated and physically coupled to the ER are central to cellular ROS production. It has been speculated that ROS produced by these organelles can locally expose the IP3Rs and ryanodine receptors (36, 50). However, these ideas remain to be tested by direct measurements of ROS at cellular subdomains. Our demonstration of the potential functional relevance of ROS in both ER Ca2+ mobilization and local Ca2+ transfer to the mitochondria should stimulate further studies of ROS at the surface and interface of ER and mitochondria.
Acknowledgment
We thank Dr. T. Kurosaki for providing DT40 cells.
This work was supported in part by National Institutes of Health Grants GM059419 (to G. H.), DK34804 (to S. K. J.), and DK053867 (to K. S.).
- IP3R
- inositol 1,4,5-trisphosphate receptor
- ER
- endoplasmic reticulum
- TKO
- triple knock-out
- ROS
- reactive oxygen species
- X
- xanthine
- XO
- xanthine oxidase
- DKO
- double knock-out.
REFERENCES
- 1. Berridge M. J. (2009) Inositol trisphosphate and calcium signalling mechanisms. Biochim. Biophys. Acta 1793, 933–940 [DOI] [PubMed] [Google Scholar]
- 2. Mikoshiba K. (2007) IP3 receptor/Ca2+ channel: from discovery to new signaling concepts. J. Neurochem. 102, 1426–1446 [DOI] [PubMed] [Google Scholar]
- 3. Petersen O. H., Tepikin A. V. (2008) Polarized calcium signaling in exocrine gland cells. Annu. Rev. Physiol. 70, 273–299 [DOI] [PubMed] [Google Scholar]
- 4. Sanderson M. J., Delmotte P., Bai Y., Perez-Zogbhi J. F. (2008) Regulation of airway smooth muscle cell contractility by Ca2+ signaling and sensitivity. Proc. Am. Thorac. Soc. 5, 23–31 [DOI] [PubMed] [Google Scholar]
- 5. Lewis R. S. (2001) Calcium signaling mechanisms in T lymphocytes. Annu. Rev. Immunol. 19, 497–521 [DOI] [PubMed] [Google Scholar]
- 6. Malcuit C., Kurokawa M., Fissore R. A. (2006) Calcium oscillations and mammalian egg activation. J. Cell Physiol. 206, 565–573 [DOI] [PubMed] [Google Scholar]
- 7. Szalai G., Krishnamurthy R., Hajnóczky G. (1999) Apoptosis driven by IP(3)-linked mitochondrial calcium signals. EMBO J. 18, 6349–6361 [DOI] [PMC free article] [PubMed] [Google Scholar]
- 8. Vanderheyden V., Devogelaere B., Missiaen L., De Smedt H., Bultynck G., Parys J. B. (2009) Regulation of inositol 1,4,5-trisphosphate-induced Ca2+ release by reversible phosphorylation and dephosphorylation. Biochim. Biophys Acta 1793, 959–970 [DOI] [PMC free article] [PubMed] [Google Scholar]
- 9. Betzenhauser M. J., Yule D. I. (2010) Regulation of inositol 1,4,5-trisphosphate receptors by phosphorylation and adenine nucleotides. Curr. Top. Membr. 10.1016/S1063-5823(10)66012-7 [DOI] [PubMed] [Google Scholar]
- 10. Patterson R. L., Boehning D., Snyder S. H. (2004) Inositol 1,4,5-trisphosphate receptors as signal integrators. Ann. Rev. Biochem. 73, 437–465 [DOI] [PubMed] [Google Scholar]
- 11. Joseph S. K. (2010) Role of thiols in the structure and function of inositol trisphosphate receptors. Curr. Top. Membr. 66, 299–322 [DOI] [PubMed] [Google Scholar]
- 12. Bootman M. D., Taylor C. W., Berridge M. J. (1992) The thiol reagent, thimerosal, evokes Ca2+ spikes in HeLa cells by sensitizing the inositol 1,4,5-trisphosphate receptor. J. Biol. Chem. 267, 25113–25119 [PubMed] [Google Scholar]
- 13. Bultynck G., Szlufcik K., Kasri N. N., Assefa Z., Callewaert G., Missiaen L., Parys J. B., De Smedt H. (2004) Thimerosal stimulates Ca2+ flux through inositol 1,4,5-trisphosphate receptor type 1, but not type 3, via modulation of an isoform-specific Ca2+-dependent intramolecular interaction. Biochem. J. 381, 87–96 [DOI] [PMC free article] [PubMed] [Google Scholar]
- 14. Khan S. A., Rossi A. M., Riley A. M., Potter B. V., Taylor C. W. (2013) Subtype-selective regulation of IP(3) receptors by thimerosal via cysteine residues within the IP(3)-binding core and suppressor domain. Biochem. J. 451, 177–184 [DOI] [PMC free article] [PubMed] [Google Scholar]
- 15. Bird G. S., Burgess G. M., Putney J. W., Jr. (1993) Sulfhydryl reagents and cAMP-dependent kinase increase the sensitivity of the inositol 1,4,5-trisphosphate receptor in hepatocytes. J. Biol. Chem. 268, 17917–17923 [PubMed] [Google Scholar]
- 16. Lock J. T., Sinkins W. G., Schilling W. P. (2011) Effect of protein S-glutathionylation on Ca2+ homeostasis in cultured aortic endothelial cells. Am. J. Physiol. Heart Circ. Physiol. 300, H493–H506 [DOI] [PMC free article] [PubMed] [Google Scholar]
- 17. Lock J. T., Sinkins W. G., Schilling W. P. (2012) Protein S-glutathionylation enhances Ca2+-induced Ca2+ release via the IP3 receptor in cultured aortic endothelial cells. The J. Physiol. 590, 3431–3447 [DOI] [PMC free article] [PubMed] [Google Scholar]
- 18. Joseph S. K., Lin C., Pierson S., Thomas A. P., Maranto A. R. (1995) Heteroligomers of type-I and type-III Inositol Trisphosphate receptors in WB rat liver epithelial cells. J. Biol. Chem. 270, 23310–23316 [DOI] [PubMed] [Google Scholar]
- 19. Wojcikiewicz R. J., He Y. (1995) Type I, II and III Inositol 1,4,5-Trisphosphate receptor co-immunoprecipitation as evidence for the existence heterotetrameric receptor complexes. Biochem. Biophys. Res. Commun. 213, 334–341 [DOI] [PubMed] [Google Scholar]
- 20. Mendes C. C., Gomes D. A., Thompson M., Souto N. C., Goes T. S., Goes A. M., Rodrigues M. A., Gomez M. V., Nathanson M. H., Leite M. F. (2005) The type III inositol 1,4,5-trisphosphate receptor preferentially transmits apoptotic Ca2+ signals into mitochondria. J. Biol. Chem. 280, 40892–40900 [DOI] [PubMed] [Google Scholar]
- 21. Brown G. C., Borutaite V. (2012) There is no evidence that mitochondria are the main source of reactive oxygen species in mammalian cells. Mitochondrion. 12, 1–4 [DOI] [PubMed] [Google Scholar]
- 22. Csordás G., Thomas A. P., Hajnóczky G. (1999) Quasi-synaptic calcium signal transmission between endoplasmic reticulum and mitochondria. EMBO J. 18, 96–108 [DOI] [PMC free article] [PubMed] [Google Scholar]
- 23. Csordás G., Renken C., Várnai P., Walter L., Weaver D., Buttle K. F., Balla T., Mannella C. A., Hajnóczky G. (2006) Structural and functional features and significance of the physical linkage between ER and mitochondria. J. Cell Biol. 174, 915–921 [DOI] [PMC free article] [PubMed] [Google Scholar]
- 24. Betzenhauser M. J., Wagner L. E., 2nd, Won J. H., Yule D. I. (2008) Studying isoform-specific inositol 1,4,5-trisphosphate receptor function and regulation. Methods 46, 177–182 [DOI] [PMC free article] [PubMed] [Google Scholar]
- 25. Leichert L. I., Jakob U. (2004) Protein thiol modifications visualized in vivo. PLoS Biol. 2, e333. [DOI] [PMC free article] [PubMed] [Google Scholar]
- 26. Csordás G., Hajnóczky G. (2001) Sorting of calcium signals at the junctions of endoplasmic reticulum and mitochondria. Cell Calcium 29, 249–262 [DOI] [PubMed] [Google Scholar]
- 27. Pacher P., Sharma K., Csordás G., Zhu Y., Hajnóczky G. (2008) Uncoupling of ER-mitochondrial calcium communication by transforming growth factor-β. Am. J. Physiol. Renal Physiol. 295, F1303–1312 [DOI] [PMC free article] [PubMed] [Google Scholar]
- 28. Akerboom J., Carreras Calderón N., Tian L., Wabnig S., Prigge M., Tolö J., Gordus A., Orger M. B., Severi K. E., Macklin J. J., Patel R., Pulver S. R., Wardill T. J., Fischer E., Schüler C., Chen T. W., Sarkisyan K. S., Marvin J. S., Bargmann C. I., Kim D. S., Kügler S., Lagnado L., Hegemann P., Gottschalk A., Schreiter E. R., Looger L. L. (2013) Genetically encoded calcium indicators for multi-color neural activity imaging and combination with optogenetics. Front. Mol. Neurosci. 6, 2. [DOI] [PMC free article] [PubMed] [Google Scholar]
- 29. Meyer A. J., Dick T. P. (2010) Fluorescent protein-based redox probes. Antioxid. Redox Signal. 13, 621–650 [DOI] [PubMed] [Google Scholar]
- 30. Gutscher M., Pauleau A. L., Marty L., Brach T., Wabnitz G. H., Samstag Y., Meyer A. J., Dick T. P. (2008) Real-time imaging of the intracellular glutathione redox potential. Nat. Methods 5, 553–559 [DOI] [PubMed] [Google Scholar]
- 31. Csordás G., Golenár T., Seifert E. L., Kamer K. J., Sancak Y., Perocchi F., Moffat C., Weaver D., de la Fuente Perez S., Bogorad R., Koteliansky V., Adijanto J., Mootha V. K., Hajnóczky G. (2013) MICU1 controls both the threshold and cooperative activation of the mitochondrial Ca2+ uniporter. Cell Metab. 17, 976–987 [DOI] [PMC free article] [PubMed] [Google Scholar]
- 32. Madesh M., Hajnóczky G. (2001) VDAC-dependent permeabilization of the outer mitochondrial membrane by superoxide induces rapid and massive cytochrome c release. J. Cell Biol. 155, 1003–1015 [DOI] [PMC free article] [PubMed] [Google Scholar]
- 33. Dooley C. T., Dore T. M., Hanson G. T., Jackson W. C., Remington S. J., Tsien R. Y. (2004) Imaging dynamic redox changes in mammalian cells with green fluorescent protein indicators. J. Biol. Chem. 279, 22284–22293 [DOI] [PubMed] [Google Scholar]
- 34. Hawkins B. J., Madesh M., Kirkpatrick C. J., Fisher A. B. (2007) Superoxide flux in endothelial cells via the chloride channel-3 mediates intracellular signaling. Mol. Biol. Cell 18, 2002–2012 [DOI] [PMC free article] [PubMed] [Google Scholar]
- 35. Madesh M., Hawkins B. J., Milovanova T., Bhanumathy C. D., Joseph S. K., Ramachandrarao S. P., Sharma K., Kurosaki T., Fisher A. B. (2005) Selective role for superoxide in InsP3 receptor-mediated mitochondrial dysfunction and endothelial apoptosis. The J. Cell Biol. 170, 1079–1090 [DOI] [PMC free article] [PubMed] [Google Scholar]
- 36. Brookes P. S., Yoon Y., Robotham J. L., Anders M. W., Sheu S. S. (2004) Calcium, ATP, and ROS: a mitochondrial love-hate triangle. Am. J. Physiol. Cell Physiol. 287, C817–C833 [DOI] [PubMed] [Google Scholar]
- 37. Higo T., Hattori M., Nakamura T., Natsume T., Michikawa T., Mikoshiba K. (2005) Subtype-specific and ER lumenal environment-dependent regulation of inositol 1,4,5-trisphosphate receptor type 1 by ERp44. Cell 120, 85–98 [DOI] [PubMed] [Google Scholar]
- 38. Enyedi B., Várnai P., Geiszt M. (2010) Redox state of the endoplasmic reticulum is controlled by Ero1L-α and intraluminal calcium. Antioxid. Redox Signal. 13, 721–729 [DOI] [PubMed] [Google Scholar]
- 39. Donoso P., Sanchez G., Bull R., Hidalgo C. (2011) Modulation of cardiac ryanodine receptor activity by ROS and RNS. Front Biosci. 16, 553–567 [DOI] [PubMed] [Google Scholar]
- 40. Prosser B. L., Khairallah R. J., Ziman A. P., Ward C. W., Lederer W. J. (2013) X-ROS signaling in the heart and skeletal muscle: Stretch-dependent local ROS regulates [Ca2+](i). J. Mol. Cell Cardiol. 58, 172–181 [DOI] [PMC free article] [PubMed] [Google Scholar]
- 41. Voss A. A., Lango J., Ernst-Russell M., Morin D., Pessah I. N. (2004) Identification of hyperreactive cysteines within ryanodine receptor type 1 by mass spectrometry. J. Biol. Chem. 279, 34514–34520 [DOI] [PubMed] [Google Scholar]
- 42. Aracena-Parks P., Goonasekera S. A., Gilman C. P., Dirksen R. T., Hidalgo C., Hamilton S. L. (2006) Identification of cysteines involved in S-nitrosylation, S-glutathionylation, and oxidation to disulfides in ryanodine receptor type 1. J. Biol. Chem. 281, 40354–40368 [DOI] [PubMed] [Google Scholar]
- 43. Petrotchenko E. V., Yamaguchi N., Pasek D. A., Borchers C. H., Meissner G. (2011) Mass spectrometric analysis and mutagenesis predict involvement of multiple cysteines in redox regulation of the skeletal muscle ryanodine receptor ion channel complex. Res. Rep. Biol 2011, 13–21 [DOI] [PMC free article] [PubMed] [Google Scholar]
- 44. Sena L. A., Chandel N. S. (2012) Physiological roles of mitochondrial reactive oxygen species. Mol. Cell 48, 158–167 [DOI] [PMC free article] [PubMed] [Google Scholar]
- 45. Malhotra J. D., Kaufman R. J. (2007) Endoplasmic reticulum stress and oxidative stress: a vicious cycle or a double-edged sword? Antioxid. Redox Signal. 9, 2277–2293 [DOI] [PubMed] [Google Scholar]
- 46. Redondo P. C., Salido G. M., Rosado J. A., Pariente J. A. (2004) Effect of hydrogen peroxide on Ca2+ mobilisation in human platelets through sulphydryl oxidation dependent and independent mechanisms. Biochem. Pharmacol. 67, 491–502 [DOI] [PubMed] [Google Scholar]
- 47. Zheng Y., Shen X. (2005) H2O2 directly activates inositol 1,4,5-trisphosphate receptors in endothelial cells. Redox Rep. 10, 29–36 [DOI] [PubMed] [Google Scholar]
- 48. Thomas A. P., Bird G. S., Hajnóczky G., Robb-Gaspers L. D., Putney J. W., Jr. (1996) Spatial and temporal aspects of cellular calcium signaling. FASEB J. 10, 1505–1517 [PubMed] [Google Scholar]
- 49. Hajnóczky G., Thomas A. P. (1997) Minimal requirements for calcium oscillations driven by the IP3 receptor. EMBO J. 16, 3533–3543 [DOI] [PMC free article] [PubMed] [Google Scholar]
- 50. Csordás G., Hajnóczky G. (2009) SR/ER-mitochondrial local communication: calcium and ROS. Biochim. Biophys. Acta 1787, 1352–1362 [DOI] [PMC free article] [PubMed] [Google Scholar]


