

Abstract
Previous behavioral and scanning studies have suggested that handedness is associated with differences in brain morphology as well as in anatomical and functional lateralization. However, little is known about the topological organization of the white matter (WM) structural networks related to handedness. We employed diffusion tensor imaging tractography to investigate handedness- and hemisphere-related differences in the topological organization of the human cortical anatomical network. After constructing left hemispheric/right hemispheric weighted structural networks in 32 right-handed and 24 left-handed healthy individuals, we analyzed the networks by graph theoretic analysis. We found that both the right and left hemispheric WM structural networks in the two groups possessed small-world attributes (high local clustering and short paths between nodes), findings which are consistent with recent results from whole-brain structural networks. In addition, the right hemisphere tended to be more efficient than the left hemisphere, suggesting a high efficiency of general information processing in the right hemisphere. Finally, we found that the right-handed subjects had significant asymmetries in small-world properties (normalized clustering coefficient γ, normalized path length λ, and small-worldness σ), while left-handed subjects had fewer asymmetries. Our findings from large-scale brain networks aid in understanding the structural substrates underlying handedness-related and hemisphere-related differences in cognition and behavior.
Key words: : diffusion tensor imaging, handedness, hemispheric, lateralization, small-world, structural networks
Introduction
Handedness has been considered not only a natural and non-invasive marker of functional asymmetry but also a hallmark of human evolution. Population bias toward right handedness is one of the most striking characteristics of humans. Although the various existing theories have studied the etiological factors leading to handedness, however, no consistent conclusions have been reached. Witelson et al. (1991) found that weaker axon loss during development enhanced the likelihood of left handedness and established more bilateral functional networks. Other studies reported that hand preference was probably determined by heredity (Annett, 1973; Hopkins, 2006; Szaflarski et al., 2002), by the sociocultural environment (Falek, 1959; Fears et al., 2011), and by fetal position (Churchill et al., 1962).
Anatomical asymmetries in the human brain may aid in understanding lateralized functions, such as hemispheric language dominance and hand preference (Beaton, 1997; Geschwind and Levitsky, 1968; Toga and Thompson, 2003). Both behavioral and scanning studies have statistically associated handedness with differences in brain morphology (Amunts et al., 2000; Tuncer et al., 2005) as well as in cerebral anatomical and functional lateralization (Cuzzocreo et al., 2009; Tremblay et al., 2004). Research into lateralization has indicated that the left hemisphere is dominant for language in right handers but that left handers may have a more variable lateralization of language, which is primarily characterized by rightward asymmetry (Haberling et al., 2011; Herve et al., 2013; Knecht et al., 2000) or bilateral speech representations (Rasmussen and Milner, 1977). Steinmetz et al. (1996) found that normal left handers showed a less left-lateralized planum temporale (a posterior temporal lobe region and component of Wernicke's language area) than normal right handers. Amunts et al. (2000) demonstrated that consistent right-handed individuals had a significantly deeper central sulcus in the left hemisphere than in the right hemisphere and that the anatomical asymmetry decreased significantly from consistent right- to mixed- to consistent left handers. Furthermore, volumetric analyses revealed a leftward asymmetry in right handers, which was found to be less marked in left handers (Herve et al., 2006). Using cortical thickness analyses, Luders et al. (2006) revealed a generally thicker cortex in the left hemisphere. Although previous studies have established hemispheric differences in sulcal depth, gray matter volume, and cortical thickness, little is known about the topological asymmetry of the human brain with regard to handedness.
Small-world topology is characterized by a high degree of local clustering and short path lengths linking individual network nodes (Achard et al., 2006; Bullmore and Sporns, 2009; Sporns et al., 2004). Several analyses of brain structural networks have used diffusion-weighted magnetic resonance imaging (MRI) techniques (Hagmann et al., 2008; Iturria-Medina et al., 2008) and concurrent differences in the various morphological regional indices (Bassett et al., 2008; Chen et al., 2008; He et al., 2007) to investigate large-scale connection patterns in the brain. Similarly, a number of studies used functional magnetic resonance imaging (fMRI) (Achard et al., 2006) or electroencephalogram (Ferri et al., 2007; Stam et al., 2007) to investigate functional connectivity networks. These studies at the whole-brain level have suggested that the human brain is structurally and functionally organized by small-world architecture. To date, only two studies have reported hemisphere-related differences in the topological organization of brain networks. Using structural brain networks, Iturria-Medina et al. (2011) found that the right hemisphere was more efficient and interconnected than the left hemisphere. In addition, employing resting-state functional MRI, Tian et al. (2011) found that men had a higher normalized clustering coefficient in a right hemispheric network than women. However, hemisphere-related differences in the topological organization of structural brain networks in handedness (especially in left handers) remain largely unknown.
In this article, we used diffusion-weighted MRI tractography and graph theoretical approaches to investigate hemisphere- and handedness-related differences in the organizational patterns of hemispheric structural networks in the human brain. We investigated (1) whether each hemispheric structural network would exhibit small-world attributes and high network efficiency, and (2) whether their topological properties (normalized clustering coefficient, normalized characteristic path length, small worldness, global efficiency, local efficiency, and nodal efficiency) would show hemisphere- or handedness-related differences.
Materials and Methods
Participants
The present study was approved by the local ethics committee of Tianjin Medical University. Written informed consent was obtained from each participant before any study procedure was initiated. Young healthy volunteers were recruited for this study and came primarily from the student population at Tianjin Medical University. Thirty-four right handers and 32 non-right handers (left handers and ambidextrous) participated in the MRI examinations, which were performed at Tianjin Medical University. Handedness was defined according to the criterion of the Chinese revised version of the Edinburgh Handedness Inventory (Oldfield, 1971) (see the Supplementary Table S1; Supplementary Data are available online at www.liebertpub.com/brain, for details). The handedness score S ranged from −100 to 100. Left handedness was indicated by S<−40, right handedness by S>+40, and ambidexterity by −40≤S≤+40. Our study only included consistently right- and left-handed subjects. Thus, 24 left-handed (10 women; age: 24.2±2.5 years old, range: 22–30; education: 17.3±2.7 years, handedness score: −67.08±11.60) and 32 right-handed participants (15 women; age: 25.8±1.9 years old, range: 19–29; education level: 18.4±1.6 years, handedness score: 95.3±8.79) were studied. None of the participants had any history of neurological or psychiatric problems.
Image acquisition
MR images were acquired using a Signa HDx 3.0 Tesla MR scanner (General Electric, Milwaukee, WI). Tight, but comfortable, foam padding was used to minimize head motion, and earplugs were used to reduce scanner noise. First, sagittal 3D T1-weighted images were acquired by a brain volume (BRAVO) sequence (TR/TE=8.1/3.1 msec; FA=13°; FOV=256×256 mm; matrix=256×256; slice thickness=1 mm, no gap; 176 slices). Then, the diffusion-weighted images were obtained using a spin echo-based echo planar imaging sequence in contiguous axial planes, including 50 volumes with diffusion gradients applied along 50 non-collinear directions (b=1000 sec/mm2) and 3 volumes without diffusion weighting (b=0 sec/mm2). Each volume consisted of 70 contiguous axial slices covering the whole brain (TR=15,000 msec; TE=72.9 msec; FA=90°; FOV=256×256 mm; matrix=128×128; slice thickness=2 mm, no gap).
Network construction
The definition of nodes and edges is a critical step, because they are the two basic elements of a network (Sporns et al., 2005). Since no gold standard exists for the definition of network nodes and edges, we defined the network nodes and edges as described in previous studies (Gong et al., 2009a; Shu et al., 2011).
Network node definition
The procedure for defining the nodes has been previously described (Iturria-Medina et al., 2008; Lo et al., 2010; Shu et al., 2011; Yan et al., 2011). We used the Automated Anatomical Labeling (AAL) atlas (Tzourio-Mazoyer et al., 2002), which includes both cortical and subcortical regions, to segment the cerebral cortex into 90 regions of interest (45 for each hemisphere, Table 1), each of which represented a node of the cortical network. The individual T1-weighted images were first coregistered to the b0 (non-diffusion-weighted) images in the diffusion-weighted MRI native space using a linear transformation. Then, the T1-weighted images were spatially normalized to the T1 template of ICBM152 in the Montreal Neurological Institute (MNI) space. The derived transformation parameters (T) were inverted and used to warp the AAL atlas from the MNI space to diffusion-weighted native space, resulting in a subject-specific AAL mask in the DTI native space (Fig. 1). All the image preprocessing, including image registration, spatial normalization, and participant-specific mask creation, was performed using Statistical Parametric Mapping 8 (SPM8; www.fil.ion.ucl.ac.uk/spm/).
Table 1.
Cortical and Subcortical Regions of Interest Defined in the Present Study
| Regions | No. | Abbreviations | Regions | No. | Abbreviations |
|---|---|---|---|---|---|
| Precentral gyrus | 1, 2 | PreCG | Lingual gyrus | 47, 48 | LING |
| Superior frontal gyrus, dorsolateral | 3, 4 | SFGdor | Superior occipital gyrus | 49, 50 | SOG |
| Superior frontal gyrus, orbital part | 5, 6 | SFGorb | Middle occipital gyrus | 51, 52 | MOG |
| Middle frontal gyrus | 7, 8 | MFG | Inferior occipital gyrus | 53, 54 | IOG |
| Middle frontal gyrus, orbital part | 9, 10 | MFGorb | Fusiform gyrus | 55, 56 | FFG |
| Inferior frontal gyrus, opercular part | 11, 12 | IFGoper | Postcentral gyrus | 57, 58 | PoCG |
| Inferior frontal gyrus, triangular part | 13, 14 | IFGtri | Superior parietal gyrus | 59, 60 | SPG |
| Inferior frontal gyrus, orbital part | 15, 16 | IFGorb | Inferior parietal gyrus | 61, 62 | IPG |
| Rolandic operculum | 17, 18 | ROL | Supramarginal gyrus | 63, 64 | SMG |
| Supplementary motor area | 19, 20 | SMA | Angular gyrus | 65, 66 | ANG |
| Olfactory cortex | 21, 22 | OLF | Precuneus | 67, 68 | PCUN |
| Superior frontal gyrus, medial | 23, 24 | SFGmed | Paracentral lobule | 69, 70 | PCL |
| Superior frontal gyrus, medial orbital | 25, 26 | SFGmorb | Caudate nucleus | 71, 72 | CAU |
| Gyrus rectus | 27, 28 | REC | Putamen | 73, 74 | PUT |
| Insula | 29, 30 | INS | Pallidum | 75, 76 | PAL |
| Anterior cingulate gyri | 31, 32 | ACC | Thalamus | 77, 78 | THA |
| Median cingulate gyri | 33, 34 | MCC | Heschl gyrus | 79, 80 | HES |
| Posterior cingulate gyrus | 35, 36 | PCC | Superior temporal gyrus | 81, 82 | STG |
| Hippocampus | 37, 38 | HIP | Temporal pole: superior temporal gyrus | 83, 84 | TPOsup |
| Parahippocampal gyrus | 39, 40 | PHIP | Middle temporal gyrus | 85, 86 | MTG |
| Amygdala | 41, 42 | AMYG | Temporal pole: middle temporal gyrus | 87, 88 | TPOmed |
| Calcarine fissure | 43, 44 | CAL | Inferior temporal gyrus | 89, 90 | ITG |
| Cuneus | 45, 46 | CUN |
FIG. 1.

Flowchart for the construction of a hemispheric white matter (WM) network by DTI. (1) Individual T1-weighted images were coregistered to the b0 images using a linear transformation. (2) The T1-weighted images were spatially normalized to the T1 template in Montreal Neurological Institute (MNI) space, obtaining the transformation matrix (T). (3) The inversed transformation matrix (T−1) was used to warp the Automated Anatomical Labeling (AAL) atlas in the MNI space to generate the participant-specific AAL mask in the DTI native space. (4) The construction of the DTI from diffusion-weighted images. The color-coded map indicates the directions of the first eigenvectors: red, left to right; green, anterior to posterior; blue, inferior to superior. (5) The reconstruction of all the WM fibers in the whole brain using DTI deterministic tractography. (6) Whole-brain weighted networks were created by computing the mean fractional anisotropy (FA) values of the fiber bundles that connected each pair of AAL regions. (7) Right (R) and left (L) hemispheric networks were obtained by eliminating the interhemispheric connections. Color images available online at www.liebertpub.com/brain
Diffusion MRI tractography
To reconstruct the whole-brain white matter (WM) tracts, we performed deterministic tractography to trace the fiber pathways using the following steps. First, the eddy current distortions and the motion artifacts in the DTI data set were corrected by using an affine registration of the diffusion-weighted images to the b0 images using FMRIB's Diffusion Toolbox in FSL (FMRIB's Software Library, www.fmrib.ox.ac.uk/fsl). Then, the diffusion tensor mode was calculated voxel by voxel by solving the Stejskal and Tanner equation (Shu et al., 2011; Westin et al., 2002), and diagonalization was performed to get three eigenvalues and three eigenvectors. The fractional anisotropy (FA) of each voxel was calculated as well (Guo et al., 2012a,b). DTI tractography was carried out in DTI native space using a linear propagation approach, which was dubbed fiber assignment by continuous tracking (FACT). Here, the fiber bundles of the whole brain were reconstructed with the streamline algorithm embedded in the Diffusion Toolkit (Mori et al., 1999; Wang et al., 2007). For each voxel, the orientation of the largest principal axis was assumed to define the direction of the dominant fiber bundles. Tracking in the data set was initiated from the center of each seed voxel with an FA>0.2 and iterated along its diffusion orientation. This tracking procedure continued until either a voxel turned an angle that exceeded 35° or reached a voxel with an FA<0.2.
Network edge definition
Two nodes were considered to be linked through an edge if at least one fiber connected them (Yan et al., 2011). For each edge, we calculated the mean FA value along the fiber bundles that connected the end nodes as its weight (Shu et al., 2011). After the nodes (anatomic brain regions) and edges (WM links and weights) were defined, whole brain-weighted networks were created for each of the subjects. Then, each whole-brain network was segmented into left and right hemispheric networks (removing the interhemispheric connections), with each one containing the same number of homolog regions (Fig. 1). Once the brain connectivity information was extracted from the neuroimaging data, the following network analyses were based on the two sets of weighted matrices for each individual: one for the left hemisphere and the other for the right hemisphere.
Network analysis
Graph theoretical analysis
The human brain is a complex network that enables the segregation and integration of information processing. Graph theoretical analysis provides a simple but powerful mathematical tool for characterizing the topological properties, such as modularity, efficiency, and hubs, of brain networks, (Bullmore and Sporns, 2009; He et al., 2007). Here, we first defined a graph G with N nodes and E edges (N=45 in this study).
The weighted clustering coefficient of a node i,  , which expresses the likelihood that the neighborhoods of node i are connected (Onnela et al., 2005), is defined as
 |
where ki is the degree of node i, and Wij is the weight between nodes i and j in the network. The weighted clustering coefficient of a network is the average of the clustering coefficients of all nodes:
 |
which quantifies the extent of the local clustering or cliquishness of a network.
The path length between nodes i and j is defined as the sum of the edge lengths along the path, where each edge's length is obtained by computing the reciprocal of the edge weight,  The weighted shortest path length
  between node i and node j is the length with the shortest path between the two nodes. The weighted characteristic shortest path length
  of a network is measured by a “harmonic mean” length between pairs, which is the reciprocal of the average of the reciprocals of all the nodes in the network (Zhang et al., 2011). We calculated the
  as follows:
 |
which quantifies the ability of a network to propagate information in parallel.
The global efficiency Eglob of a graph G is defined as (Achard and Bullmore, 2007; Latora and Marchiori, 2001) follows:
 |
where  is the shortest path length between node i and node j in the weighted network G. It measures the global efficiency of parallel information exchange in a network. On the other hand, the local efficiency Eloc is the mean of all the efficiencies of the subgraph Gi in the graph, which is defined as follows:
 |
which measures the fault tolerance of a network, indicating how efficient the communication is among the nearest neighbors of i when node i is removed.
To investigate the regional characteristic of the hemispheric WM network, the efficiency of the node i is computed:
 |
where  is the shortest path length between node i and node j in the network G. This measures the importance of the nodes for communication within the network (Lo et al., 2010).
Small-world networks should meet the following criteria: the normalized clustering coefficient  and normalized characteristic path length
  , where
  and
and  are the mean clustering coefficient and characteristic shortest path length of 100 matched random networks that preserve the same number of nodes, edges, and degree distribution as the real network (Sporns and Zwi, 2004). Furthermore, the two metrics can be integrated to form the small-worldness index σ=γ/λ>1 (Humphries et al., 2006). Small-world networks also have high global and local communication efficiency (Achard and Bullmore, 2007; Latora and Marchiori, 2001), providing them with a good balance between local necessities and wide-scope interactions (Iturria-Medina et al., 2011). In this study, in order to better understand the small-world properties of the hemispheric structural networks, we primarily focused on six network parameters: normalized clustering coefficient (γ), normalized characteristic path length (λ), small worldness (σ), global efficiency (Eglob), local efficiency (Eloc), and nodal efficiency (Emodal).
Threshold selection
In this study, we repeatedly thresholded each weighted matrix over a range of sparsity values (S) from 0.17 to 0.47 at intervals of 0.01, including between 17% and 47% of the 990 possible edges in a network of 45 nodes. The minimum threshold (S=0.17) calculated from the average degree over all the nodes should be at least 2×log(N) (Bassett et al., 2008; Liao et al., 2011). The maximum threshold (S=0.47) was selected to assure that each network was fully connected with N=45 nodes (Liu et al., 2008; Stam et al., 2007). Then, we calculated the area under the curve (AUC) for each network index, providing a summarized scalar for the topological characterization of the resulting brain networks, independent of any single threshold selection. The integrated AUC of a network metric Y was computed over the sparsity threshold range from S1 to Sn with an interval of ΔS, which was defined as follows:
 |
Lateralization index
Asymmetry of a given network was characterized by a measure called the lateralization index (LI), which is defined as in Benson et al. (1999) and Tian et al. (2011):
 |
where X(R) and X(L) denote the topological properties of the right and left hemispheric networks, respectively. f is a scaling factor that indicates the range of LI, here f is 200. A positive LI indicates a right hemisphere bias, and a negative LI indicates a left hemisphere bias.
Statistical analysis
To determine whether significant differences between the four subgroups (2 hemisphere×2 handedness) could be identified in any of the five global parameters (γ, λ, σ, Eglob, Eloc), we performed a two-way repeated-measures analysis of variance (ANOVA) with handedness (right hander and left hander) as a between-subject factor and hemisphere (right hemisphere and left hemisphere) as a within-subject factor. p<0.05 was accepted as the significance level. Similar statistical methods were used to assess regional nodal efficiency. The Bonferroni correction was applied for the ANOVA analysis of nodal efficiency using a statistical significance level of p<0.001.
Results
Hemispheric small-world anatomical networks
We constructed two anatomical weighted networks based on the right and left hemispheres for each participant and found that all the four subgroup (2 hemisphere×2 handedness) networks exhibited higher clustering coefficients (γ>1) but almost identical characteristic path lengths (λ≈1) over the sparsity range of 17–47% compared with matched random networks. In addition, the small-worldness σ was >1 (Fig. 2), suggesting the presence of small-world attributes in anatomical weighted networks (Watts and Strogatz, 1998). The findings indicated that the human brain's anatomical hemispheric networks also support local and distributed information processing. The results are consistent with previous hemisphere-related brain network studies (Iturria-Medina et al., 2011; Tian et al., 2011).
FIG. 2.

Small-world properties of the hemispheric structural networks over a range of sparsity thresholds (S). (A) right hemispheric networks of right-handers; (B) left hemispheric networks of right-handers; (C) right hemispheric networks of left-handers; (D) left hemispheric networks of left-handers. Gamma, lambda, and sigma denote the normalized clustering coefficient, normalized characteristic path length, and small worldness, respectively. They were evaluated using the subjects' hemispheric networks. The four hemispheric networks had an average gamma >1, an average lambda of nearly 1, and small-worldness sigma of >1, which indicate small-world properties.
Handedness- and hemisphere-related topological organization of hemispheric brain networks
Neither the handedness effect nor the interaction between handedness and hemisphere was found to be significant on any of the global or regional network properties (p<0.05). However, we found a significant main effect of hemisphere on certain small-world parameters: normalized clustering coefficient γ (F=13.40, p=0.001), normalized path length λ (F=8.49, p=0.005), and small worldness σ (F=10.08, p=0.002) (Table 2). A significant hemisphere effect on the nodal efficiency (p<0.001) was detected in 16 regions. Specifically, eight brain regions showed greater nodal efficiency in the right than in the left hemisphere, and eight regions showed greater efficiency in the left than in the right hemisphere (Fig. 3, see more details in Table 3).
Table 2.
Handedness and Hemisphere Effects on Global Network Properties Revealed by Two-Way Repeated ANOVA
| γ | λ | σ | Eglob | Eloc | |
|---|---|---|---|---|---|
| Hemisphere effect | |||||
| F-Value | 13.40 | 8.49 | 10.08 | 1.60 | 0.94 |
| p-Value | 0.001 | 0.005 | 0.002 | 0.21 | 0.34 |
| Handedness effect | |||||
| F-Value | 2.31 | 0.32 | 2.83 | 0.51 | 0.22 |
| p-Value | 0.13 | 0.57 | 0.10 | 0.48 | 0.64 |
| Interaction | |||||
| F-Value | 1.13 | 0.16 | 0.99 | 0.54 | 0.02 |
| p-Value | 0.69 | 0.29 | 0.32 | 0.47 | 0.89 |
γ, λ, σ, Eglob, and Eloc denote the normalized clustering coefficient, normalized shortest pathlength, small worldness, global efficiency, and local efficiency, respectively. Significant effects (p<0.05) are identified by bold text.
ANOVA, analysis of variance.
FIG. 3.
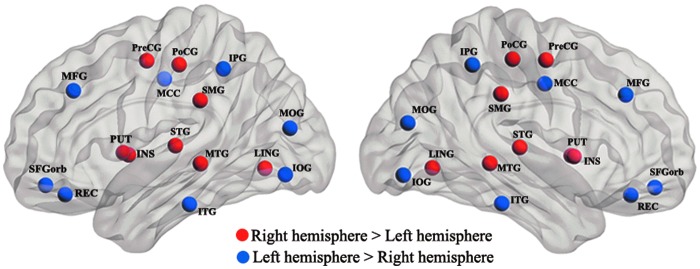
Hemisphere effect on nodal efficiency, as revealed by two-way repeated analysis of variances (ANOVAs). The red color nodes represent the rightward asymmetries, and blue color nodes indicate the leftward asymmetries. Statistical significance was reached when p<0.001 using a Bonferroni correction. Color images available online at www.liebertpub.com/brain
Table 3.
Hemisphere Effects on Nodal Efficiency Revealed by Two-Way Repeated ANOVA
| Main effects of hemisphere | Main effects of hemisphere | ||
|---|---|---|---|
| Left>right | Right>left | ||
| Region | F_Value (p_value) | Region | F_Value (p_value) |
| SFGorb | 19.77 (2.13e-05) | PreCG | 47.11 (4.40e-10) |
| MFG | 15.19 (1.69e-04) | INS | 16.11 (1.10e-04) |
| REC | 14.61 (2.21e-04) | LING | 23.89 (3.57e-06) |
| MCC | 14.22 (2.66e-04) | PoCG | 31.83 (1.37e-07) |
| MOG | 61.69 (3.17e-12) | SMG | 49.09 (2.19e-10) |
| IOG | 26.79 (1.06e-06) | PUT | 38.11 (1.19e-08) |
| IPG | 18.95 (3.06e-05) | STG | 51.24 (1.04e-10) |
| ITG | 11.79 (8.45e-04) | MTG | 17.20 (6.72e-05) |
The threshold was p<0.001. The identity of the abbreviation for each region can be found in Table 1.
Left, left hemisphere; right, right hemisphere.
The lateralization index
The structural LIs were evaluated between the right and left hemispheric networks across five global and one regional network properties. The obtained LIs showed significant (paired t-test, p<0.05) lateralization of the topological properties in the right handers but no significant lateralization in the left handers (Fig. 4, see more details in Table 4).
FIG. 4.

Over a wide range of sparsities (S), paired t-tests were performed to investigate the lateralization in each group. (A, C, E) Showed significantly right-ward bias (right hemisphere larger than left hemisphere) in the normalized clustering coefficient γ, normalized path length λ, and small-worldness σ in the right-hand group. (B, D, F) Showed symmetrical topological properties in the left-hand group. The stars on top of the boxplot indicate significant statistical differences between the left hemisphere and the right hemisphere (p<0.05).
Table 4.
Lateralization Indexes of the Network Parameters
| γ | λ | σ | Eglob | Eloc | |
|---|---|---|---|---|---|
| Left handers | |||||
| t-Value | 1.68 | 1.49 | 1.22 | 0.41 | 0.49 |
| p-Value | 0.11 | 0.15 | 0.24 | 0.69 | 0.63 |
| Right handers | |||||
| t-Value | 4.09 | 2.50 | 3.68 | 1.36 | 0.86 |
| p-Value | 2.84e-04 | 0.017 | 8.88e-04 | 0.18 | 0.40 |
Data from left- and right handers indicates the significance of the lateralization index. γ, λ, σ, Eglob, and Eloc denote the normalized clustering coefficient, normalized shortest path length, small worldness, global efficiency, and local efficiency, respectively. Positive t-scores of the left- and right handers indicate a rightward bias, and negative scores indicate a leftward bias. Significant effects (p<0.05) are identified by bold text.
The LI of the nodal efficiency showed more asymmetric regions in the right-handed group than in the left-handed group (12 vs. 7 lateralized regions, respectively). The asymmetries identified by the lateralization were in the same direction as those identified by the ANOVA (Supplementary Fig. S1 and Supplementary Table S2).
Discussion
We studied 24 left-handed and 32 right-handed subjects using DTI tractography and graph theoretical approaches to investigate handedness- and hemispheric-related differences in the topological organization of the brain. Our analyses of the four weighted hemispheric networks focused on small-world attributes and efficiencies. The main findings were as follows: (1) All four hemispheric WM structural networks exhibited small-world attributes (high clustering and short path length); (2) the right hemisphere was more efficient than the left hemisphere; and (3) asymmetries of topological properties (γ, λ, σ, Enodal) were found to be pronounced in right-handed subjects but not in left-handed subjects. Our findings indicate that the topological organization within the hemispheric structural networks is not equally distributed in right- and left-handed subjects.
Small-world properties of human brain hemispheric networks
Human brain networks have been widely shown to have small-world properties, which enable them to have both global and local parallel information processing (Bassett and Bullmore, 2006; Watts and Strogatz, 1998). The evidence for this has come from both structural brain networks (Gong et al., 2009a; He et al., 2007) and functional brain networks (Achard and Bullmore, 2007; Bassett and Bullmore, 2006; Ding et al., 2011; van den Heuvel et al., 2008). Here, we showed that the hemispheric structural brain networks of left-handed and right-handed individuals had a small-world topology (Fig. 2), indicating that the fundamental organization of each cerebral hemisphere is in highly clustered sub-networks, combined with a high level of global connectivity. The small-world topology of the hemispheric structural networks observed in the current study is in line with a previous hemispheric functional study (Tian et al., 2011) which suggested that the efficiency of information processing in the separate hemispheres is similar to that in the whole brain.
Hemisphere related differences in global properties
The right hemisphere showed significantly stronger small-world topological properties (normalized clustering coefficient γ, normalized path length λ, and small-worldness σ) than the left hemisphere (Table 2), indicating that the right hemisphere may be more efficient in information processing.
Although the left and right hemispheres are in continual communication with each other, differences between the two hemispheres have commonly been reported. In particular, the left hemisphere is dominant for language (Friederici, 2012; Hull and Vaid, 2007; Price, 2012) and the right hemisphere is dominant for attention (Corbetta and Shulman, 2011; Corbetta et al., 2005; Smith et al., 2013). However, a few studies have reported differences in the topological properties of human hemispheric brain networks. Recently, Iturrial-Medina et al. (2011) showed that the right hemisphere was significantly more efficient, with consistent rightward global efficiency and local efficiency, than the left hemisphere in right-handed individuals. In addition, a significant rightward asymmetry in WM volume was also reported in healthy subjects (Barrick et al., 2005). Both of the whole-hemisphere scale studies cited earlier suggested that, compared with the leading role of specialized processing in the left hemisphere (such as language and motor actions), the right hemisphere has a leading role in general information processing (such as integration tasks) (Barrick et al., 2005; Iturria-Medina et al., 2011). Small-world networks are known to show a robust network architecture in which information is transformed and integrated with a high level of efficiency (Latora and Marchiori, 2001; Sporns et al., 2004). In our study, we found that the small-world parameters were significantly rightward. Thus, our hemisphere-scale study also suggested a high efficiency of general information processing in the right hemisphere, supporting a previous study (Iturria-Medina et al., 2011).
Hemisphere-related differences in nodal efficiency
Nodal efficiency is a regional network parameter that indicates the variable cost during information processing (Achard and Bullmore, 2007). Our study revealed 16 nodes that were significantly asymmetric with regard to nodal efficiency (p<0.05, Bonferroni correction; Fig. 3 and Table 3). Such lateralization may play important roles related to hemisphere-specific functional specialization.
Eight nodes (the MFG, the MOG, the IOG, the IPG, the ITG, the SFGorb, the REG, and the MCC) exhibited leftward asymmetries. These findings align closely with a cortical thickness investigation (Luders et al., 2006) that showed significant leftward asymmetries in the anterior temporal lobe, including the ITG, the IPG, and superior frontal regions extending in the orbital gyrus (SFGorb). A thicker cortex indicates denser cell packing or an increased number of cortical neurons (Eickhoff et al., 2005), either of which could facilitate information transfer. In addition, significant leftward asymmetries of the betweenness centrality in the IOG and the MCC (Iturria-Medina et al., 2011) have been reported, as well as significant left-greater-than-right FA values in the cingulum bundle (Gong et al., 2005). Both studies indicated a more coherent connectivity or fiber organization in the left hemisphere in regions that correspond to our findings. The leftward asymmetries in the occipital regions that we observed also agree with many previous functional and structural imaging studies (Gong et al., 2009a; Tian et al., 2011; Toga and Thompson, 2003).
Significant rightward asymmetries were found primarily in four temporal regions (the INS, the LING, the STG, and the MTG) as well as in the SMG, the PreCG, the PUT, and the PoCG. Our finding of a right skew in the PreCG and PoCG was inconsistent with a number of reports of left asymmetry based on various techniques (Amunts et al., 2000; Luders et al., 2006; Petit et al., 2009). Further studies should focus on more precise parcellations or tractography algorithms. Previous studies suggested that the INS is involved in the right-lateralized attentional system and exhibits significant rightward structural or functional asymmetries (Tian et al., 2011; Watkins et al., 2001). The STG has been repeatedly reported to show rightward asymmetry (Luders et al., 2006; Tian et al., 2011), and a rightward asymmetry for the volume of the MTG was observed in a postmortem study (Highley et al., 1999). Thus, our findings of significant rightward asymmetries in the INS, the STG, and the MTG confirmed previous studies. Rightward nodal efficiency in the SMG is an additional interesting result, which is agreement with the documented rightward lateralization in the SMG in healthy humans using the betweenness centrality (Iturria-Medina et al., 2011). The right hemisphere plays a dominant role in the implementation of visuospatial attention (Corbetta and Shulman, 2011; Shulman et al., 2010; Smith et al., 2013), and lesions in the right SMG may cause visuospatial attentional neglect (Halligan et al., 2003; Husain and Rorden, 2003; Leibovitch et al., 1998). The observed rightward asymmetry in the SMG using the nodal efficiency of the WM network further indicates why the widely investigated phenomenon of visuo-attentional neglect is more commonly a consequence of right hemisphere damage.
The LIs of brain networks
The topological properties, including the normalized clustering coefficient γ, the normalized path length λ, and the small-worldness σ, were significantly asymmetric in the right-handed subjects. However, the differences in these topological properties between the left and the right hemispheres in the left handers were inconspicuous (Fig. 4 and Table 4). To the best of our knowledge, this is the first study that reported asymmetric trends in brain structural topology in left-and right handers. Although there is no significant handedness-hemisphere interaction, the results provide novel insights into previously reported anatomical and functional asymmetries from a large-scale network perspective. In addition, the average Edinburgh Handedness score of our left handers was only −67.1, which indicates a weak degree of (>− 80) left handedness; whereas the average score of the right handers was 95.3, suggesting a strong degree of (>80) right handedness. Recruiting much stronger left-handed participants, similar to our right handers, will be necessary for future studies.
Potential limitations
Several limitations in the current study should be noted. First, we assessed the handedness according to the Chinese revised version of the Edinburgh Handedness Inventory. A longer questionnaire with a wider response format seems to be required, if the primary aim is to investigate handedness as the chief phenomenon of interest. Second, the edges of the structural connectivity networks were defined using deterministic streamline tractography, as has been done in other studies (Shu et al., 2011; Zhang et al., 2011). This tracking procedure always stops when it traces through regions of crossing fibers, assumes a Gaussian diffusion, and also assumes that only a single fiber exists per voxel (Descoteaux et al., 2009). However, some of WM voxels contain more than one fiber bundle orientation, leading to an inaccurate depiction of the tract and a premature stop in regions with isotropic tensors (Behrens et al., 2007). Thus, deterministic tractography favors short connections, which may bias the measure of efficiency. On the other hand, probabilistic tractography (Gong et al., 2009b) is able to overcome fiber crossing through complex orientation fields and can better deal with partial volume averaging effects and noise in the estimated fiber directions. However, the connectivity maps from probabilistic tractography are harder to interpret visually and tend to leak into unexpected regions of the brain WM (Qazi et al., 2009). Of the two families of tractography algorithms, probabilistic tractography techniques may prove to be helpful for addressing more sophisticated questions and may provide accurate results in future work. Third, the AAL atlas was used to parcellate the whole brain into 90 regions in this study. However, recent studies indicated that different parcellations or different spatial scales generated different results (Hayasaka and Laurienti, 2010; Zalesky et al., 2010). Thus, further studies should determine which brain parcellation or spatial scale is most appropriate for studying the human brain. Finally, the big differences (24 vs. 32) in this small sample size may limit the translational value of our results. In the future, a more nearly equal and a larger imaging dataset will be necessary to confirm our findings.
Conclusion
Using DTI tractography and graph theoretical methods, we examined the relationships between the structural connectivity patterns of human hemispheric networks and handedness/hemisphere. We found that the right hemisphere had significantly greater small-world attributes, implying a hemisphere main effect. Moreover, we demonstrated that left- and right-handed individuals have different lateralization patterns in their topological properties. Unlike previous studies, the present study provides a large-scale network perspective for understanding how the human cortical neuroanatomy is associated with handedness and hemisphere. Further studies should be conducted to explore whether left preference or decreased asymmetry at either the global or regional level are markers for intellectual, temperament, or behavioral differences, as well as for the relative risk of specific brain diseases.
Supplementary Material
Acknowledgments
The authors are grateful for the interest and participation of all the volunteers. They also appreciate the extensive English and content editing assistance of Rhoda E. and Edmund F. Perozzi. This work was supported by grants from 973 Project 2012CB517901, the Natural Science Foundation of China (61125304, 61035006, and 61273361), and the Key Technology R&D Program of Sichuan Province (2012SZ0159).
Author Disclosure Statement
The authors have declared that no competing interests exist.
References
- Achard S, Bullmore E. 2007. Efficiency and cost of economical brain functional networks. PLoS Comput Biol 3:e17. [DOI] [PMC free article] [PubMed] [Google Scholar]
- Achard S, Salvador R, Whitcher B, Suckling J, Bullmore E. 2006. A resilient, low-frequency, small-world human brain functional network with highly connected association cortical hubs. J Neurosci 26:63–72 [DOI] [PMC free article] [PubMed] [Google Scholar]
- Amunts K, Jancke L, Mohlberg H, Steinmetz H, Zilles K. 2000. Interhemispheric asymmetry of the human motor cortex related to handedness and gender. Neuropsychologia 38:304–312 [DOI] [PubMed] [Google Scholar]
- Annett M. 1973. Handedness in families. Ann Hum Genet 37:93–105 [DOI] [PubMed] [Google Scholar]
- Barrick TR, Mackay CE, Prima S, Maes F, Vandermeulen D, Crow TJ, Roberts N. 2005. Automatic analysis of cerebral asymmetry: an exploratory study of the relationship between brain torque and planum temporale asymmetry. Neuroimage 24:678–691 [DOI] [PubMed] [Google Scholar]
- Bassett DS, Bullmore E. 2006. Small-world brain networks. Neuroscientist 12:512–523 [DOI] [PubMed] [Google Scholar]
- Bassett DS, Bullmore E, Verchinski BA, Mattay VS, Weinberger DR, Meyer-Lindenberg A. 2008. Hierarchical organization of human cortical networks in health and schizophrenia. J Neurosci 28:9239–9248 [DOI] [PMC free article] [PubMed] [Google Scholar]
- Beaton AA. 1997. The relation of planum temporale asymmetry and morphology of the corpus callosum to handedness, gender, and dyslexia: a review of the evidence. Brain Lang 60:255–322 [DOI] [PubMed] [Google Scholar]
- Behrens TE, Berg HJ, Jbabdi S, Rushworth MF, Woolrich MW. 2007. Probabilistic diffusion tractography with multiple fibre orientations: what can we gain? Neuroimage 34:144–155 [DOI] [PMC free article] [PubMed] [Google Scholar]
- Benson RR, et al. 1999. Language dominance determined by whole brain functional MRI in patients with brain lesions. Neurology 52:798–809 [DOI] [PubMed] [Google Scholar]
- Bullmore E, Sporns O. 2009. Complex brain networks: graph theoretical analysis of structural and functional systems. Nat Rev Neurosci 10:186–198 [DOI] [PubMed] [Google Scholar]
- Chen ZJ, He Y, Rosa-Neto P, Germann J, Evans AC. 2008. Revealing modular architecture of human brain structural networks by using cortical thickness from MRI. Cereb Cortex 18:2374–2381 [DOI] [PMC free article] [PubMed] [Google Scholar]
- Churchill JA, Igna E, Senf R. 1962. The association of position at birth and handedness. Pediatrics 29:307–309 [PubMed] [Google Scholar]
- Corbetta M, Kincade MJ, Lewis C, Snyder AZ, Sapir A. 2005. Neural basis and recovery of spatial attention deficits in spatial neglect. Nat Neurosci 8:1603–1610 [DOI] [PubMed] [Google Scholar]
- Corbetta M, Shulman GL. 2011. Spatial neglect and attention networks. Annu Rev Neurosci 34:569–599 [DOI] [PMC free article] [PubMed] [Google Scholar]
- Cuzzocreo JL, Yassa MA, Verduzco G, Honeycutt NA, Scott DJ, Bassett SS. 2009. Effect of handedness on fMRI activation in the medial temporal lobe during an auditory verbal memory task. Hum Brain Mapp 30:1271–1278 [DOI] [PMC free article] [PubMed] [Google Scholar]
- Descoteaux M, Deriche R, Knosche TR, Anwander A. 2009. Deterministic and probabilistic tractography based on complex fibre orientation distributions. IEEE Trans Med Imaging 28:269–286 [DOI] [PubMed] [Google Scholar]
- Ding JR, Liao W, Zhang Z, Mantini D, Xu Q, Wu GR, Lu G, Chen H. 2011. Topological fractionation of resting-state networks. PLoS One 6:e26596. [DOI] [PMC free article] [PubMed] [Google Scholar]
- Eickhoff S, Walters NB, Schleicher A, Kril J, Egan GF, Zilles K, Watson JD, Amunts K. 2005. High-resolution MRI reflects myeloarchitecture and cytoarchitecture of human cerebral cortex. Hum Brain Mapp 24:206–215 [DOI] [PMC free article] [PubMed] [Google Scholar]
- Falek A. 1959. Handedness: a family study. Am J Hum Genet 11:52–62 [PMC free article] [PubMed] [Google Scholar]
- Fears SC, Scheibel K, Abaryan Z, Lee C, Service SK, Jorgensen MJ, Fairbanks LA, Cantor RM, Freimer NB, Woods RP. 2011. Anatomic brain asymmetry in vervet monkeys. PLoS One 6:e28243. [DOI] [PMC free article] [PubMed] [Google Scholar]
- Ferri R, Rundo F, Bruni O, Terzano MG, Stam CJ. 2007. Small-world network organization of functional connectivity of EEG slow-wave activity during sleep. Clin Neurophysiol 118:449–456 [DOI] [PubMed] [Google Scholar]
- Friederici AD. 2012. The cortical language circuit: from auditory perception to sentence comprehension. Trends Cogn Sci 16:262–268 [DOI] [PubMed] [Google Scholar]
- Geschwind N, Levitsky W. 1968. Human brain: left-right asymmetries in temporal speech region. Science 161:186–187 [DOI] [PubMed] [Google Scholar]
- Gong G, He Y, Concha L, Lebel C, Gross DW, Evans AC, Beaulieu C. 2009a. Mapping anatomical connectivity patterns of human cerebral cortex using in vivo diffusion tensor imaging tractography. Cereb Cortex 19:524–536 [DOI] [PMC free article] [PubMed] [Google Scholar]
- Gong G, Jiang T, Zhu C, Zang Y, Wang F, Xie S, Xiao J, Guo X. 2005. Asymmetry analysis of cingulum based on scale-invariant parameterization by diffusion tensor imaging. Hum Brain Mapp 24:92–98 [DOI] [PMC free article] [PubMed] [Google Scholar]
- Gong G, Rosa-Neto P, Carbonell F, Chen ZJ, He Y, Evans AC. 2009b. Age- and gender-related differences in the cortical anatomical network. J Neurosci 29:15684–15693 [DOI] [PMC free article] [PubMed] [Google Scholar]
- Guo W, Liu F, Liu Z, Gao K, Xiao C, Chen H, Zhao J. 2012a. Right lateralized white matter abnormalities in first-episode, drug-naive paranoid schizophrenia. Neurosci Lett 531:5–9 [DOI] [PubMed] [Google Scholar]
- Guo WB, et al. 2012b. Altered white matter integrity of forebrain in treatment-resistant depression: a diffusion tensor imaging study with tract-based spatial statistics. Prog Neuropsychopharmacol Biol Psychiatry 38:201–206 [DOI] [PubMed] [Google Scholar]
- Haberling IS, Badzakova-Trajkov G, Corballis MC. 2011. Callosal tracts and patterns of hemispheric dominance: a combined fMRI and DTI study. Neuroimage 54:779–786 [DOI] [PubMed] [Google Scholar]
- Hagmann P, Cammoun L, Gigandet X, Meuli R, Honey CJ, Wedeen VJ, Sporns O. 2008. Mapping the structural core of human cerebral cortex. PLoS Biol 6:e159. [DOI] [PMC free article] [PubMed] [Google Scholar]
- Halligan PW, Fink GR, Marshall JC, Vallar G. 2003. Spatial cognition: evidence from visual neglect. Trends Cogn Sci 7:125–133 [DOI] [PubMed] [Google Scholar]
- Hayasaka S, Laurienti PJ. 2010. Comparison of characteristics between region-and voxel-based network analyses in resting-state fMRI data. Neuroimage 50:499–508 [DOI] [PMC free article] [PubMed] [Google Scholar]
- He Y, Chen ZJ, Evans AC. 2007. Small-world anatomical networks in the human brain revealed by cortical thickness from MRI. Cereb Cortex 17:2407–2419 [DOI] [PubMed] [Google Scholar]
- Herve PY, Crivello F, Perchey G, Mazoyer B, Tzourio-Mazoyer N. 2006. Handedness and cerebral anatomical asymmetries in young adult males. Neuroimage 29:1066–1079 [DOI] [PubMed] [Google Scholar]
- Herve PY, Zago L, Petit L, Mazoyer B, Tzourio-Mazoyer N. 2013. Revisiting human hemispheric specialization with neuroimaging. Trends Cogn Sci 17:69–80 [DOI] [PubMed] [Google Scholar]
- Highley JR, McDonald B, Walker MA, Esiri MM, Crow TJ. 1999. Schizophrenia and temporal lobe asymmetry. A post-mortem stereological study of tissue volume. Br J Psychiatry 175:127–134 [DOI] [PubMed] [Google Scholar]
- Hopkins WD. 2006. Comparative and familial analysis of handedness in great apes. Psychol Bull 132:538–559 [DOI] [PMC free article] [PubMed] [Google Scholar]
- Hull R, Vaid J. 2007. Bilingual language lateralization: a meta-analytic tale of two hemispheres. Neuropsychologia 45:1987–2008 [DOI] [PubMed] [Google Scholar]
- Humphries MD, Gurney K, Prescott TJ. 2006. The brainstem reticular formation is a small-world, not scale-free, network. Proc Biol Sci 273:503–511 [DOI] [PMC free article] [PubMed] [Google Scholar]
- Husain M, Rorden C. 2003. Non-spatially lateralized mechanisms in hemispatial neglect. Nat Rev Neurosci 4:26–36 [DOI] [PubMed] [Google Scholar]
- Iturria-Medina Y, Sotero RC, Canales-Rodriguez EJ, Aleman-Gomez Y, Melie-Garcia L. 2008. Studying the human brain anatomical network via diffusion-weighted MRI and Graph Theory. Neuroimage 40:1064–1076 [DOI] [PubMed] [Google Scholar]
- Iturria-Medina Y, Pérez Fernández A, Morris DM, et al. 2011. Brain hemispheric structural efficiency and interconnectivity rightward asymmetry in human and nonhuman primates. Cereb Cortex 21:56–67 [DOI] [PubMed] [Google Scholar]
- Knecht S, Drager B, Deppe M, Bobe L, Lohmann H, Floel A, Ringelstein EB, Henningsen H. 2000. Handedness and hemispheric language dominance in healthy humans. Brain 123Pt 12:2512–2518 [DOI] [PubMed] [Google Scholar]
- Latora V, Marchiori M. 2001. Efficient behavior of small-world networks. Phys Rev Lett 87:198701. [DOI] [PubMed] [Google Scholar]
- Leibovitch FS, Black SE, Caldwell CB, Ebert PL, Ehrlich LE, Szalai JP. 1998. Brain-behavior correlations in hemispatial neglect using CT and SPECT: the Sunnybrook Stroke Study. Neurology 50:901–908 [DOI] [PubMed] [Google Scholar]
- Liao W, Ding J, Marinazzo D, Xu Q, Wang Z, Yuan C, Zhang Z, Lu G, Chen H. 2011. Small-world directed networks in the human brain: multivariate Granger causality analysis of resting-state fMRI. Neuroimage 54:2683–2694 [DOI] [PubMed] [Google Scholar]
- Liu Y, Liang M, Zhou Y, He Y, Hao Y, Song M, Yu C, Liu H, Liu Z, Jiang T. 2008. Disrupted small-world networks in schizophrenia. Brain 131:945–961 [DOI] [PubMed] [Google Scholar]
- Lo CY, Wang PN, Chou KH, Wang J, He Y, Lin CP. 2010. Diffusion tensor tractography reveals abnormal topological organization in structural cortical networks in Alzheimer's disease. J Neurosci 30:16876–16885 [DOI] [PMC free article] [PubMed] [Google Scholar]
- Luders E, Narr KL, Thompson PM, Rex DE, Jancke L, Toga AW. 2006. Hemispheric asymmetries in cortical thickness. Cereb Cortex 16:1232–1238 [DOI] [PubMed] [Google Scholar]
- Mori S, Crain BJ, Chacko VP, van Zijl PC. 1999. Three-dimensional tracking of axonal projections in the brain by magnetic resonance imaging. Ann Neurol 45:265–269 [DOI] [PubMed] [Google Scholar]
- Oldfield RC. 1971. The assessment and analysis of handedness: the Edinburgh inventory. Neuropsychologia 9:97–113 [DOI] [PubMed] [Google Scholar]
- Onnela JP, Saramaki J, Kertesz J, Kaski K. 2005. Intensity and coherence of motifs in weighted complex networks. Phys Rev E Stat Nonlin Soft Matter Phys 71:065103. [DOI] [PubMed] [Google Scholar]
- Petit L, Zago L, Vigneau M, Andersson F, Crivello F, Mazoyer B, Mellet E, Tzourio-Mazoyer N. 2009. Functional asymmetries revealed in visually guided saccades: an FMRI study. J Neurophysiol 102:2994–3003 [DOI] [PubMed] [Google Scholar]
- Price CJ. 2012. A review and synthesis of the first 20 years of PET and fMRI studies of heard speech, spoken language and reading. Neuroimage 62:816–847 [DOI] [PMC free article] [PubMed] [Google Scholar]
- Qazi AA, Radmanesh A, O'Donnell L, Kindlmann G, Peled S, Whalen S, Westin CF, Golby AJ. 2009. Resolving crossings in the corticospinal tract by two-tensor streamline tractography: method and clinical assessment using fMRI. Neuroimage 47Suppl 2:T98–T106 [DOI] [PMC free article] [PubMed] [Google Scholar]
- Rasmussen T, Milner B. 1977. The role of early left-brain injury in determining lateralization of cerebral speech functions. Ann N Y Acad Sci 299:355–369 [DOI] [PubMed] [Google Scholar]
- Shu N, Liu Y, Li K, Duan Y, Wang J, Yu C, Dong H, Ye J, He Y. 2011. Diffusion tensor tractography reveals disrupted topological efficiency in white matter structural networks in multiple sclerosis. Cereb Cortex 21:2565–2577 [DOI] [PubMed] [Google Scholar]
- Shulman GL, Pope DL, Astafiev SV, McAvoy MP, Snyder AZ, Corbetta M. 2010. Right hemisphere dominance during spatial selective attention and target detection occurs outside the dorsal frontoparietal network. J Neurosci 30: 3640–3651 [DOI] [PMC free article] [PubMed] [Google Scholar]
- Smith DV, Clithero JA, Rorden C, Karnath HO. 2013. Decoding the anatomical network of spatial attention. Proc Natl Acad Sci U S A 110:1518–1523 [DOI] [PMC free article] [PubMed] [Google Scholar]
- Sporns O, Chialvo DR, Kaiser M, Hilgetag CC. 2004. Organization, development and function of complex brain networks. Trends Cogn Sci 8:418–425 [DOI] [PubMed] [Google Scholar]
- Sporns O, Tononi G, Kotter R. 2005. The human connectome: a structural description of the human brain. PLoS Comput Biol 1:e42. [DOI] [PMC free article] [PubMed] [Google Scholar]
- Sporns O, Zwi JD. 2004. The small world of the cerebral cortex. Neuroinformatics 2:145–162 [DOI] [PubMed] [Google Scholar]
- Stam CJ, Jones BF, Nolte G, Breakspear M, Scheltens P. 2007. Small-world networks and functional connectivity in Alzheimer's disease. Cereb Cortex 17:92–99 [DOI] [PubMed] [Google Scholar]
- Steinmetz H. 1996. Structure, functional and cerebral asymmetry: in vivo morphometry of the planum temporale. Neurosci Biobehav Rev 20:587–591 [DOI] [PubMed] [Google Scholar]
- Szaflarski JP, Binder JR, Possing ET, McKiernan KA, Ward BD, Hammeke TA. 2002. Language lateralization in left-handed and ambidextrous people: fMRI data. Neurology 59:238–244 [DOI] [PubMed] [Google Scholar]
- Tian L, Wang J, Yan C, He Y. 2011. Hemisphere- and gender-related differences in small-world brain networks: a resting-state functional MRI study. Neuroimage 54:191–202 [DOI] [PubMed] [Google Scholar]
- Toga AW, Thompson PM. 2003. Mapping brain asymmetry. Nat Rev Neurosci 4:37–48 [DOI] [PubMed] [Google Scholar]
- Tremblay T, Monetta L, Joanette Y. 2004. Phonological processing of words in right- and left-handers. Brain Cogn 55:427–432 [DOI] [PubMed] [Google Scholar]
- Tuncer MC, Hatipoglu ES, Ozates M. 2005. Sexual dimorphism and handedness in the human corpus callosum based on magnetic resonance imaging. Surg Radiol Anat 27:254–259 [DOI] [PubMed] [Google Scholar]
- Tzourio-Mazoyer N, Landeau B, Papathanassiou D, Crivello F, Etard O, Delcroix N, Mazoyer B, Joliot M. 2002. Automated anatomical labeling of activations in SPM using a macroscopic anatomical parcellation of the MNI MRI single-subject brain. Neuroimage 15:273–289 [DOI] [PubMed] [Google Scholar]
- van den Heuvel MP, Stam CJ, Boersma M, Hulshoff Pol HE. 2008. Small-world and scale-free organization of voxel-based resting-state functional connectivity in the human brain. Neuroimage 43:528–539 [DOI] [PubMed] [Google Scholar]
- Wang R, Beener T, Sorensen A, Weeden V. 2007. Diffusion toolkit: a software package for diffusion imaging data processing and tractography. Proc Intl Soc Mag Reson Med 15:3720 [Google Scholar]
- Watkins KE, Paus T, Lerch JP, Zijdenbos A, Collins DL, Neelin P, Taylor J, Worsley KJ, Evans AC. 2001. Structural asymmetries in the human brain: a voxel-based statistical analysis of 142 MRI scans. Cereb Cortex 11:868–877 [DOI] [PubMed] [Google Scholar]
- Watts DJ, Strogatz SH. 1998. Collective dynamics of ‘small-world’ networks. Nature 393:440–442 [DOI] [PubMed] [Google Scholar]
- Westin CF, Maier SE, Mamata H, Nabavi A, Jolesz FA, Kikinis R. 2002. Processing and visualization for diffusion tensor MRI. Med Image Anal 6:93–108 [DOI] [PubMed] [Google Scholar]
- Witelson SF, Goldsmith CH. 1991. The relationship of hand preference to anatomy of the corpus callosum in men. Brain Res 545:175–182 [DOI] [PubMed] [Google Scholar]
- Yan C, Gong G, Wang J, Wang D, Liu D, Zhu C, Chen ZJ, Evans A, Zang Y, He Y. 2011. Sex- and brain size-related small-world structural cortical networks in young adults: a DTI tractography study. Cereb Cortex 21:449–458 [DOI] [PubMed] [Google Scholar]
- Zalesky A, Fornito A, Harding IH, Cocchi L, Yucel M, Pantelis C, Bullmore ET. 2010. Whole-brain anatomical networks: does the choice of nodes matter? Neuroimage 50:970–983 [DOI] [PubMed] [Google Scholar]
- Zhang Z, et al. 2011. Altered functional-structural coupling of large-scale brain networks in idiopathic generalized epilepsy. Brain 134:2912–2928 [DOI] [PubMed] [Google Scholar]
Associated Data
This section collects any data citations, data availability statements, or supplementary materials included in this article.