

Abstract
Background and Purpose:
Spinal cord toxicity can be dreaded complication while treating head and neck cancer by conventional radiotherapy. Cord sparing approach is applied by two phase planning in conventional head neck radiotherapy. In spite of cord sparing approach spinal cord still receives considerable scatter dose. Our study aims to do the volumetric analysis of spinal cord dosimetry and to correlate with the clinical findings.
Materials and Methods:
Treatment planning was done in two phases. First phase treatment fields include gross disease- both tumor and involved nodes. in the second phase, treatment field shrinkage was done to cover the gross disease sparing the spinal cord. These fields are termed as off-cord fields. 42 patients with histological proven squamous cell carcinoma of the head and neck region were analysed with two groups. In Group A, 46 Gy was given in 23 fractions, and then tumor-boost with off-cord field received 24 Gy in 12 fractions. In Group B 50 Gy was prescribed in 25 fractions initially, then off-cord field given 20 Gy in 10 fractions to analyze theoutcome. Planning Computed tomography (CT) scan was done Philips Brilliance 16 slice CT scan machine, and contouring and dose calculation were done at ASHA treatment planning software.
Results:
Maximum dose and dose at 1 cm3, 2 cm3, and 5 cm3 were calculated. Maximum dose to cord was 52.6 Gy (range 48.1-49.7 Gy) in Group A and 54.3 Gy (range 51.48-52.33 Gy) in Group B initially. Off-cord fields received mean dose 8.07 Gy (85.85% of maximum) in Group A and 5.47 Gy (86.84% of maximum) in Group B. At the end of 6 months from the last date of radiotherapy, grade 1 spinal cord toxicity found in two patients in Group A and one patient in Group B respectively (P = 0.55). Both groups received additional dose, which are higher than the prescribed dose, but no patients show significant spinal cord toxicity after 6 month of follow-up.
Conclusion:
Spinal cord received scatter dose which much higher than the predicted dose in conventional radiotherapy of head neck cancer. Short term follow up failed to establish clinical correlation with volumetric dose of spinal cord. Two phase cord sparing head neck radiation planning if practiced should be used with caution.
Keywords: Head neck cancer, off-cord field, spinal cord, volumetric analysis
Introduction
Spinal cord is an important organ at risk in head and neck irradiation. Radiation damage to the spinal cord is one of the most dreaded complications in the clinical practice of radiotherapy.[1,2,3] Radiation oncologists consequently are always concerned about the dose to the spinal cord. It is a common practice to arrange parallel opposed neck fields in treatment of head and neck cancers.[3] Prevailing clinical judgment holds that opposed lateral treatment fields of head and neck cancer be limited to 45 Gy to exclude the spinal cord from further direct irradiation[4,5,6] and is common in protocol designs. It is well-known that the spinal cord continues to receive additional dose during standard treatment with “off-cord” fields, but the literature does not recommend limitations on this additional scatter dose.[7] Therefore, the actual total dose to the cord from all phases of treatment is generally not well-documented. In addition, clinical studies on the spinal cord tolerance often do not explicitly state whether or not the scatter dose is included in the total doses reported.[1,2,8,9] Therefore, a clinical decision must be made as to what limit to set for the total dose to the cervical spinal cord for head and neck treatments, especially when doing 3-D treatment planning.
Complex treatment geometries for treatment of head and neck cancer are used for normal tissue sparing and/or dose escalation protocols.[10,11] These approaches require defined tolerance limits on normal structures such as the cord so that appropriate plans can be designed to conformally treat the tumor and nodal volumes.[10] If the total dose to the cord is limited to 45 Gy, it was realized that an unnecessary constraint would be introduced since more than 45 Gy has been given in the past with a low risk of myelitis.[8] In our study, we sought to set a cord dose limit that is reasonable in the 3-D treatment planning setting without increasing either the actual dose given to the cord or the risk of a complication.
As a first approach to setting a cord dose limit, the total dose to be determined from the standard plan (consisting of a composite of initial opposed lateral fields and the tumor boost with off-cord fields). In our department, standard parallel opposed lateral fields were used to deliver the first 46 Gy. Fields would be then reduced to exclude the spinal cord from direct radiation. The cord receives at least 46 Gy from the initial large fields and an additional dose from the off-cord photon fields. This combination of primary and scattered irradiation of the cord has been given for decades with a low (<1%) risk of myelitis occurrence.[4,5,8]
The aim of this treatment planning study was to determine the total cord dose from 3-D dose distributions for head and neck treatments delivered with traditional opposed lateral fields, designed following textbook recommendations.[12]
Materials and Methods
To conduct the study, we included (n = 42) patients with head and neck cancer with histological or cytological proof, attending the Out-patient service of radiotherapy of a tertiary care Institution of eastern India. Inclusion criteria were patients with biopsy-proven, previously untreated, stage III or IV Squamous Cell Carcinoma of the oral cavity, oropharynx, hypopharynx, or larynx and ECOG (Eastern Co-operative Oncology Group) performance status (PS) 0-2. Those patients who have been treated with upfront chemoradiotherapy with injection Cisplatin 100 mg/m2 at three weekly interval were selected for this dosimetric analysis. Patients with major co morbidities like uncontrolled diabetes, hypertension, haemoglobin level < 10 g/dL were not included in study. All the patients were treated in between January 2011-June 2011. Patients’ data were selected from CT dataset at random. Follow up was done at monthly interval for initial 6 months. Data analysis was done on April 2012. Last follow up was taken at February 2012.
The initial assessment in all patients included a complete medical history and physical examination, endoscopy and biopsy, complete blood count and biochemical profile, chest X-ray, and computed tomography (CT) of the head and neck following our institutional protocol. Bone scan and abdominal ultrasound were performed at the discretion of the treating physician. Pre-treatment evaluation also included complete dental evaluation and nutritional assessment. Dental evaluation was performed for consideration of tooth extraction if needed because the radiation may worsen the condition. Poor nutritional status is the common cause of discontinuation of treatment so in our institution, we have performed Ryle's tube insertion before treatment in patients having difficulties in taking food.
Patients were immobilized with thermoplastic immobilization device (Orfit) before the start of the treatment Lateral opposed fields were used to treat the primary tumor and nodal region. Uninvolved level II to V nodes were included in the initial treatment volume in all patients and uninvolved level I nodes were also included in the oral cavity cancers to ensure microscopic coverage. Treatment fields were drawn on digital reconstructed radiographs generated from the CT dataset in a standard fashion (based on wire marking at manual field border). Doses of 46 Gy were to be given in the mid plane of the initial fields treating the target volume and neck nodes using parallel opposed Co-60 photon lateral fields.[13] To deliver total dose 70 Gy to tumor tissue, patients received two sets of treatment. The two sets of treatments commonly given to the patients included: Group A received 46 Gy/23 fractions/4.5 weeks in initial phase (phase 1), then field shrinkage was performed to cover only the gross disease and 24 Gy/12 fractions/2.5 weeks given as off-cord tumor boost (phase 2).
Group B received 50 Gy/25 fractions/5 weeks in initial phase (phase 1) then field shrinkage was performed to cover only the gross disease and 20 Gy/10 fractions/2 weeks given as off-cord. We took 42 patients from the treatment groups to analyze their CT data for dosimetric study. [Table 1] As dosimetric data were calculated from the retrospective dataset those groups were not randomized.
Table 1.
Descriptive analysis of patients
Tumor boost (phase 2) was done viewing the CT scan and the posterior border was kept at the mid vertebral body to spare the spinal cord by conventional treatment planning; posterior border was confirmed by radio opaque wire marking. Dosimetric studies were done retrospectively by transferring the CT scan data of those patients to ASHA treatment planning software later to calculate the dose received by spinal cord after contouring. ASHA (Tsg Integration, Division of intelligent instruments private limited, New Delhi. Version name: Tsg Asha 3d Xrt Planning System Service) treatment planning system (TPS) was used for planning and contouring. Spinal cord contouring was done inside the vertebral bodies close to canal wall; no allowance was made for thickness of the dura. Three dimensional reconstructed image of whole spinal cord was visualized. From the set-up tool, beams were arranged according to the radiopaque wire marks to the manual fields first to cover gross tumor volume and appropriate neck node stations. Tumor coverage was viewed with the beams eye view and dose was prescribed.[14] [Figure 1] After prescription of dose, the dose volume histogram data were selected to find out 1 cm3, 2 cm3, and 5 cm3 doses [Figure 2]. In both groups for all fields, similar methods were applied.
Figure 1.
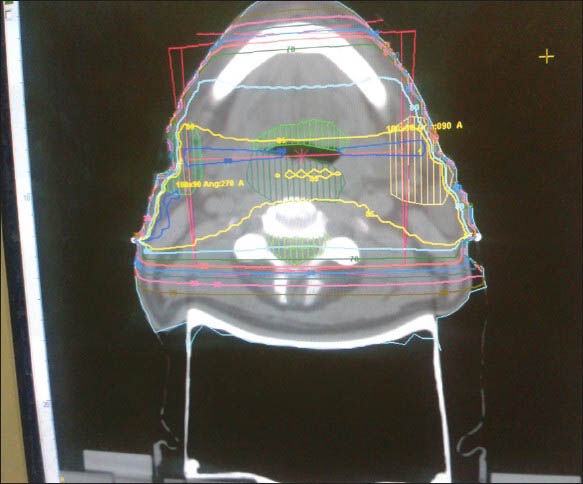
Phase 1 radiation planning by parallel opposed beam for head neck cancer treatment. Tumor is shown in red and nodal station is shown in green color. Spinal cord received full dose
Figure 2.
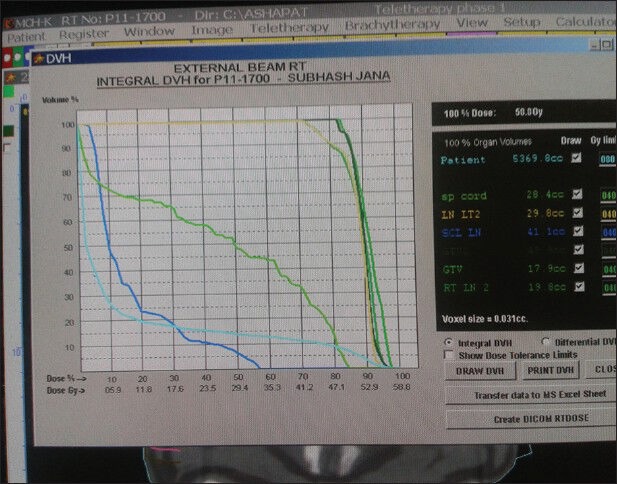
Dose volume histogram of different structures at phase 1 treatment planning
We have calculated three-dimensional dose distributions for the spinal cord using 3-D TPS.[15,16,17,18] Dose calculations throughout the 3-D patient volumes were performed using photon[17] algorithm. Dose was calculated for a selected or all beams, for a selected or central or all slices. A 3-D dose matrix of relative dose factors is created. Dose is computed for a grid of 10,000 points per section, and then interpolated for any finer grid resolution. Analytical models, interpolation from measured beam data, pencil beam algorithm, Clarkson scatter dose calculation by integration of contribution from sectors, are supported. Equivalent path length technique for inhomogeneity and surface correction is used. Incident and Exit dose on the central axis of each beam (after modification) is computed. Dose statistics such as maximum, minimum, mean, median, and model dose to each structure is computed. Choice of normalization methods is supported including normalization at ICRU (International Commission on Radiation Units and Measurements) point. “Beam ON” time in minutes is calculated for the prescribed dose with a given fractionation schedule. Automatic decay correction for isotope (cobalt-60) is applied. Patients were followed up prospectively. After 6 months of treatment, spinal cord toxicity was assessed with (radiation therapy oncology group) toxicity criteria.[19] (6 months calculated from the last day of radiotherapy.) Patient's written informed consent was taken for the prospective follow up portion of the study.
Statistical analysis
Statistical analysis was performed by MedCalc Software Version 11.6.1-© 1993-2011 (last modified: June 6, 2011). Chi-square and independent samples t-tests were used for comparison between the patient groups. Mann-Whitney test was done to compare the toxicity in two groups.
Results
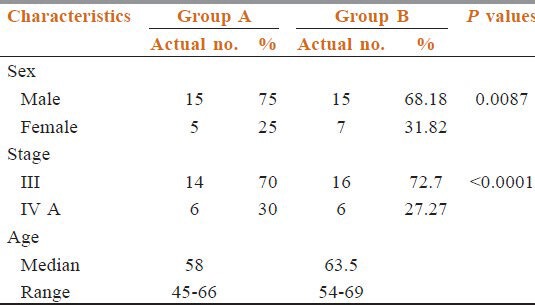
The characteristics of patients included in two series were comparable. Median ages for Group A and Group B were 58 years (range: 45-66 years), 63.5 years (range: 54-69 years). All patients had performance status ECOG (Eastern Cooperative Oncology Group) score less than or equal to 2. Stage III patients were predominant in two groups (70% in Group A, 72.72% in Group B). All forty two patients with locally advanced squamous cell carcinoma of the head and neck were treated with previously mentioned protocols.
Table 1 shows the pre-treatment patients characteristics. They were well-balanced among the both treatment groups. Our patient pool had male preponderance (Group A 75% and Group B 68.19%).
We have calculated the maximum dose received at any point of spinal cord (MDSC), dose received by 1c.c (V1), 2c.c. (V2), and 5c.c. (V5) volumes of spinal cord in each group of patients separately. Our aim was to try to correlate the toxicities if it would at all occur, to the volumetric dose distribution data of spinal cord.
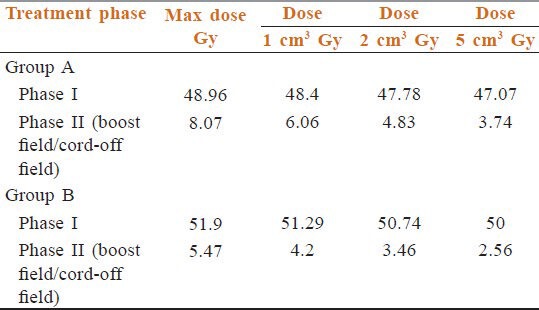
Table 2 data shows MDSC in phase 1 in Group A was 52.6 Gy though, we have prescribed 46 Gy. Mean of all MDSC was 48.96 (95% confidence interval (CI) =48.1-49.7, SD = 1.73, variance = 3.00, median = 48.75). In Group B also we prescribed 50 Gy in 25 fractions in 5 weeks, but the maximum dose received 54.3 Gy. Mean of all MDSC was 51.9 Gy (95% CI = 51.48-52.33, SD = 0.96, variance = 0.92, median = 51.9). So, initial fields as such received the higher dose than expectations. 1 cm3, 2 cm3, 5 cm3 volumes of Group A received mean doses 48.4 Gy, 47.78 Gy, 47.07 Gy Group B got mean doses 51.29 Gy, 50.74 Gy, 50 Gy respectively. It is clear that each volume received much higher dose even in the initial phase. These prove the need to calculate the scatter dose contributions in phase 2.
Table 2.
Phase 1 dosimetry
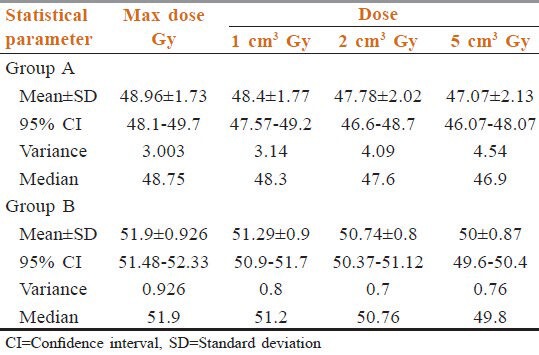
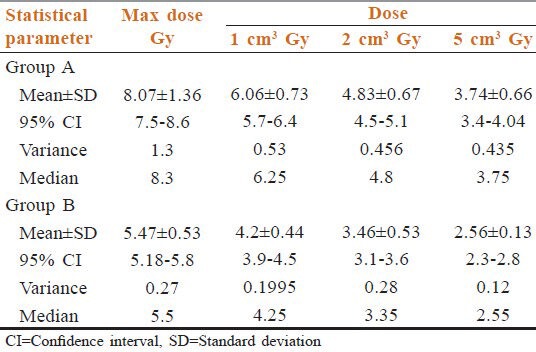
Table 3 shows MDSC in off-cord fields in Group A was 9.4 Gy (median = 8.3, mean = 8.07, CI for mean = 7.5-8.6, SD for mean values = 1.16, variance = 1.3). Maximum dose in off- cord fields in Group B was 6.3 Gy (mean = 5.47, 95% CI = 5.47-5.24, SD = 0.9, variance = 0.92 and median = 51.9). Again after analyzing volumetric dose distribution, we have found mean V1, V2, and V5 in Group A is 6.06 Gy, 4.83 Gy, 3.74 Gy and in Group B these values are 4.2 Gy, 3.46 Gy, 2.56 Gy respectively.
Table 3.
Phase 2 dosimetry
In Table 4, we can see mean dose to cord in off-cord field in Group A was 85.85% of MDSC and in Group B it was 86.82%. Mean V1 was 85.35% and 82.35% of respective maximum doses in Group A and Group B respectively. In Table 5, all mean doses are given.
Table 4.
Dosimetry phase 2 comparison
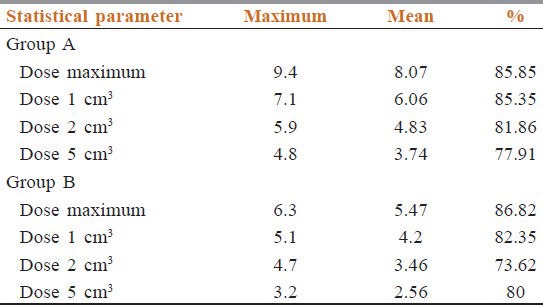
Table 5.
Mean doses at different volumes in two groups
On 6 month follow-up of these patients, we found two cases with grade 1 toxicity in Group A patients and only one patients with grade 1 toxicity in Group B patients respectively. Mann-Whitney test for independent samples done and this toxicity in both groups are found to be statistically insignificant (P = 0.55).
Discussion
We got an idea of total dose received by spinal cord with our study. On an average initial field got 48.96 Gy when prescribed 46 Gy for treatment and 51.9 Gy on 50 Gy prescriptions. We found that in addition to the prescribed dose given before reduction of the initial fields, an average of 8.07 Gy and 5.47 Gy were given to the cord due to scatter from off-cord laterals in two arms.
Marcus and Million[13] reported the incidence of cervical spinal cord injury to be 0.18% for 1112 patients receiving doses of 30 Gy or higher from treatment of head and neck cancers. None of patients with cord doses ≤50 Gy (not including scatter and transmission dose) developed radiation myelitis. McCunniff and Liang studied 144 patients (with head and neck cancer) who received 56-65 Gy to the cord from opposed lateral treatment fields.[9] One patient who received 60 Gy at 2 Gy per fraction developed myelitis.
Cohen and Creditor used data from 96 patients to estimate a risk of 5% for a dose of 49.34 Gy in 25 fractions.[20] These clinical data strongly suggest that the dose of 50 Gy given in 1.8-2.0 Gy fractions is associated with a 1% risk level. This opinion has been expressed by others.[21] Based on these and other series using larger doses per fractions, the incidence for myelopathy at 45 Gy in fractions of 1.8-2.0 Gy is most likely below 0.2% and is certainly less than the 5% quoted in major textbooks. The best estimate of the conventionally fractionated dose causing a 5% incidence of delayed cervical is 57-61 Gy[21] and for 50% Incidence of myelopathy, the dose is probably in the 68-73 Gy range.[5] Unfortunately, according to most of the authors, the published clinical data are inadequate for valid statistical dose-response analysis.[5]
Wong et al.[1] stated that not a single incidence of myelitis occurred following an equivalent dose of 50 Gy in 1.8-2.0 Gy daily fractions to the cord. These clinical data strongly suggest that 50 Gy given in 1.8-2.0 Gy fractions is associated with a <1% risk level. This opinion has been expressed by others.[4,5,6]
Clinical evidence in some studies suggests that there may be an effect of volume or length of spinal cord irradiated on the incidence of radiation myelopathy.[7] Other clinical studies have not substantiated this impression.[22] The tolerance dose for the spinal cord was estimated by Emami et al.[10] to be 50 Gy for a 10 cm cord length, with a 5% chance of a complication occurring in 5 years. The 5% figure was perhaps an overestimate of the actual complication as indicated by recent clinical data. The volume effects may be related to the vascular supply, collateral circulation and/or ability to re-establish damaged vasculature by revascularization from field edges being affected by volume. Vascular damage has been demonstrated in many reports to be very important in the radiation response of the spinal cord.[23] The release of cytokines and mediators of inflammation may be affected by volume, with large volumes causing the release of larger quantities of potentially damaging substances.[23] Cytokines and mediators of inflammation have been shown to be released in the spinal cord after irradiation.[23] Reanalysis of a published data did not conclusively demonstrate a volume-dependent change in the slope of dose-response curves and it must be considered an open question as to whether one exists. Parallel or nearly parallel dose-response curves for the spinal cord end-points imply that a volume effect estimated at the 50% probability of injury would also hold at low probabilities of injury typical of the clinic.[22] In the recent publication, it has been shown that with conventional fractionation of 2 Gy/day including the full cord cross-section, a total dose of 50 Gy, 60 Gy, and 69 Gy are associated with a 0.2, 6, and 50% rate of myelopathy.[24] QUANTEC (Quantitative Analysis of Normal Tissue Effects in the Clinic) recommendation is mean dose to the spinal cord should be less than 45 Gy and 0.3 cc volume should receive less than 50 Gy.
The rational of choosing 50 Gy in first phase of treatment in our study was the QUANTEC data of 0.2% chance of myelopathy if total cord has received dose more than 50 Gy. 0.2% chance of myelopathy is almost negligible. In our institution, we have rarely faced a case of radiation myelitis. This observation helps us to plan for the present study. We have got huge patient load in our center that prevents us to treat every patient by 3-D treatment planning. We generally treat the patients by conventional two dimensional treatment planning. We have put the manual treatment field in the treatment planning software to find out the calculated dose at different volumes of spinal cord. We have studied limited number of patients with short follow-up period, probably that may be the cause of not finding any toxicity. In our study, mean dose to the spinal cord after the second phase exceeds even 50 Gy, still no toxicity has been reported in this short follow-up report. Our long-term data may help us to guide whether more relaxation regarding spinal cord dose constraint can be made or not.
In our study, we report mainly the actual additional dose to cord in both phases of treatments. Actually, there are some limitations of this study. We did not take into account the biological dose only dealt with the physical dose. During planning maximum, dose was found in some slices depending on patient contours. Study can be done to find out any relevance of particular maximum dose points with any anatomical landmarks or some external factors like neck rests or immobilization procedures. The software we have used is rarely used in other centers, due to massive technical development new software for photon dose calculation has been made. More complex mathematical formalisms will give more accurate doe volume data. Still our study has got some importance because in predicting the toxicity and its dosimetric correlation data based on modern calculation algorithm is not matured yet.
Conclusions
Spinal cord toxicities can lead to dreaded complications, so more studies to compare clinical outcome with dosimetric analyses are to be done in future. We have taken follow-up data at the end of 6 months from the last date of radiation and found no significant toxicity. Our plan is to follow-up these patients in coming years to get a longer follow-up for any sign of neurological impairments and to correlate with our dosimetric data. It will be necessary in the future to continue the analysis of spinal cord dose in order to describe the dose–volume histogram, which is an appropriate safe limit for the spinal cord dose.
Footnotes
Source of Support: Nil.
Conflict of Interest: None declared.
References
- 1.Wong CS, Van Dyk J, Milosevic M, Laperriere NJ. Radiation myelopathy following single courses of radiotherapy and retreatment. Int J Radiat Oncol Biol Phys. 1994;30:575–81. doi: 10.1016/0360-3016(92)90943-c. [DOI] [PubMed] [Google Scholar]
- 2.Abbatucci JS, Delozier T, Quint R, Roussel A, Brune D. Radiation myelopathy of the cervical spinal cord: Time, dose and volume factors. Int J Radiat Oncol Biol Phys. 1978;4:239–48. doi: 10.1016/0360-3016(78)90144-x. [DOI] [PubMed] [Google Scholar]
- 3.Ang KK, Kaanders JH, Peters LJ. Ang KK, Kaanders JH, Peters LJ. Radiotherapy for Head and Neck Cancers: Indications and Techniques. Ch. 3. Philadelphia, PA: Lea and Febiger; 1994. Practical aspects of external beam therapy; pp. 15–9. [Google Scholar]
- 4.Schultheiss TE. Spinal cord radiation tolerance. Int J Radiat Oncol Biol Phys. 1994;30:735–6. doi: 10.1016/0360-3016(92)90964-j. [DOI] [PubMed] [Google Scholar]
- 5.Schultheiss TE. Spinal cord radiation “tolerance”: Doctrine versus data. Int J Radiat Oncol Biol Phys. 1990;19:219–21. doi: 10.1016/0360-3016(90)90157-f. [DOI] [PubMed] [Google Scholar]
- 6.Parsons JT. The effect of radiation on normal tissues of the head and neck. In: Million RR, Cassisi NJ, editors. Management of Head and Neck Cancer: A Multidisciplinary Approach. Philadelphia, PA: J.B Lippincott; 1994. pp. 245–89. [Google Scholar]
- 7.Wara WM, Phillips TL, Sheline GE, Schwade JG. Radiation tolerance of the spinal cord. Cancer. 1975;35:1558–62. doi: 10.1002/1097-0142(197506)35:6<1558::aid-cncr2820350613>3.0.co;2-7. [DOI] [PubMed] [Google Scholar]
- 8.Marcus RB, Jr, Million RR. The incidence of myelitis after irradiation of the cervical spinal cord. Int J Radiat Oncol Biol Phys. 1990;19:3–8. doi: 10.1016/0360-3016(90)90126-5. [DOI] [PubMed] [Google Scholar]
- 9.McCunniff AJ, Liang MJ. Radiation tolerance of the cervical spinal cord. Int J Radiat Oncol Biol Phys. 1989;16:675–8. doi: 10.1016/0360-3016(89)90484-7. [DOI] [PubMed] [Google Scholar]
- 10.Emami B, Lyman J, Brown A, Coia L, Goitein M, Munzenrider JE, et al. Tolerance of normal tissue to therapeutic irradiation. Int J Radiat Oncol Biol Phys. 1991;21:109–22. doi: 10.1016/0360-3016(91)90171-y. [DOI] [PubMed] [Google Scholar]
- 11.Majumder D, Choudhury K, Das P, Kundu S, Mitra D. Different fractionation fractionation schedules of radiotherapy in locally advanced head and neck malignancy: A prospective randomized study to compare the results of treatment and toxicities of different protocols. South Asian J Cancer. 2013;2:31–5. doi: 10.4103/2278-330X.105890. [DOI] [PMC free article] [PubMed] [Google Scholar]
- 12.Bedwinek JM, Perez CA. Carcinoma of the nasopharynx. In: Perez CA, Brady LW, editors. Principles and Practice of Radiation Oncology. Philadelphia, PA: J.B. Lippincott; 1987. pp. 479–98. [Google Scholar]
- 13.Kessler ML, Ten Haken RK, Fraass BA, McShan DL. Expanding the use and effectiveness of dose-volume histograms for 3-D treatment planning. I: Integration of 3-D dose-display. Int J Radiat Oncol Biol Phys. 1994;29:1125–31. doi: 10.1016/0360-3016(94)90409-x. [DOI] [PubMed] [Google Scholar]
- 14.McShan DL, Fraass BA, Lichter AS. Full integration of the beam's eye view concept into computerized treatment planning. Int J Radiat Oncol Biol Phys. 1990;18:1485–94. doi: 10.1016/0360-3016(90)90325-e. [DOI] [PubMed] [Google Scholar]
- 15.McShan DL, Fraass BA. Use of an octree-like geometry for 3-D dose calculations. Med Phys. 1993;20:1219–27. doi: 10.1118/1.597151. [DOI] [PubMed] [Google Scholar]
- 16.McShan DL, Fraass BA, Ten Haken RK. Dosimetric verification of a 3-D electron pencil beam dose calculation algorithm. Med Phys. 1994;21:13–23. doi: 10.1118/1.597363. [DOI] [PubMed] [Google Scholar]
- 17.Fraass BA, McShan DL. 3-D treatment planning: I. Overview of a clinical planning system. In: Bruinvis I.A, D, editor. The Use of Computers in Radiation Therapy. Amsterdam: Elsevier; 1987. pp. 273–6. [Google Scholar]
- 18.Fraass BA, McShan DL, Ten Haken RK, Hutchins KM. 3-D treatment planning: V. A fast 3-D photon calculational model. In: Bruinvis IA, et al., editors. The Use of Computers in Radiation Therapy. Amsterdam: Elsevier; 1987. pp. 521–5. [Google Scholar]
- 19.Cox JD, Stetz J, Pajak TF. Toxicity criteria of the radiation therapy oncology group (RTOG) and the European organization for research and treatment of cancer (EORTC) Int J Radiat Oncol Biol Phys. 1995;31:1341–6. doi: 10.1016/0360-3016(95)00060-C. [DOI] [PubMed] [Google Scholar]
- 20.Cohen L, Creditor M. An iso-effect table for radiation tolerance of the human spinal cord. Int J Radiat Oncol Biol Phys. 1981;7:961–6. doi: 10.1016/0360-3016(81)90017-1. [DOI] [PubMed] [Google Scholar]
- 21.Wang CC. Technical considerations of radiation therapy of head/neck tumors. In: Radiation Therapy for Head and Neck Neoplasms: Indications, Techniques and Results. In: Wang CC, editor. Year book medical. Chicago, IL: 1990. pp. 50–52. [Google Scholar]
- 22.Reinhold HS, Kaalen JG, Unger-Gils K. Radiation myelopathy of the thoracic spinal cord. Int J Radiat Oncol Biol Phys. 1976;1:651–7. doi: 10.1016/0360-3016(76)90147-4. [DOI] [PubMed] [Google Scholar]
- 23.Siegal T, Pfeffer MR. Radiation-induced changes in the profile of spinal cord serotonin, prostaglandin synthesis, and vascular permeability. Int J Radiat Oncol Biol Phys. 1995;31:57–64. doi: 10.1016/0360-3016(94)E0305-4. [DOI] [PubMed] [Google Scholar]
- 24.Kirkpatrick JP, Van der Kogel AJ, Schultheiss TE. The lessons of QUANTEC: Recommendations for reporting and gathering data on dose-volume dependencies of treatment outcome. Int J Radiat Oncol Biol Phys. 2010;76:42–9. doi: 10.1016/j.ijrobp.2009.08.074. [DOI] [PMC free article] [PubMed] [Google Scholar]